


- ➔ The world is not on track to achieve any of the seven global nutrition targets by 2030. Progress for low birthweight and for childhood overweight is stagnant, and the prevalence of anaemia in women aged 15 to 49 years has increased.
- ➔ While global stunting and wasting prevalences have been declining and levels of exclusive breastfeeding rising over the past decade, progress on these three indicators has still been too slow to reach the 2030 targets.
- ➔ New estimates of the prevalence of adult obesity reveal a steady increase over the last decade, from 12.1 percent (591 million people) in 2012 to 15.8 percent (881 million people) in 2022. It is projected that the number will increase to more than 1.2 billion by 2030.
- ➔ Regarding progress towards achievement of the 2030 global nutrition targets for children under five years of age, half of the countries worldwide are off track for stunting, more than two-thirds are off track for wasting, and about 60 percent are off track for overweight.
- ➔ Three-quarters of all countries worldwide are off track to achieve the 2030 global target for low birthweight and more than 40 percent are off track to reach the exclusive breastfeeding target. Almost all countries in the world are off track to attain the 2030 global targets for anaemia among women aged 15 to 49 years and for adult obesity.
- ➔ Compared to the global estimates, least developed countries (LDCs) have much higher levels of stunting in children under age five and anaemia in women aged 15 to 49 years, while childhood wasting is similar to the global average (but declining more rapidly) and prevalence of childhood overweight is lower. As in the rest of the world, there is a worrying rise in adult obesity in LDCs, even as undernutrition continues to disproportionately affect these countries.
- ➔ Globally, the double burden of malnutrition – defined as the co-existence of undernutrition together with overweight and obesity – has been on the rise over the last two decades, characterized by a sharp increase in obesity rates and with only a gradual decline in thinness and underweight. Underweight among adults and the elderly has been cut in half while obesity is on the rise in all age groups. The true rate of the double burden is much higher if all forms of malnutrition are considered, including micronutrient deficiencies.
- ➔ Double-duty actions simultaneously tackle undernutrition, micronutrient deficiencies, overweight and obesity by leveraging the common drivers shared by all forms of malnutrition. Such actions include provision of antenatal care, exclusive breastfeeding, provision of healthy, nutritious foods to children during the complementary feeding period and beyond, school-feeding programmes, micronutrient supplementation, social protection, nutrition-sensitive agriculture, food fortification, and policies that improve the food environment.
Nutrition is a maker and a marker of development.36 The benefits of good nutrition have widespread ripple effects, from families to communities, regions and nations. Malnutrition, on the other hand, hinders national progress and deeply compromises the health, development and well-being of present and future generations. Malnutrition broadly includes undernutrition and micronutrient deficiencies, as well as overweight and obesity. Ending malnutrition is foundational to the achievement of the SDGs, particularly SDG 2 (Zero Hunger), SDG 3 (Good Health and Well-being), and SDG 10 (Reduced Inequalities). The elimination of all forms of malnutrition37 worldwide is a top investment priority for the global health and development agenda.
Section 2.3 assesses global and regional trends for the seven global nutrition targets to 2030, in alignment with the 2030 Agenda for Sustainable Development. These include the six nutrition targets endorsed by the World Health Assembly in 2012 for 2025, which were subsequently extended to 2030.38 Four out of those six target indicators were also selected to monitor progress towards SDG Target 2.2, namely stunting, wasting and overweight in children under five years of age, and anaemia in women aged 15 to 49 years.39 The seventh target is to halt the rise in adult obesity, which the WHA adopted as part of the Global Action Plan for the Prevention and Control of Non-Communicable Diseases in 2013, with a target year of 2025.40 In 2016, the United Nations General Assembly (UNGA) proclaimed the United Nations Decade of Action on Nutrition (2016–2025)41 which further boosted actions to end hunger, eradicate all forms of malnutrition, and ensure universal access to healthier and more sustainable diets. This section further provides a progress assessment of the 45 countries currently classified as least developed countries (LDCs) by the United Nations, and an analysis of the double burden of malnutrition occurring in different stages of life, as the world witnesses a gradual decline in undernutrition alongside the growing overweight and obesity epidemic.
Assessing malnutrition through the life course lens42 highlights the critical timing of nutrition interventions in each period, from pre-conception, pregnancy and lactation, through infancy, childhood, adolescence, adulthood and older age. Exposure to environmental factors during these windows has the potential to shape the health trajectories of future generations. Malnutrition, including micronutrient deficiencies, during the vulnerable foetal, infant and early childhood stages increases morbidity and mortality risk,43, 44 delays physical growth, and weakens the immune system resulting in recurrent illness and infection; it can also lead to suboptimal cognitive development and permanent changes in the structure and function of organ systems, thus setting the stage for susceptibility to chronic diseases in adulthood.45, 46 Studies have shown that prenatal nutrition interventions can lead to improved birth outcomes, which in turn are associated with better education and human capital outcomes later in life.47, 48 Children who have access to more nutritious foods in early childhood are more economically productive in adulthood.49 In contrast, nutritional deficiencies during early childhood impair brain development, impact learning ability and school readiness, suppressing life-long achievement potential and exacerbating health disparities and social inequality.50 Monitoring the global nutrition indicators through the lens of the life course thus acknowledges the uniqueness of each life stage and supports national and global efforts to tackle the malnutrition landscape holistically.
Global and regional trends
This subsection provides the latest status for the seven nutrition targets at global level (Figure 10) and regionally (Table 7).
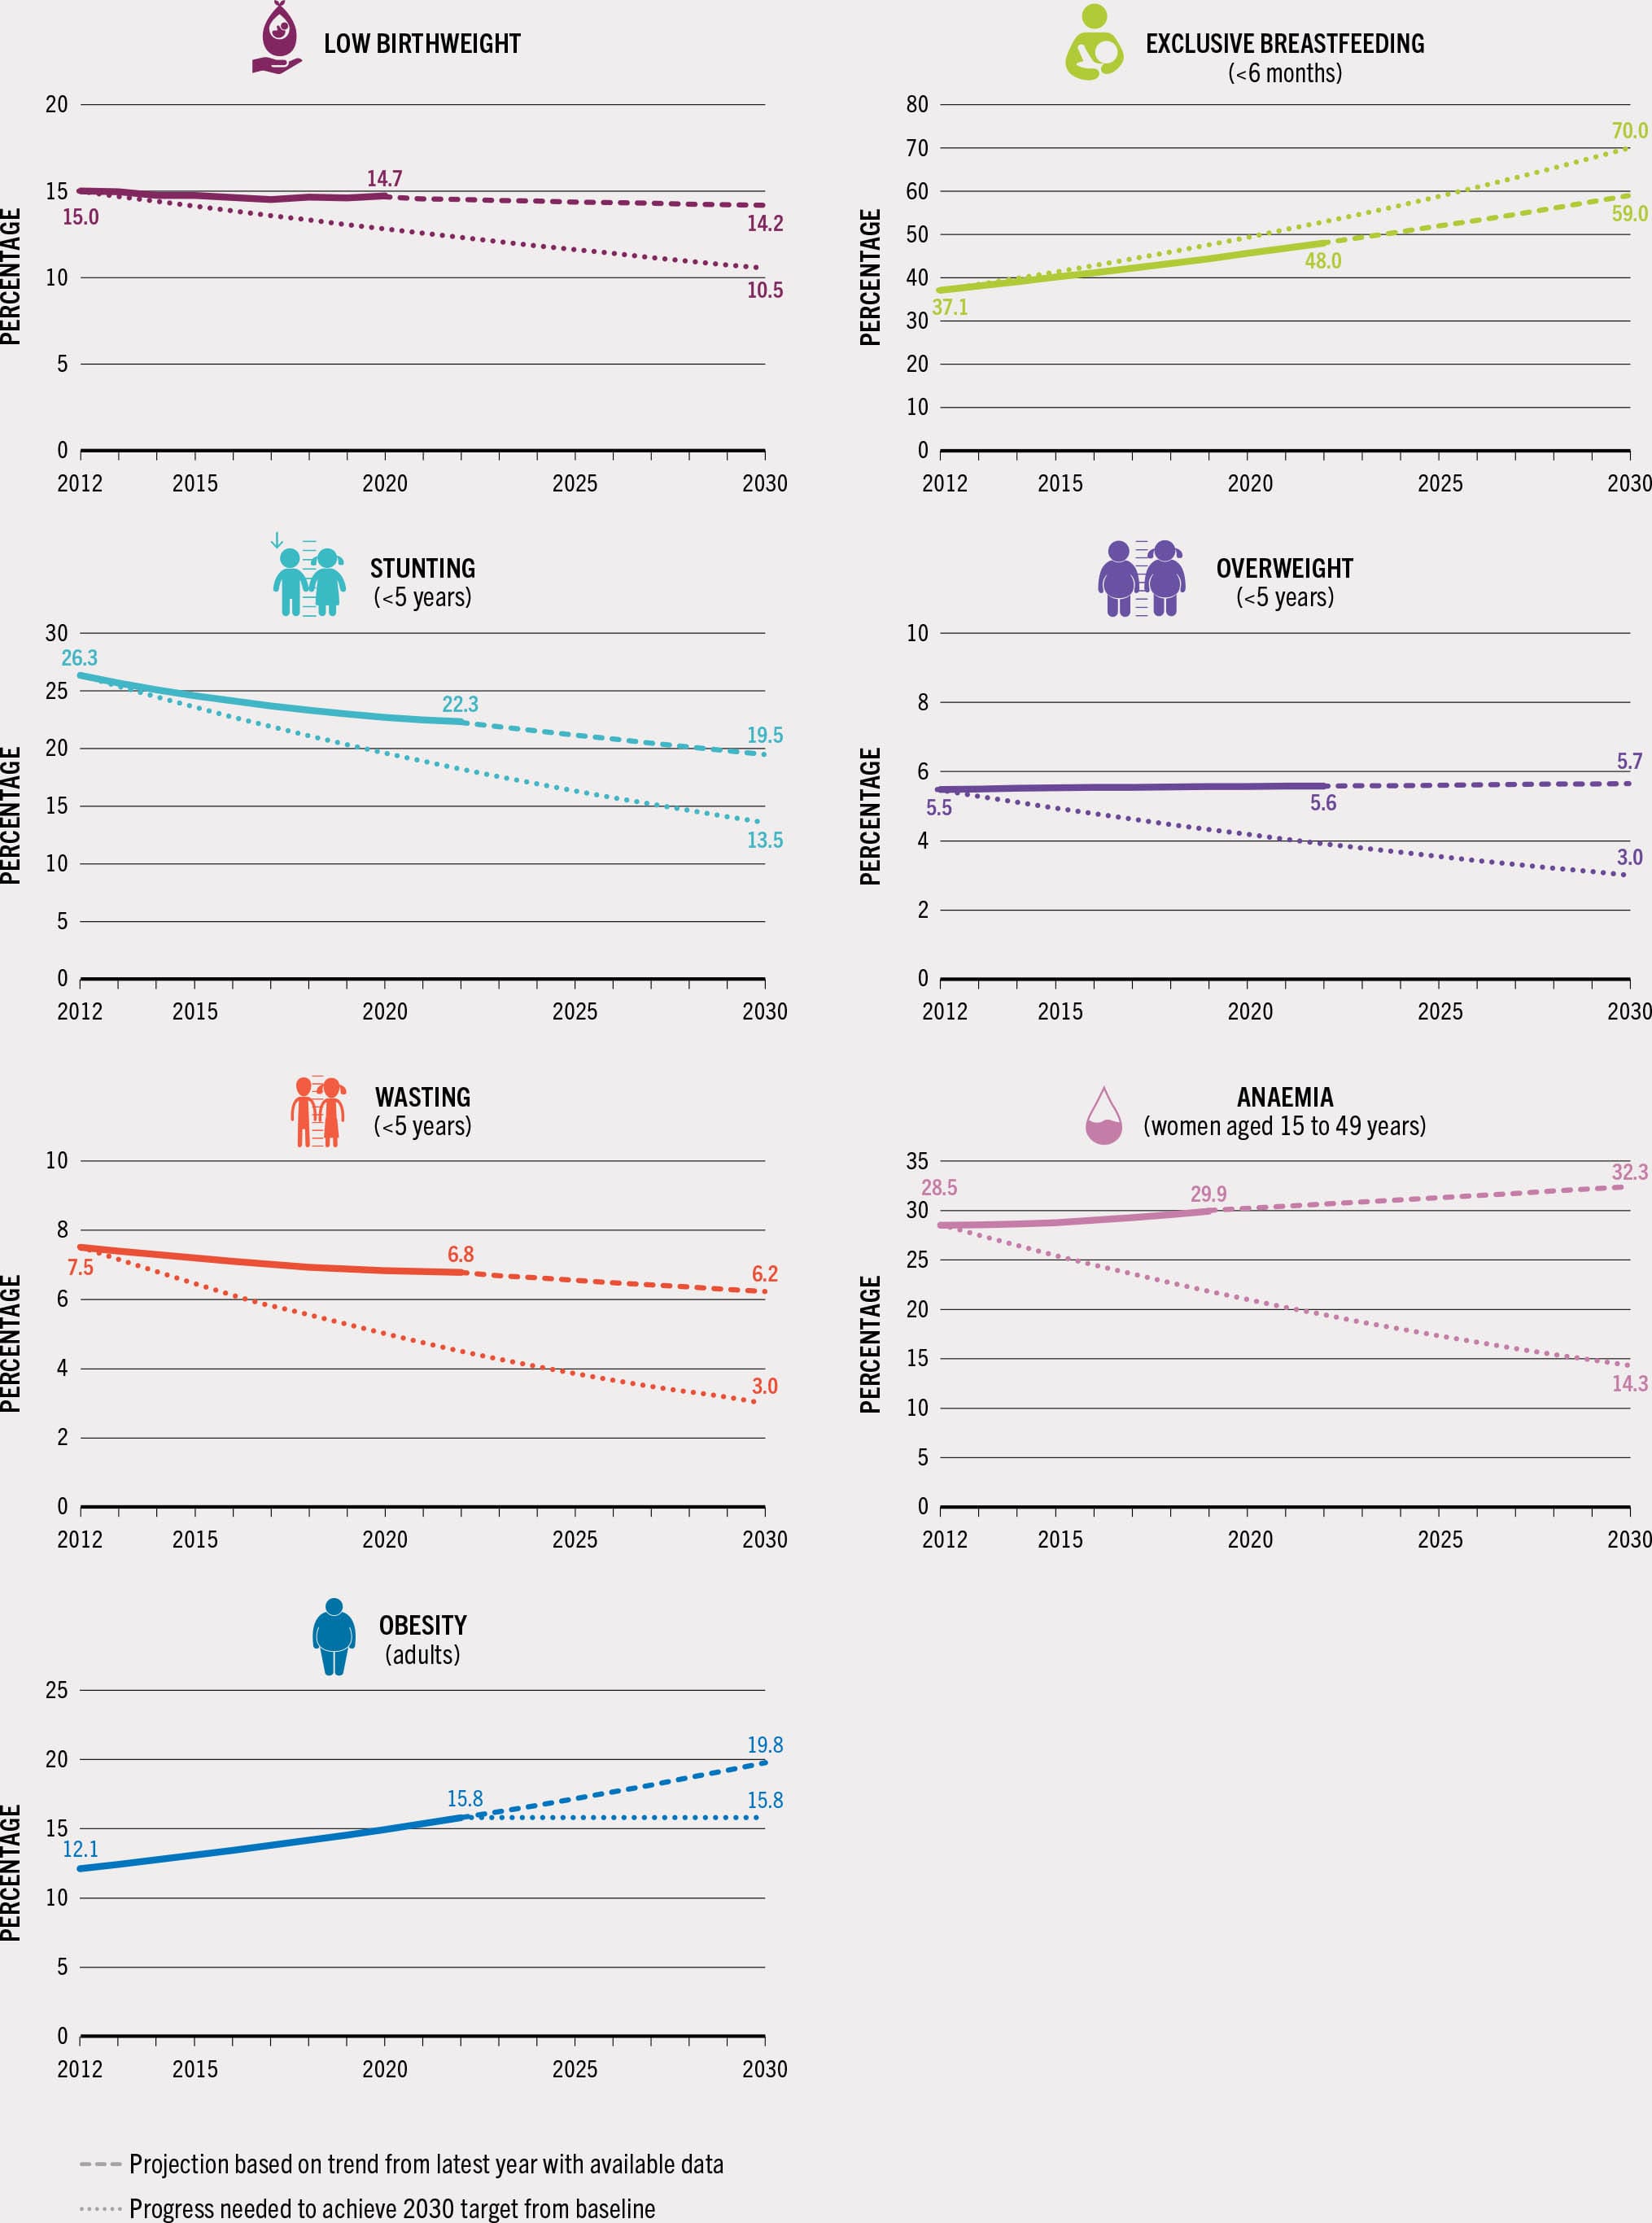
FIGURE 10 Global stunting and wasting prevalences have been declining and levels of exclusive breastfeeding rising over the past decade, but the world is not on track to achieve any of the seven global nutrition targets by 2030
SOURCES: Data for low birthweight are from UNICEF & WHO. 2023. Low birthweight. In: UNICEF. [Cited 24 July 2024]. https://data.unicef.org/topic/nutrition/low-birthweight; UNICEF & WHO. 2023. Joint low birthweight estimates. In: WHO. [Cited 24 July 2024]. https://www.who.int/teams/nutrition-and-food-safety/monitoring-nutritional-status-and-food-safety-and-events/joint-low-birthweight-estimates; data for exclusive breastfeeding are based on UNICEF. 2024. Infant and young child feeding. In: UNICEF. [Cited 24 July 2024]. https://data.unicef.org/topic/nutrition/infant-and-young-child-feeding; data for stunting, wasting and overweight are based on UNICEF, WHO & World Bank. 2023. Levels and trends in child malnutrition. UNICEF / WHO / World Bank Group Joint Child Malnutrition Estimates – Key findings of the 2023 edition. New York, USA, UNICEF, Geneva, Switzerland, WHO and Washington, DC, World Bank. https://data.unicef.org/resources/jme-report-2023, http://www.who.int/teams/nutrition-and-food-safety/monitoring-nutritional-status-and-food-safety-and-events/joint-child-malnutrition-estimates, https://datatopics.worldbank.org/child-malnutrition; data for anaemia are based on WHO. 2021. WHO global anaemia estimates, 2021 edition. In: WHO. [Cited 24 July 2024]. https://www.who.int/data/gho/data/themes/topics/anaemia_in_women_and_children; data for adult obesity are based on WHO. 2024. Global Health Observatory (GHO) data repository: Prevalence of obesity among adults, BMI ≥ 30, age-standardized. Estimates by country. [Accessed on 24 July 2024]. https://www.who.int/data/gho/data/indicators/indicator-details/GHO/prevalence-of-obesity-among-adults-bmi-=-30-(age-standardized-estimate)-(-). Licence: CC-BY-4.0.
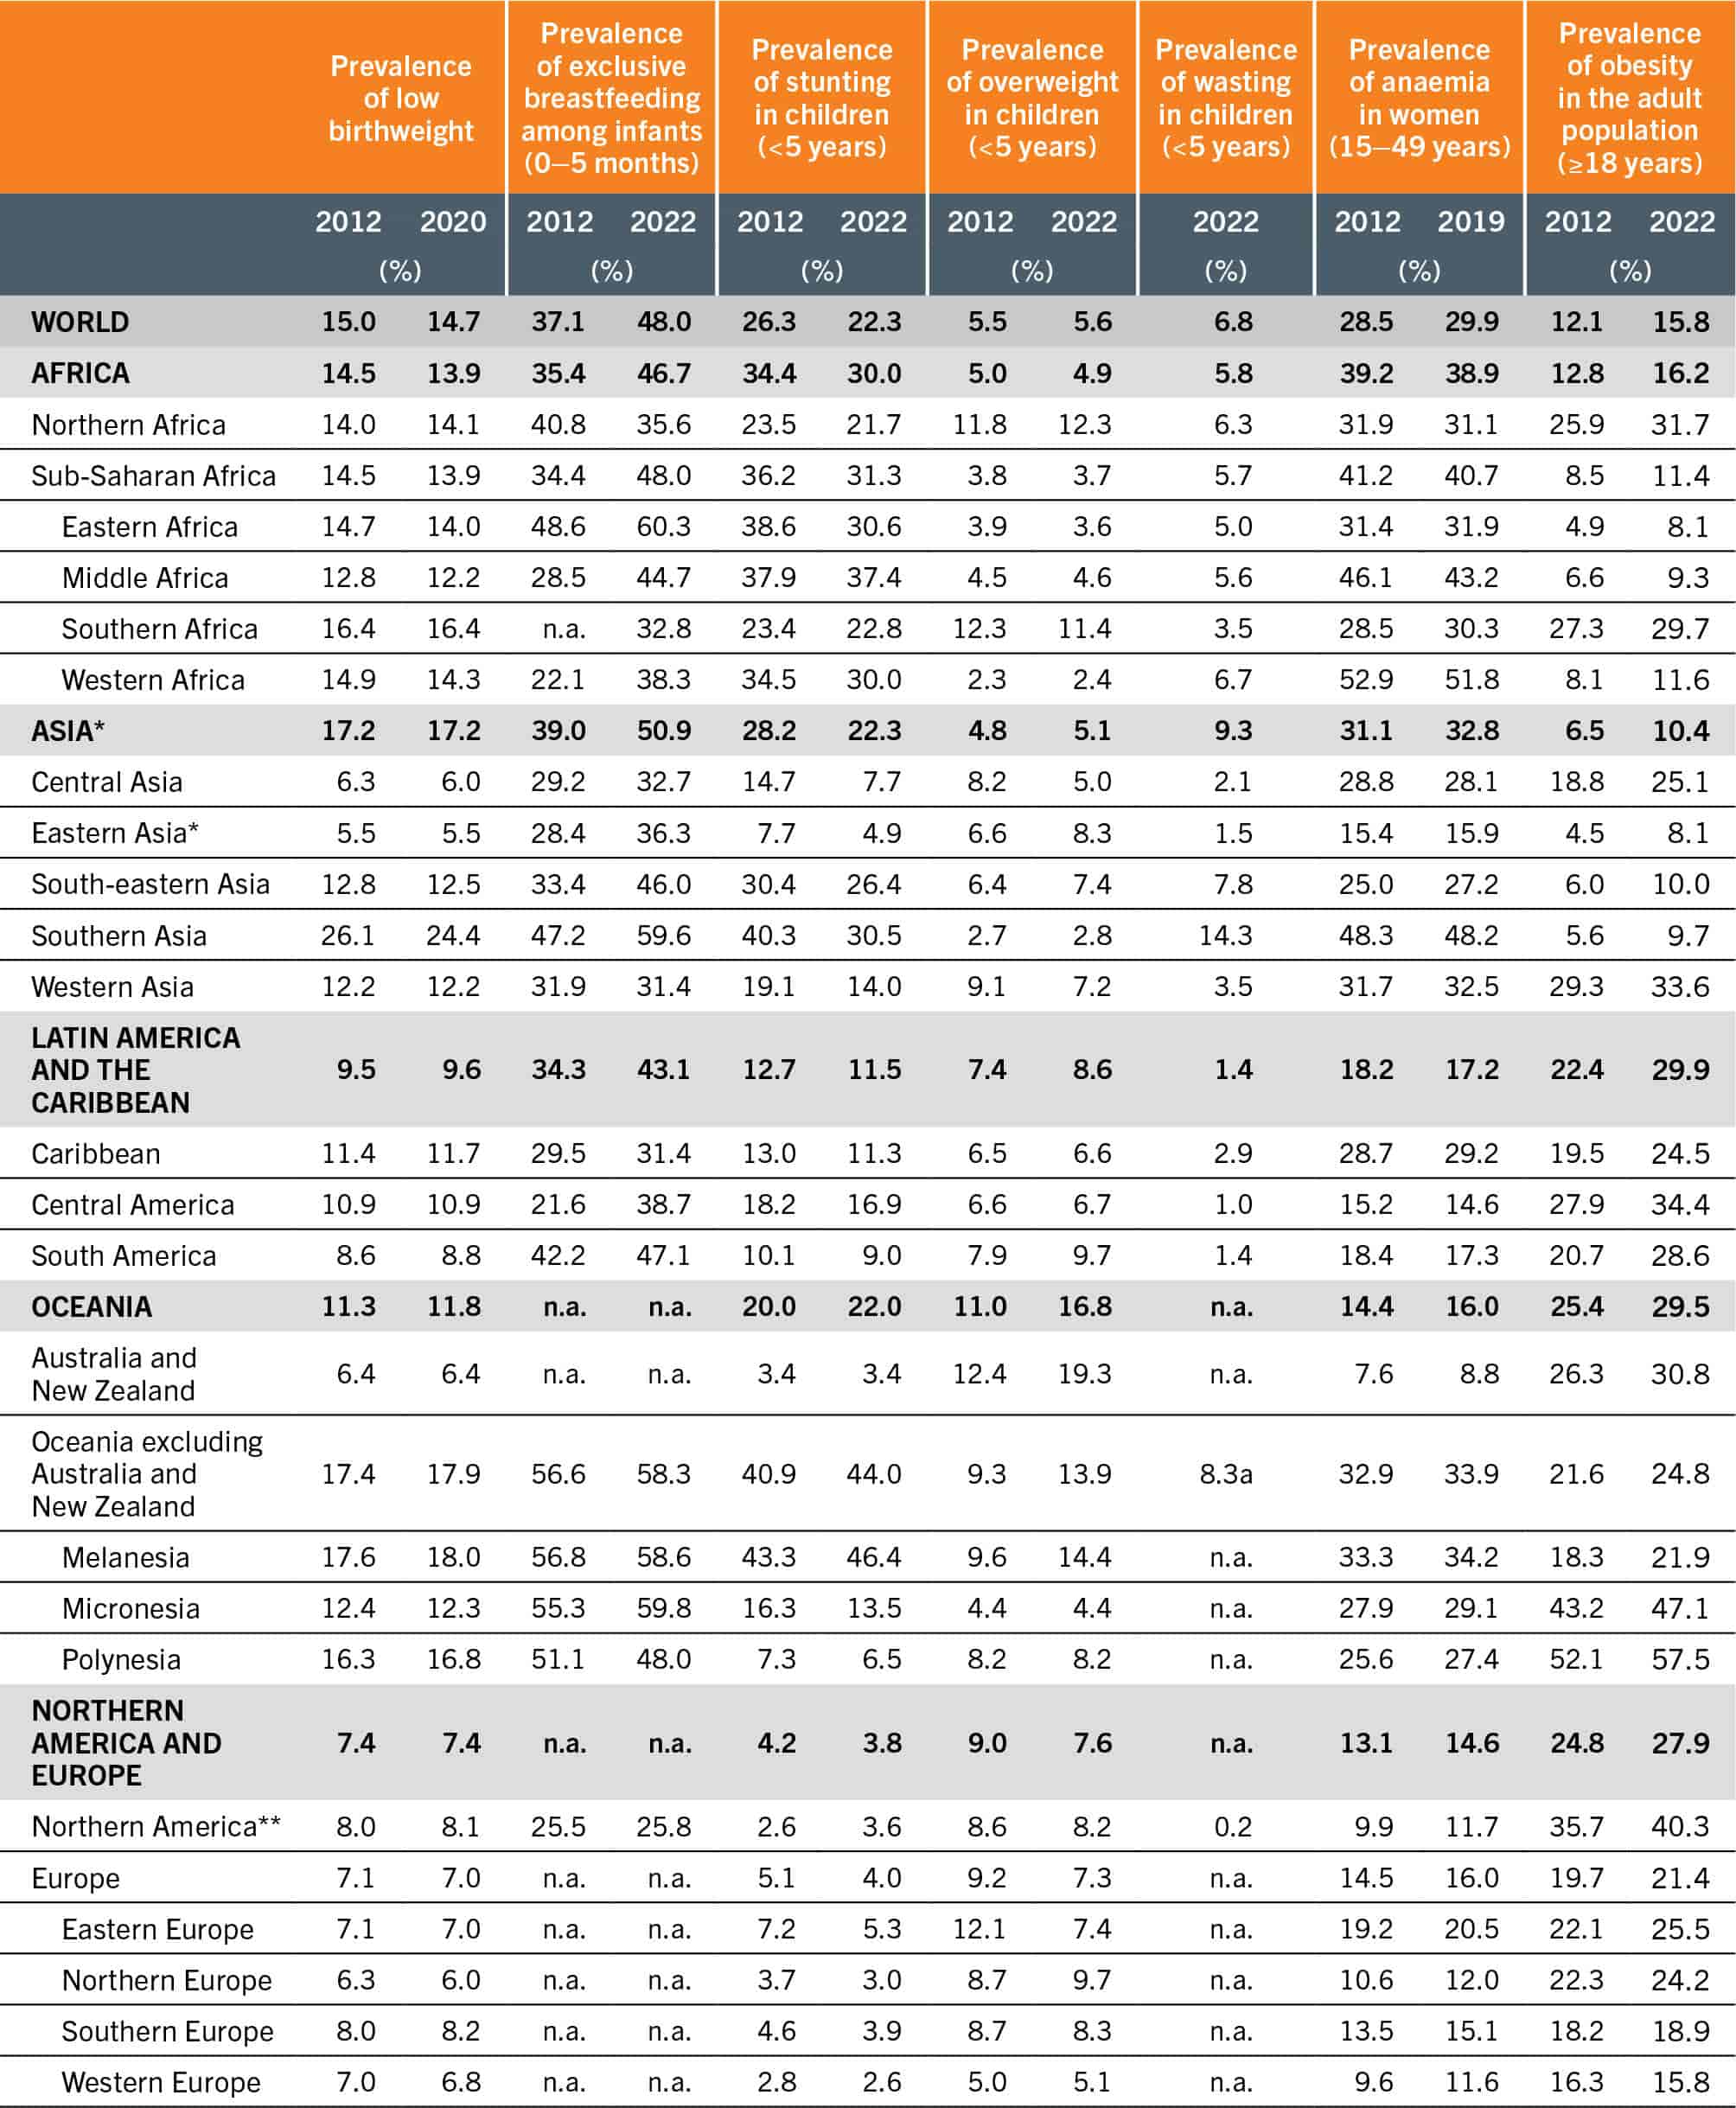
TABLE 7Regional trends for the seven global nutrition targets
SOURCES: See sources of Figure 10.
Virtually no progress has been made for low birthweight among newborns, with a prevalence of 15 percent (21.6 million) in 2012 and 14.7 percent (19.8 million) in 2020 – the latest year with available data. Based on the trends from 2012 to 2020, it is projected that 14.2 percent of newborns will have low birthweight in 2030, falling short of the global target of a reduction of 30 percent relative to the baseline, i.e. 10.5 percent by 2030. Oceania excluding Australia and New Zealand had the highest prevalence in low birthweight among the world regions in 2012 (17.4 percent) and remains the highest with a prevalence of 17.9 percent according to latest estimates.
Significant progress has been made in increasing the global exclusive breastfeeding rate among infants under six months of age. Based on the latest estimates, the global prevalence steadily rose from 37.1 percent (25.7 million) in 2012 to 48 percent (31.3 million) in 2022. However, the world is not on track to achieve the 2030 target of 70 percent exclusive breastfeeding rate, as current projections point to a prevalence of 59 percent in 2030. Northern America has the lowest exclusive breastfeeding rate among the world regions (25.8 percent in 2022). Progress in this region has been stagnant over the past decade while other regions have experienced a rising trend for this indicator.
The global prevalence of stunting in children under five years of age has declined steadily from 26.3 percent (177.9 million) in 2012 to 22.3 percent (148.1 million) in 2022 – the latest year with available data. Assuming the trend observed since the baseline persists, it is projected that in 2030, 19.5 percent of all children under five will be stunted. The world is currently not on track to achieve the 2030 target of halving the number of stunted children under five by 2030 (13.5 percent stunted). The slower decline also means that the number of children, adolescents and adults suffering the lifelong consequences of early childhood stunting will remain high. Oceania excluding Australia and New Zealand has the highest stunting levels among children under five (44 percent in 2022). Prevalence has increased in this region since 2012, while most other regions have shown an improvement in this indicator over the past decade.
The global prevalence of wasting in children under five years of age has remained relatively unchanged over the past decade. In 2012, 7.5 percent of all children under five (50.7 million) were wasted. This prevalence declined to 6.8 percent (45 million) in 2022. The world remains off track to attain the 3 percent prevalence global target for 2030 based on progress exhibited since the baseline, with 6.2 percent of children under five projected to be wasted in 2030, i.e. more than double the global target. In addition, the prevalence of wasting can spike at national level during acute food insecurity contexts such as lean seasons and emergencies, or during times of increased incidence of illness (e.g. diarrhoea, measles outbreaks). Asia has the highest wasting levels among children under five, and efforts must be continued in this region to reduce this life-threatening condition.
The global prevalence of overweight among children under five years of age has stagnated, with little change from 5.5 percent (37 million) in 2012 to 5.6 percent (37 million) in 2022 – the latest year with available data. By 2030, 5.7 percent of children under five are projected to be overweight, which is almost double the 2030 global target of 3 percent prevalence. These children have increased risks for obesity and NCDs in adulthood.51 Children under five living in Australia and New Zealand have the highest prevalence levels of childhood overweight among all world regions – 19.3 percent in 2022.
Globally, the prevalence of anaemia in women aged 15 to 49 years increased from 28.5 percent (520 million) in 2012 to 29.9 percent (571 million) in 2019. Based on the trend from 2012 to 2019 – the latest year with available data – the prevalence is projected to be 32.3 percent by 2030. At this pace, the world will not achieve the 2030 target of a 50 percent reduction in the prevalence of anaemia (to reach 14.3 percent target prevalence). Anaemia is a complex health condition with many nutritional determinants, as well as non-nutritional determinants such as infections. Actions to reduce anaemia must directly address these multiple causes, which will vary by context. Growing evidence demonstrates the important association between iron deficiency, anaemia and obesity, which is of particular concern given the continual increase in both anaemia and obesity. Evidence suggests that this biological association may necessitate new approaches to prevention and treatment.52, 53 Anaemia plagues a larger proportion of women aged 15 to 49 years in Africa than in any other world region, with 38.9 percent prevalence in 2019 and virtually no progress made in this region over the past decade. More comprehensive efforts are needed to accelerate the reduction of anaemia in women of reproductive age worldwide.
New data on the prevalence of adult obesity (age 18+ years) shows that it has steadily increased over the last decade, from 12.1 percent (591 million) in 2012 to 15.8 percent (881 million) in 2022. The world is off track to achieve the 2030 global target to halt the rise, with more than 1.2 billion obese adults projected for 2030 (19.8 percent global prevalence). Latin America and the Caribbean is the region with the highest prevalence, with nearly 30 percent of the adult population affected by obesity in 2022, followed closely by Oceania (29.5 percent), and Northern America and Europe (27.9 percent).
Country progress
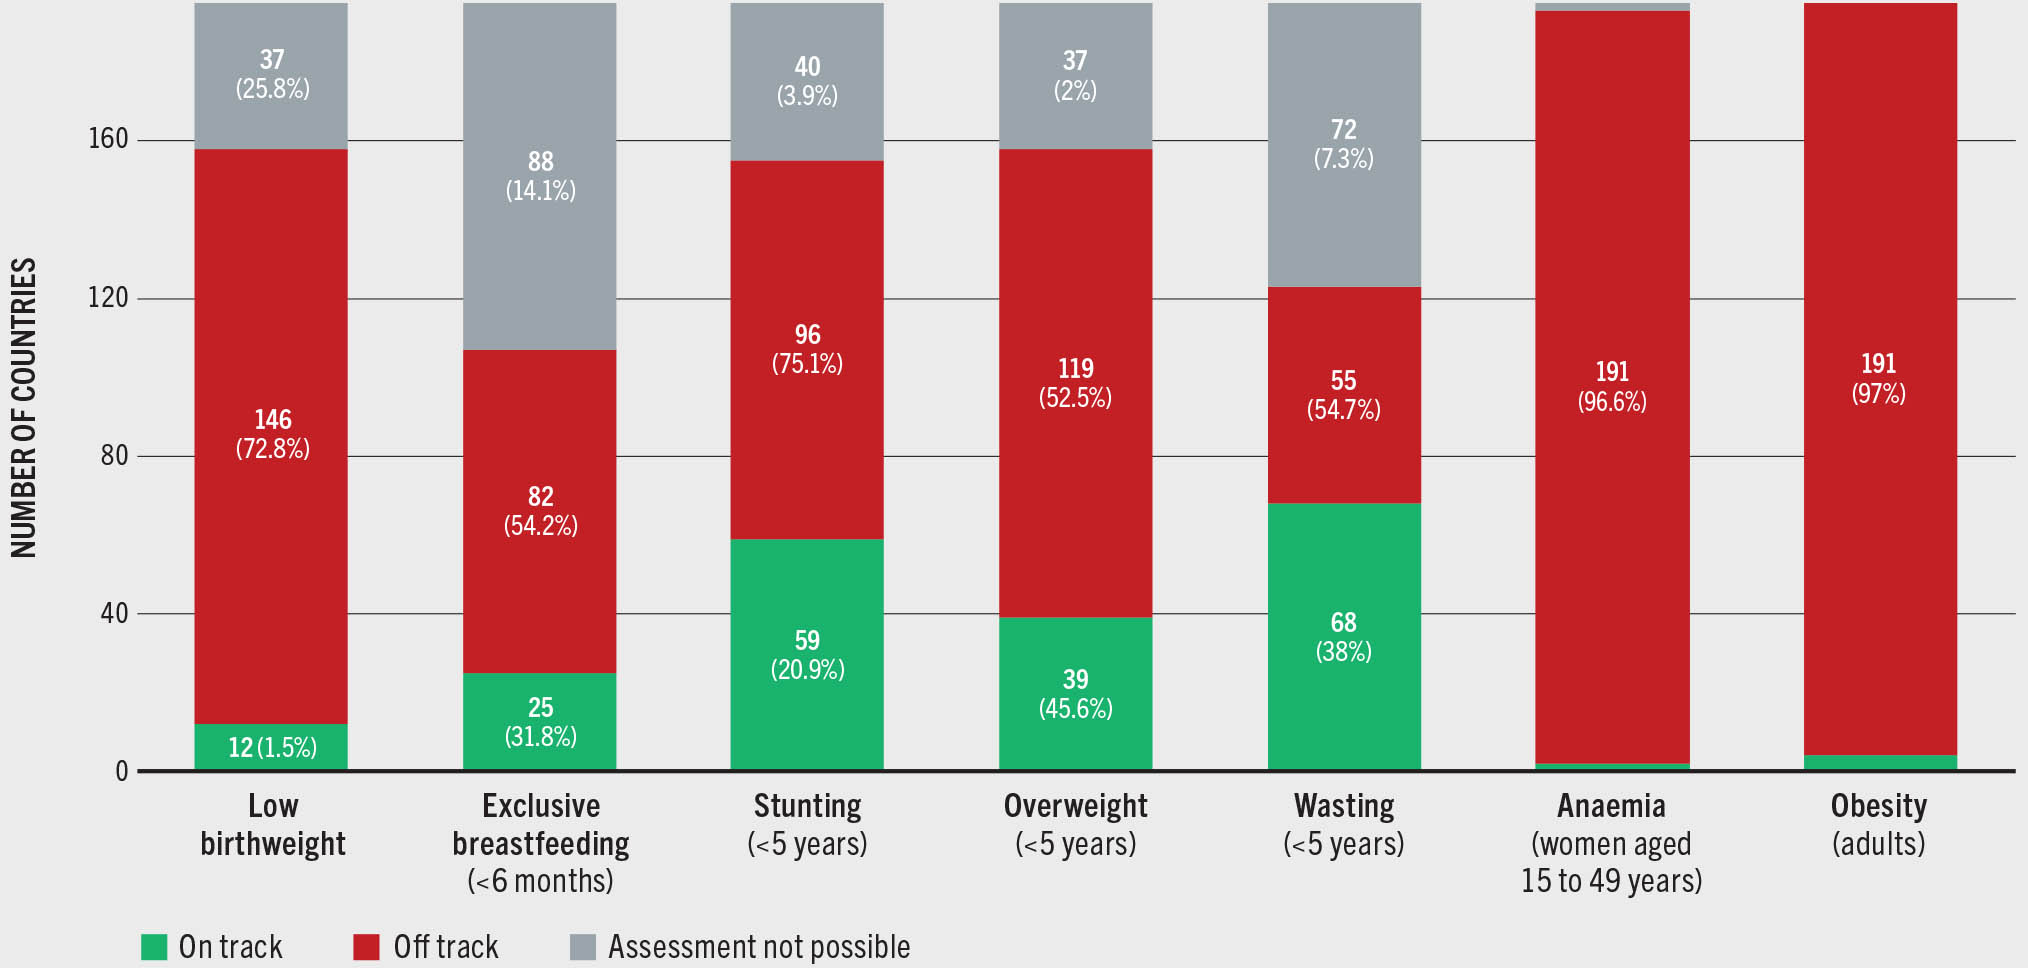
More countries are off track than on track for most of the seven global nutrition targets (Figure 11). Three-quarters of all countries worldwide (146 out of 195) are off track to achieve the 2030 global target for low birthweight. This does not account for 37 countries with insufficient data for progress assessment, which could potentially also be off track. Moreover, 72.8 percent of newborns in the world live in countries that are off track. More than 40 percent of countries (82 out of 195) are off track to reach the 2030 global exclusive breastfeeding target, and 88 countries have no progress assessments due to insufficient data. More than half of infants under six months of age (54.2 percent) are living in those countries which are off track. Half of the countries in the world (96 out of 195) are off track to achieve the 2030 global stunting target, with three in four children under age five (75.1 percent) living in those countries. There are insufficient data to inform progress towards the stunting target for 40 countries. More than one-quarter of countries worldwide (55 out of 195) are off track to achieve the global target for childhood wasting, and over half of children under age five (54.7 percent) live in those countries. Seventy-two (72) countries do not have sufficient data for tracking progress towards the wasting target, representing only 7.3 percent of the global population. About 60 percent of countries (119 out of 195) are off track to achieve the 2030 global target for childhood overweight and for 37 countries, progress cannot be assessed due to insufficient data. The countries that are off track for the overweight indicator represent half of total children under age five (52.5 percent). Almost all countries in the world (191 out of 195) are off track to attain the 2030 global anaemia target. More analyses are needed to better understand the context-specific causes of anaemia in countries so that targeted interventions can be implemented to get countries on track for the anaemia indicator. Similarly, nearly all countries (191 out of 195) are off track to achieve the global adult obesity target, and urgent efforts are needed to stop this ticking time bomb.
FIGURE 11 More countries are off track than on track for most of the seven global nutrition targets
SOURCES: See sources of Figure 10.
There has been significant progress in filling data gaps over the past decade, with more frequent data collection, use of advanced analytic techniques, and improvements in data flow. However, much work remains to fill the void, with about 20 percent of countries still lacking enough data to assess progress on five of the seven indicators. Exclusive breastfeeding and wasting are based on primary data collected predominantly from nationally representative surveys. The modality and frequency of these surveys may differ across countries and contexts, rendering data availability inconsistent and sometimes insufficient for progress assessment. Making better use of existing data to estimate trends using models is urgently needed to fill the gaps for these two indicators, in addition to continued efforts to collect good quality data.
Progress in least developed countries
The United Nations defines least developed countries (LDCs)54 as “countries that have low levels of income and face severe structural impediments to sustainable development.”55 This classification was established by the UNGA as an acknowledgement that the least developed among developing countries need special support measures, including financial and technical, to boost their socioeconomic development. This analysis, including 2030 projections, is based on the group of 45 LDCs as classified by the United Nations as at January 2024. Figure 12 suggests that the LDC group is faring better than the global average on two of the seven nutrition indicators. Specifically, the prevalence of exclusive breastfeeding among children under six months of age in LDCs has been better than the global average since the baseline year 2012, and is projected to rise to 61.7 percent by 2030, while the global average is projected to remain at 59.0 percent. The prevalence of wasting in children under age five has declined more rapidly in LDCs relative to the global aggregate, despite the LDCs starting from a higher prevalence rate at the baseline (8.4 percent in LDCs versus 7.5 percent globally in 2012). By 2030, LDCs are projected to do slightly better than the global average (6.0 percent in LDCs versus 6.2 percent globally). Nevertheless, the wasting prevalence is still too high, and urgent investments in life-saving interventions to prevent and treat acute malnutrition must continue.
FIGURE 12 Compared to the global estimates, least developed countries have much higher levels of stunting in children under age five and of anaemia in women aged 15 to 49 years, and the same worrying rise in adult obesity
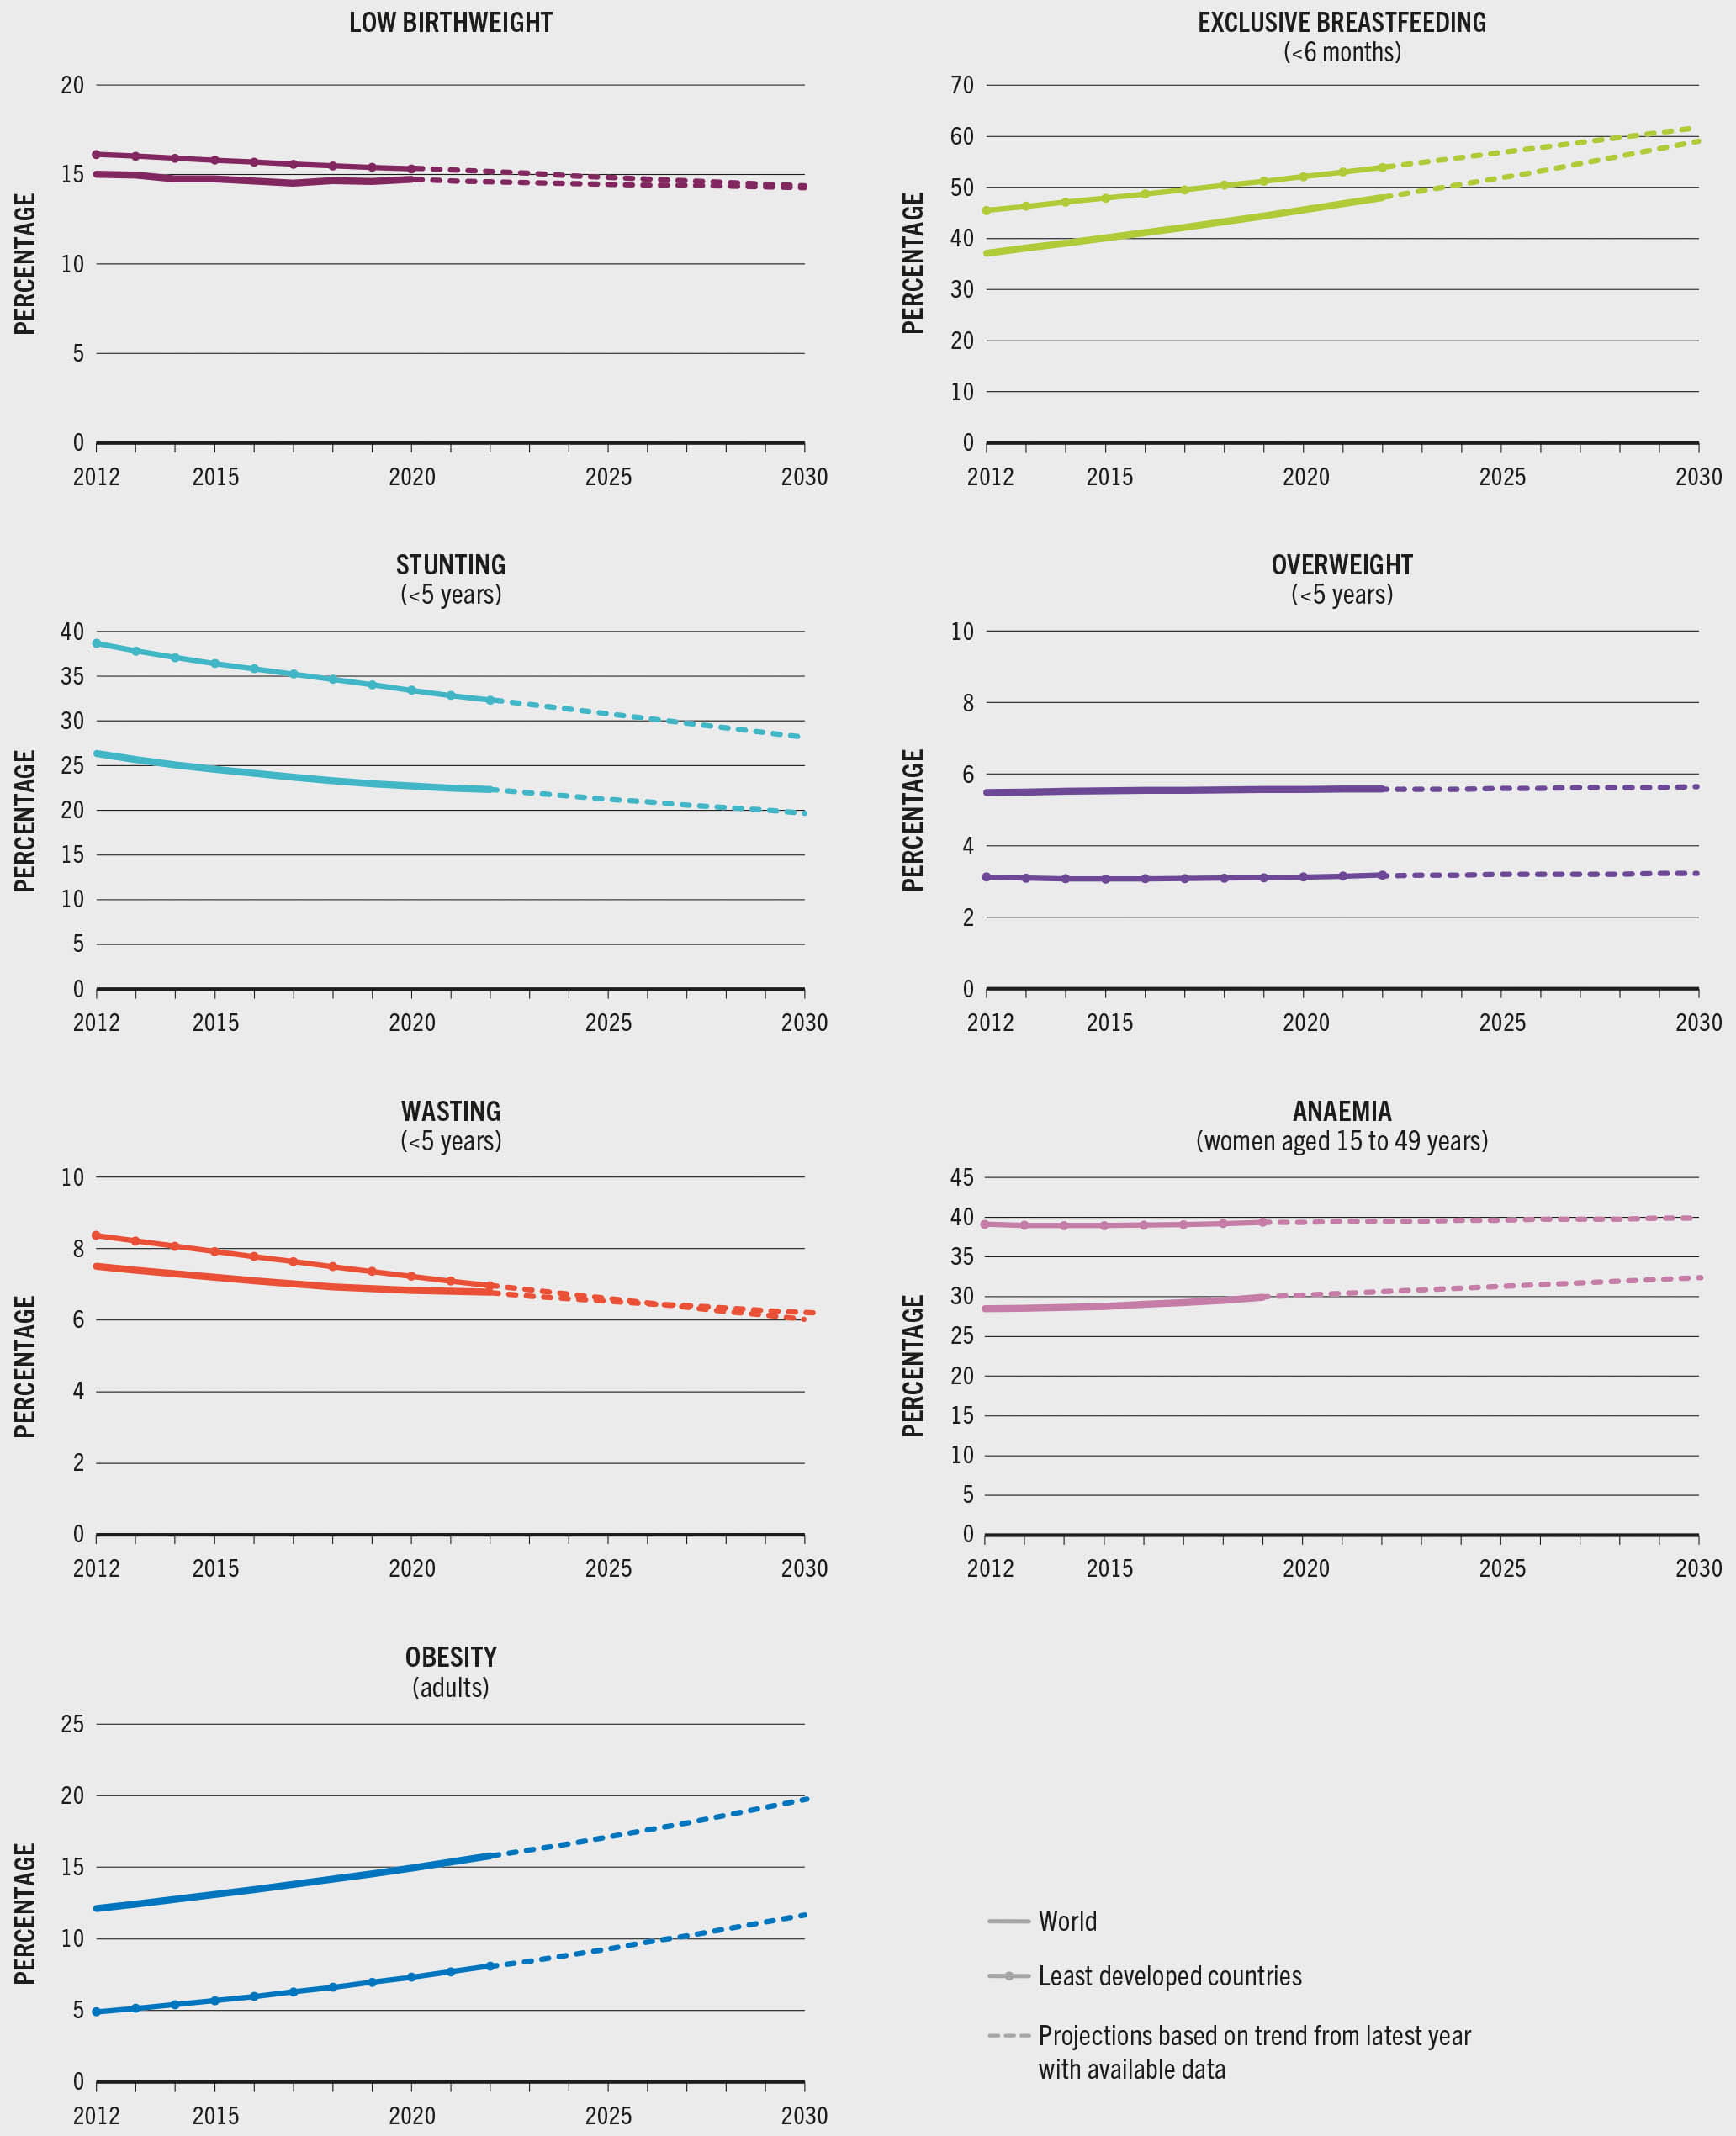
Undernutrition remains a dire challenge in LDCs – stunting in children under age five and anaemia in women aged 15 to 49 years are significantly higher in this group of countries compared to the global average. By 2030, LDCs are projected to have 28.1 percent stunting prevalence, compared with 19.5 percent globally, despite a declining trend since the baseline in this group of countries. In contrast, the global trend in anaemia has been increasing since the baseline. In 2019 – the latest year with available data – the anaemia prevalence among LDCs (39.4 percent) was even higher than at global level (29.9 percent). The low birthweight prevalence in LDCs is on a par with the global average – at the baseline year 2012, the LDC prevalence of low birthweight newborns was 16.1 percent, versus 15.0 percent globally. In 2020, the latest year with available data, LDCs had a 15.3 percent prevalence, while the global average was a close 14.7 percent. By 2030, the 45 countries and the global aggregate are projected to have comparable prevalence levels of low birthweight, with 14.3 percent and 14.2 percent, respectively. Although the prevalence of childhood overweight in LDCs remains below the global average, progress to further reduce child overweight has been stagnant for this group of countries, similar to the stagnation seen globally. Moreover, there is a worrying rise in adult obesity in LDCs that mirrors the global trend, and their share of the global adult obesity burden is also increasing over time – with all the while undernutrition continuing to weigh heavily on this group. Supporting LDCs to overcome structural impediments to sustainable development, improve incomes, and achieve the seven nutrition targets is a global development priority.
The double burden of malnutrition
The double burden of malnutrition56 – defined as the co-existence of undernutrition together with overweight and obesity – has surged in recent decades among all age and income groups. Research has shown that countries undergo three kinds of population-level transitions as they develop and progress economically. The “nutrition transition” refers to a shift in a population’s dietary patterns away from a staple-based diet towards greater dietary diversity including increased consumption of dairy, fish, meat, fruits and vegetables, as well as highly processed foods high in fats, sugars and salt. This is often associated with globalization, rapid urbanization, and sedentary lifestyles, contributing to the “epidemiological transition” – a shift in malnutrition burden in the population from a predominance of undernutrition to overweight and obesity, and in disease burden from infectious diseases to NCDs. The prevalence of micronutrient deficiencies continues to prevail across all global regions, despite evidence of the nutrition transition, and is often omitted from estimates of the double burden.43, 57 Micronutrient deficiencies may continue to prevail across the transition. Furthermore, the population structure is modified largely due to lower birth rates and increased life expectancy. This “demographic transition” is characterized by a shift in average population age from younger to older and is accompanied by concomitantly higher NCD risks.58 While in the past these transitions occurred gradually over centuries, they have accelerated in recent decades, with dietary changes and nutritional heterogeneity as well as disease risk rising significantly in just a single generation. Policymakers thus face unprecedented challenges in addressing both overweight and undernutrition and their associated health and economic implications.
The NCD Risk Factor Collaboration (NCD-RisC)59 recently conducted a study on the double burden of malnutrition from 1990 to 2022 among adults, school-age children, and adolescents in 200 countries and territories. In this analysis, the double burden was calculated as the sum of the prevalence of underweight or thinness and obesity. The true rate of double burden is much higher if all forms of malnutrition are considered, including micronutrient deficiencies.57 Results reveal that in most regions, decreases in the double burden were due to declining underweight and thinness, while increases in the double burden were driven by increases in overweight and obesity. A transition occurred in most countries from a predominance of underweight and thinness towards a predominance in overweight and obesity, with some exceptions such as in Southern Asia, where a decline in underweight was not offset by an increase in obesity. While population levels of obesity were highest among adults in 1990, school-age children and adolescents are increasingly affected by obesity in the twenty-first century.60
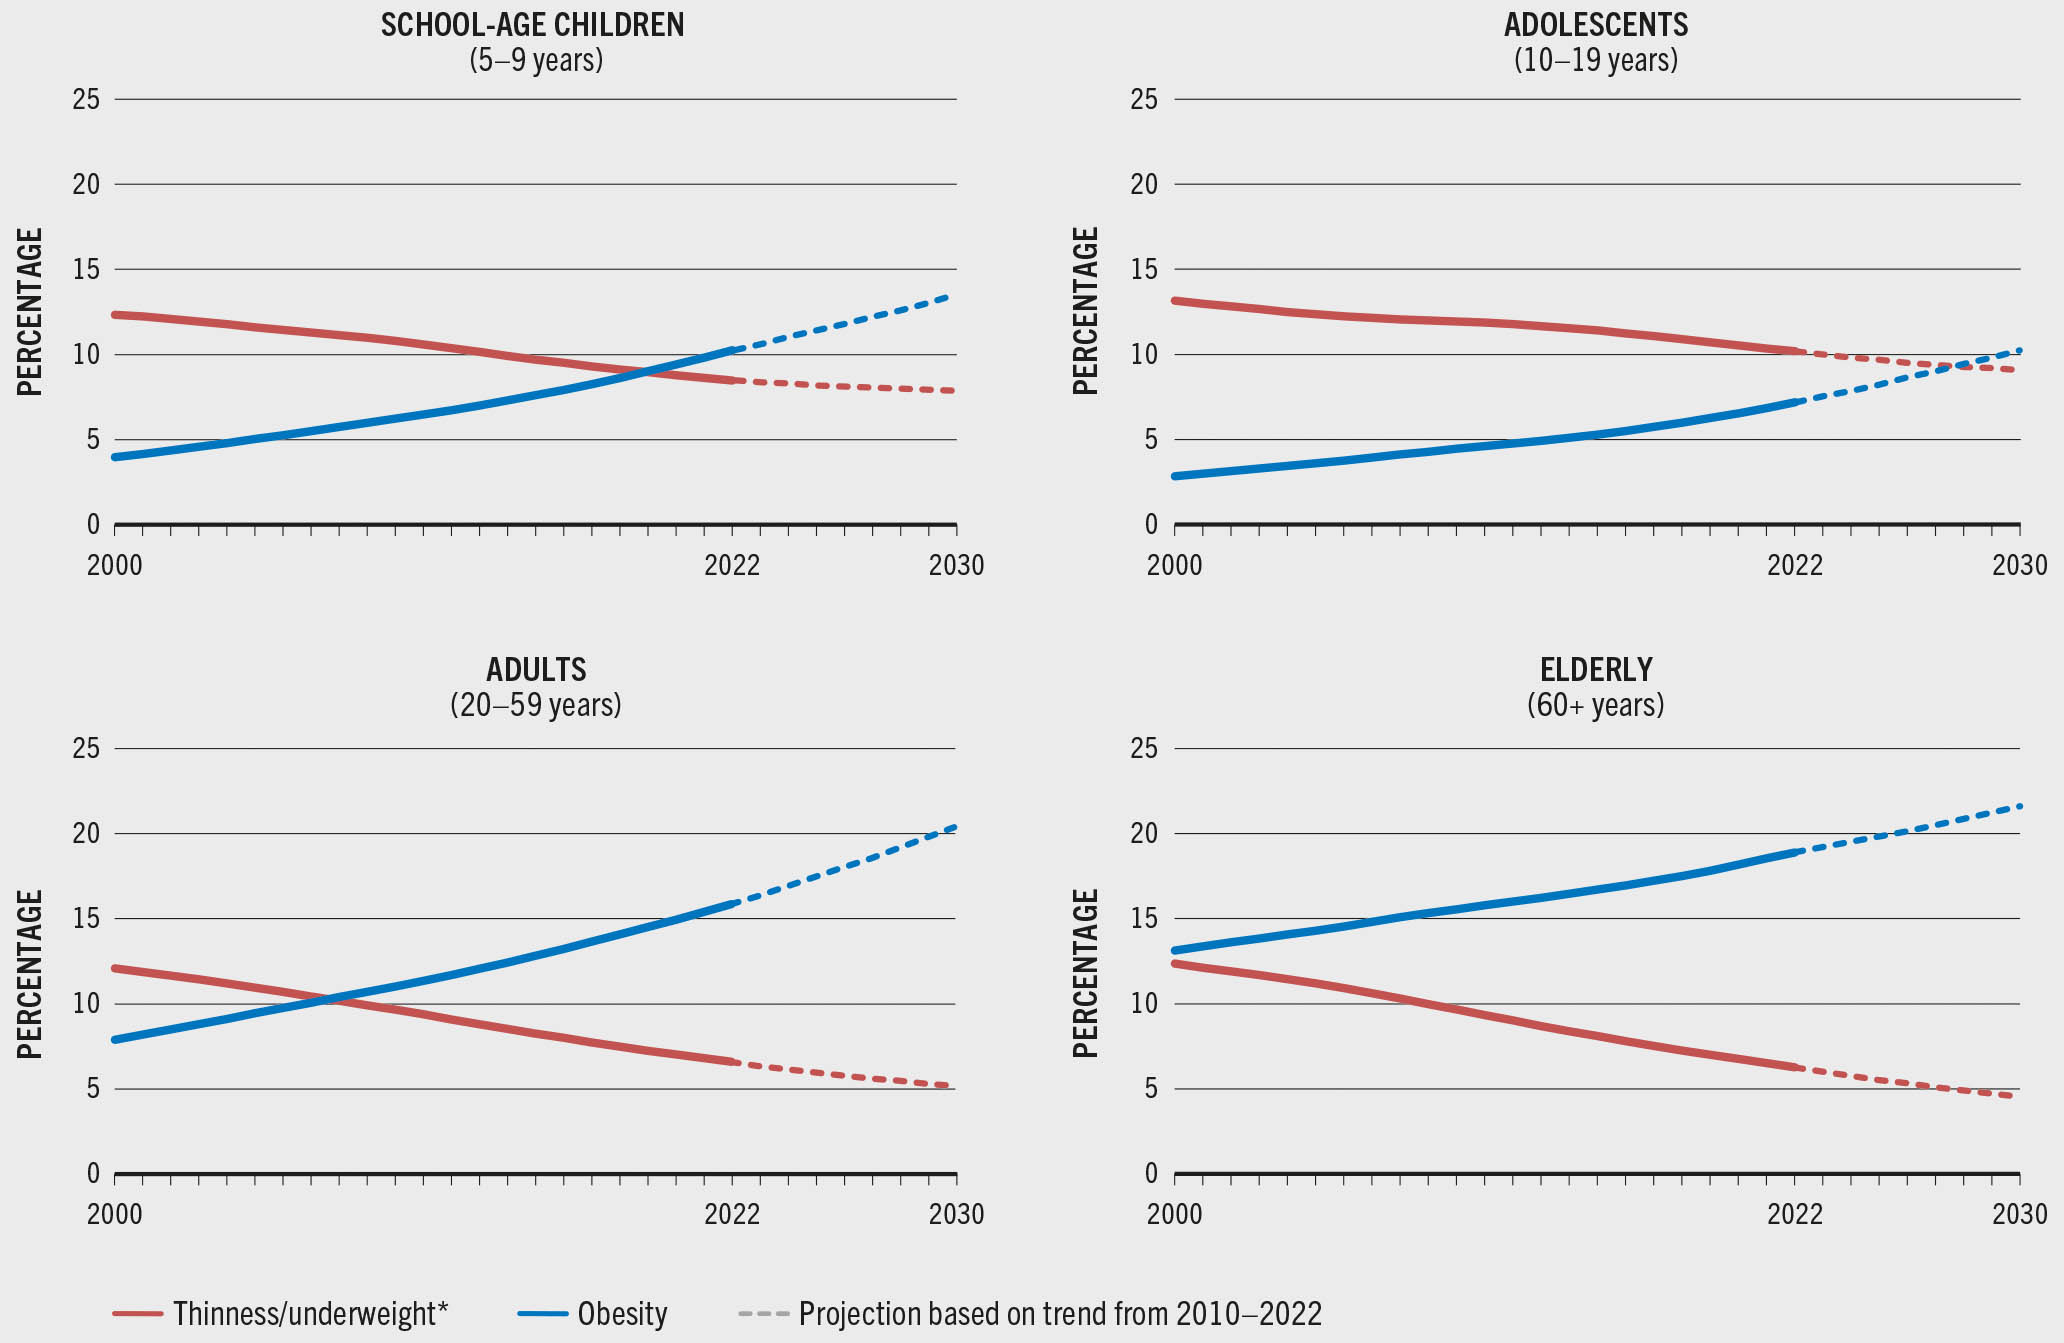
Figure 13 illustrates the global double burden phenomenon among school-age children (5–9 years), adolescents (10–19 years), adults (20–59 years) and the elderly (60+ years) from 2000 to the latest available data (2022) and projected to 2030. Thinness in school-age children and adolescents is measured as having a body mass index (BMI) <–2SD below the median of the WHO 2007 growth reference for school-age children and adolescents61 while obesity in the same age groups is measured as BMI >2SD above the median. Among adults and the elderly, underweight is defined as BMI <18.5 kg/m2 and obesity as BMI ≥30 kg/m2. By 2030, 1 in 6 people in the world will be aged 60 years or over, and this population group will increase from 1.1 billion in 2020 to 1.4 billion in 2030.62 Every country in the world is experiencing growth in the proportion of older persons (60+ years).63 More prominence needs to be given to them on the global nutrition agenda in the SDG targets. Routine data collection for adults over age 60 should be strengthened to support policies aligned with the commitments made in the United Nations Decade of Healthy Ageing (2021–2030).64, 65
FIGURE 13 Globally, obesity rates have risen sharply and thinness and underweight have declined among school-age children, adolescents, adults and the elderly
SOURCE: WHO. 2024. The Global Health Observatory. [Accessed on 24 July 2024]. https://www.who.int/data/gho. Licence: CC-BY-4.0.
Globally and across all age groups, thinness and underweight have declined in the last two decades, while obesity has risen sharply. The global prevalence of thinness among school-age children (5–9 years) declined from 12.3 percent in 2000 to 8.5 percent in 2022 and is projected to decrease to 7.2 percent by 2030. Meanwhile, obesity in this age group has more than doubled since 2000, increasing from 4 percent in 2000 to 10.2 percent in 2022 and is projected to increase 3.6-fold to 14.4 percent in 2030 relative to levels in 2000. While the decline in thinness prevalence among adolescents (10–19 years) was gradual from 2000 to 2022 (13.2 percent and 10.2 percent, respectively), obesity increased 2.5-fold during the same period (2.8 percent and 7.2 percent, respectively), and is projected to more than triple to 10.0 percent by 2030 relative to levels in 2000.
The global prevalence of underweight among adults (20–59 years) was cut by half in two decades, from 12.1 percent in 2000 to 6.6 percent in 2022. In turn, obesity doubled during the same period from 7.9 percent to 15.9 percent and is projected to increase 2.6-fold to 20.3 percent relative to levels in 2000 by 2030. The global prevalence of underweight among the elderly (60+ years) declined by half from 2000 to 2022 (12.4 percent and 6.3 percent, respectively). Obesity prevalence, on the other hand, increased during the same period, from 13.1 percent to 18.9 percent, and is projected to reach 21.6 percent by 2030 – 1.6-fold the level in 2000. Policies that continue to address the longstanding challenge of undernutrition need to be complemented with urgent policies to curb and reverse the growing obesity trend among all population groups.
The double burden of malnutrition is a catalyst for double-duty actions.66–68 These actions simultaneously tackle undernutrition, overweight and obesity by leveraging the common drivers shared by all forms of malnutrition including those that are biological, environmental and socioeconomic, thereby creating a pathway for shared policies, programmes and interventions. Box 5 illustrates a few examples of double-duty actions.
BOX 5Double-duty actions to address the double burden of malnutrition
Double-duty actions for infants and young children (<5 years of age)
- Scale up interventions to protect, promote and support breastfeeding (early initiation, exclusive, continued).
- Promote optimal complementary feeding,69 prioritizing nutrient-dense animal source foods, fruits and vegetables, and nuts, pulses and seeds over starchy foods, and avoiding foods high in sugars, salt and trans fats, sugar-sweetened beverages, and non-sugar sweeteners.
- Consider the risks of excessive energy density in complementary foods, avoiding feeding young children foods, snacks and beverages high in energy, sugars, fats and salt.
- Include new training curricula for primary health care workers to provide double-duty nutrition counselling.
- Flag overweight and obesity risks alongside stunting and wasting in growth monitoring programmes, especially in contexts where childhood overweight is a problem.
- Ensure adequate prevention and management of moderate and severe wasting – including with ready-to-use therapeutic foods, food supplements and improved fortified blended foods – depending on the condition and the context.70
- Ensure that clear criteria and targeting guidelines are used for the distribution of ready-to-use supplementary foods (therapeutic foods, improved fortified blended foods), including for the prevention and treatment of moderate and severe acute malnutrition, and manage the duration of treatment to avoid excessive or rapid weight gain beyond that needed for prevention or recovery.
Double-duty actions for school-age children (5–9 years) and adolescents (10–19 years)
- Redesign school-feeding programmes to promote access to healthy diets and devise new nutritional guidelines for food inside the school and surrounding the school campus where children have access to food. Support these efforts through policy, legal and institutional frameworks. Eliminate or, at a minimum, regulate the commercial promotion and sale of foods, snacks and beverages high in energy, sugars, fats and salt around schools.
- Create a supportive “whole-of-school” approach conducive to healthy eating such as integrating nutrition into the classroom curriculum/health literacy lessons; promoting active school environments; cultivating school gardens; building knowledge and skills to create awareness, shape tastes, and develop healthy food habits; involving parents in meal planning; and influencing healthy eating attitudes at home.
- Use innovative youth-oriented social behaviour change communication tools and platforms to reach children and adolescents with key messages about nutritious foods and healthy diets.
- In settings where the prevalence of anaemia in non-pregnant women is 20 percent or higher, provide intermittent iron and folic acid (IFA) supplementation for menstruating, non-pregnant adolescent girls. If the prevalence is 40 percent or higher, provide daily iron supplementation.71
Double-duty actions for pregnant women
- Scale up WHO antenatal care recommendations for pregnant women (also extending to pregnant adolescent girls) through the health system, focusing on counselling about healthy eating and keeping physically active during pregnancy to stay healthy and prevent excessive weight gain.
- Monitor targeted protein and energy supplements to prevent unintended excess weight gain during pregnancy.
- Provide cash and/or food vouchers to improve maternal diets while monitoring gestational weight gain to detect inadequate weight gain as well as excess weight gain.
- Provide daily IFA supplementation for pregnant women during routine antenatal care. In settings where the prevalence of anaemia in pregnant women is less than 20 percent, or daily iron is not acceptable due to side effects, provide intermittent IFA supplementation. In settings with a high prevalence of nutritional deficiencies, multiple micronutrient supplements that contain IFA may be considered.71
- In undernourished populations, use behaviour change communication (e.g. public talks, mass communication campaigns, one-to-one or small group counselling, visual communication aids) on increasing total daily intake, including proteins, to reduce risk of low birthweight; and balanced energy and protein dietary supplementation to reduce risk of stillbirths and neonates who are small for gestational age.
Double-duty actions for all groups
- Increase nutrition-sensitivity of social protection programmes for all age groups or targeted ones (e.g. for pregnant and breastfeeding women and young children, or the elderly) through modalities of adequate size and potential for improving nutrition – e.g. subsidies or food vouchers linked to retailers serving nutritious foods, while excluding foods, snacks and beverages high in energy, sugars, fats and salt; introducing rewards for transfers or vouchers spent on nutritious foods; implementing behaviour change communication strategies focused on healthy diets, physical activity, and the preventive use of health services (early detection of overweight, obesity and non-communicable diseases).
- Scale up nutrition-sensitive agriculture programmes which promote diversified food production and consumption, particularly among poor households living in remote areas with little access to markets. Design and support urban and peri-urban agriculture to support the growing demand for nutritious foods in urban areas.
- Align actions throughout agrifood systems to ensure that diverse, nutritious foods are available to all people, including vulnerable populations, through the value chain – from farm to table.
- Transform food environments by implementing policies and legislation that eliminate the use of misleading promotion of breastmilk substitutes (infant formula, follow-on formula); strengthen restrictions on marketing of foods, snacks and beverages high in energy, sugars, fats and salt, including those which are fortified; adopt front-of-pack nutrition labelling; introduce targeted taxes on foods, snacks and beverages high in energy, sugars, fats and salt, and subsidies for nutritious foods to encourage healthier purchasing patterns.
- Food producers, retailers and traders can be incentivized to improve the nutritional quality of the food supply by reformulating unhealthy foods high in fats, sugars and salt and by fortifying staple foods (i.e. universal salt iodization, fortification of maize flour, cornmeal, rice, wheat flour, vegetable oil with vitamins and minerals).


