


- ➔ Financing for food security and nutrition through domestic public spending, official development assistance (ODA) and other official flows (OOF) is trackable, which is not the case for most private flows.
- ➔ Public spending on agriculture per capita is very low and not steadily growing in low-income countries (LICs) and lower-middle-income countries (LMICs), where food insecurity and undernutrition are more serious; public spending on agriculture is only a fraction of public spending on food security and nutrition.
- ➔ Public spending on food security and nutrition, particularly on food consumption, was growing before the COVID-19 pandemic in two LICs and eight middle-income countries (MICs). In LICs, governments do not have high spending capacity to address the major drivers and underlying structural factors of food insecurity and malnutrition.
- ➔ Food security and nutrition take less than a quarter of ODA and OOF flows and seem to have been less of a priority for donors. Between 2017 and 2021, these flows amounted to USD 76 billion per year, of which only 34 percent (USD 26 billion) helped address the major drivers and underlying structural factors of food insecurity and malnutrition. In the same period, these flows overwhelmingly grew more for Africa (across regions) and for LMICs rather than for LICs (across income groups).
- ➔ Private sector financing is more difficult to track. Philanthropic flows (USD 4 billion on average over 2017–2021) look small compared to cross-border remittances from migrants invested in agrifood systems (USD 29 billion on average over 2017–2022) and foreign direct investment (USD 62 billion on average over 2017–2022). Blended finance represents more modest amounts, and net banking loans to agriculture, forestry and fishing show an almost continuous decline.
- ➔ Policies, legislation and interventions needed to meet SDG Targets 2.1 and 2.2 could require financing amounting to several trillion USD.
- ➔ Not bridging the financing gap by 2030 means millions of people will still be undernourished, millions will have been pushed into crisis or worse levels of acute food insecurity, and insufficient progress will have been made to meet all global nutrition targets. Addressing the social, economic and environmental repercussions of this failure will cost several trillion USD.
- ➔ Executing fully and more effectively national budgets and repurposing existing public support to enable more resilient, sustainable and equitable agrifood systems will help reduce the financing gap.
Financing for food security and nutrition at the country level is provided by the public and the private sectors and is sourced domestically or from abroad (see Table 8). Public finance is the domestic source over which policymakers have most control for targeting food security and nutrition objectives, and it is mostly used through government spending, which is a numerically tractable flow. External public finance materializes through flows, some of which, notably official development assistance (ODA) and other official flows (OOF), can also be mapped to food security and nutrition purposes. A portion of these external flows may be channelled through national budgets, in which case they would become government spending. In practice, then, some financing that is relevant to food security and nutrition may appear both in government spending and in ODA flows that are channelled through national budgets. In regions where ODA is of paramount importance, such as sub-Saharan Africa, the execution of on-budget donor funds for agriculture tends to be complex and low, and about 40 percent of these allocations are left unspent.1 Some ODA may be legally channelled through financial transactions out of national budgets, to implement projects and programmes much faster.
Available data mostly allow the tracking only of public spending flows, ODA (on-budget and off-budget) and OOF (on-budget and off-budget). The core and extended definitions of financing for food security and nutrition can be applied to these data (definitions are introduced in Chapter 3 and explained in detail in the Supplementary material to Chapter 3 S3.2); how the definitions are applied to data for such financing flows is explained in detail in the Supplementary material to Chapter 4. The financing flows are mapped to interventions that help to: i) improve food consumption (i.e. food availability, access, utilization and stability) and health status (i.e. practices, and health services and environmental health) (core definition); and ii) transit through the pathways for addressing the major drivers and underlying structural factors behind recent increases in hunger, food insecurity and malnutritionl (i.e. conflict, climate variability and extremes, economic slowdowns and downturns, lack of access to and unaffordability of nutritious foods, unhealthy food environments, and high and persistent inequality), including interventions to lower the cost of nutritious foods and strengthen food environments (extended definition). These intervention areas are identified in Table S3.2 of the Supplementary material to Chapter 3 S3.2. Understanding whether the financing flows that support these interventions for food security and nutrition are growing, the specific areas of intervention that they are targeting, and whether the most important recipient countries (in the case of ODA and OOF) are those where hunger, food insecurity and malnutrition are the most challenging in the world are key elements of this chapter.
Private financing flows (both domestic and external) are generally more difficult to track, let alone use for applying the core and extended definitions of financing for food security and nutrition proposed in this report. As a consequence, a robust number for the total financing available in support of all the efforts towards meeting SDG Targets 2.1 and 2.2 is not yet quantifiable. Therefore, this chapter makes unavoidable inferences from patchy data and existing literature to detect patterns between private finance and food security and nutrition. Philanthropic flows are exceptional as data associated with these flows can be analysed after applying the core and extended definitions of financing for food security and nutrition. For other important private flows such as cross-border remittances and foreign direct investment (FDI), one can only rely on existing studies and data sources that offer only partial information relevant to food security and nutrition.
In the face of the impossibility of fully accounting for the total amount of public and private financing flows globally available for food security and nutrition, this chapter delves into existing model-based analyses that provide partial estimates of how much it may cost to finance several policies and interventions to end hunger, food insecurity and malnutrition and make healthy diets more affordable by 2030. The cost ranges identified have limitations but provide a sense of the financing challenge for the future. Irrespective of exactly how much financing is needed to meet SDG Targets 2.1 and 2.2, the cost of not mobilizing it can be significant and detrimental for the world; hence, the cost of inaction is discussed at the end of the chapter, which also serves as a preamble to Chapter 5 on what is needed to catalyse scalable financing to fill the gap.
4.1 Tracking current levels of financing for food security and nutrition
Public spending on agriculture is low and not increasing where it is most needed
Food and agriculture-specific expenditures are among the components of public finance that can most directly influence food security and nutrition outcomes. Following the definition of FAO’s Monitoring and Analysing Food and Agricultural Policies (MAFAP) programme, these public expenditures can be grouped into: i) budget transfers for the provision of private goods that are allocated to agents such as producers, consumers, traders, transporters and input suppliers; ii) general support for agricultural infrastructure, research and development (R&D) and extension services, marketing, storage or inspection facilities, among others; and iii) administrative costs.1 These public expenditures may be both recurrent in nature (e.g. to cover salaries of extensionists or administrative staff) or for investment in capital goods (e.g. agricultural infrastructure or rural roads and electrification). However, public spending that can affect food security and nutrition outcomes may also be channelled through sectors such as health (e.g. public health programmes for vitamin A deficiency control), and there may also be important overlaps with social protection programmes. This is precisely the reason why it is important to rely on a broader definition of financing – or, in this case, public spending – for food security and nutrition.
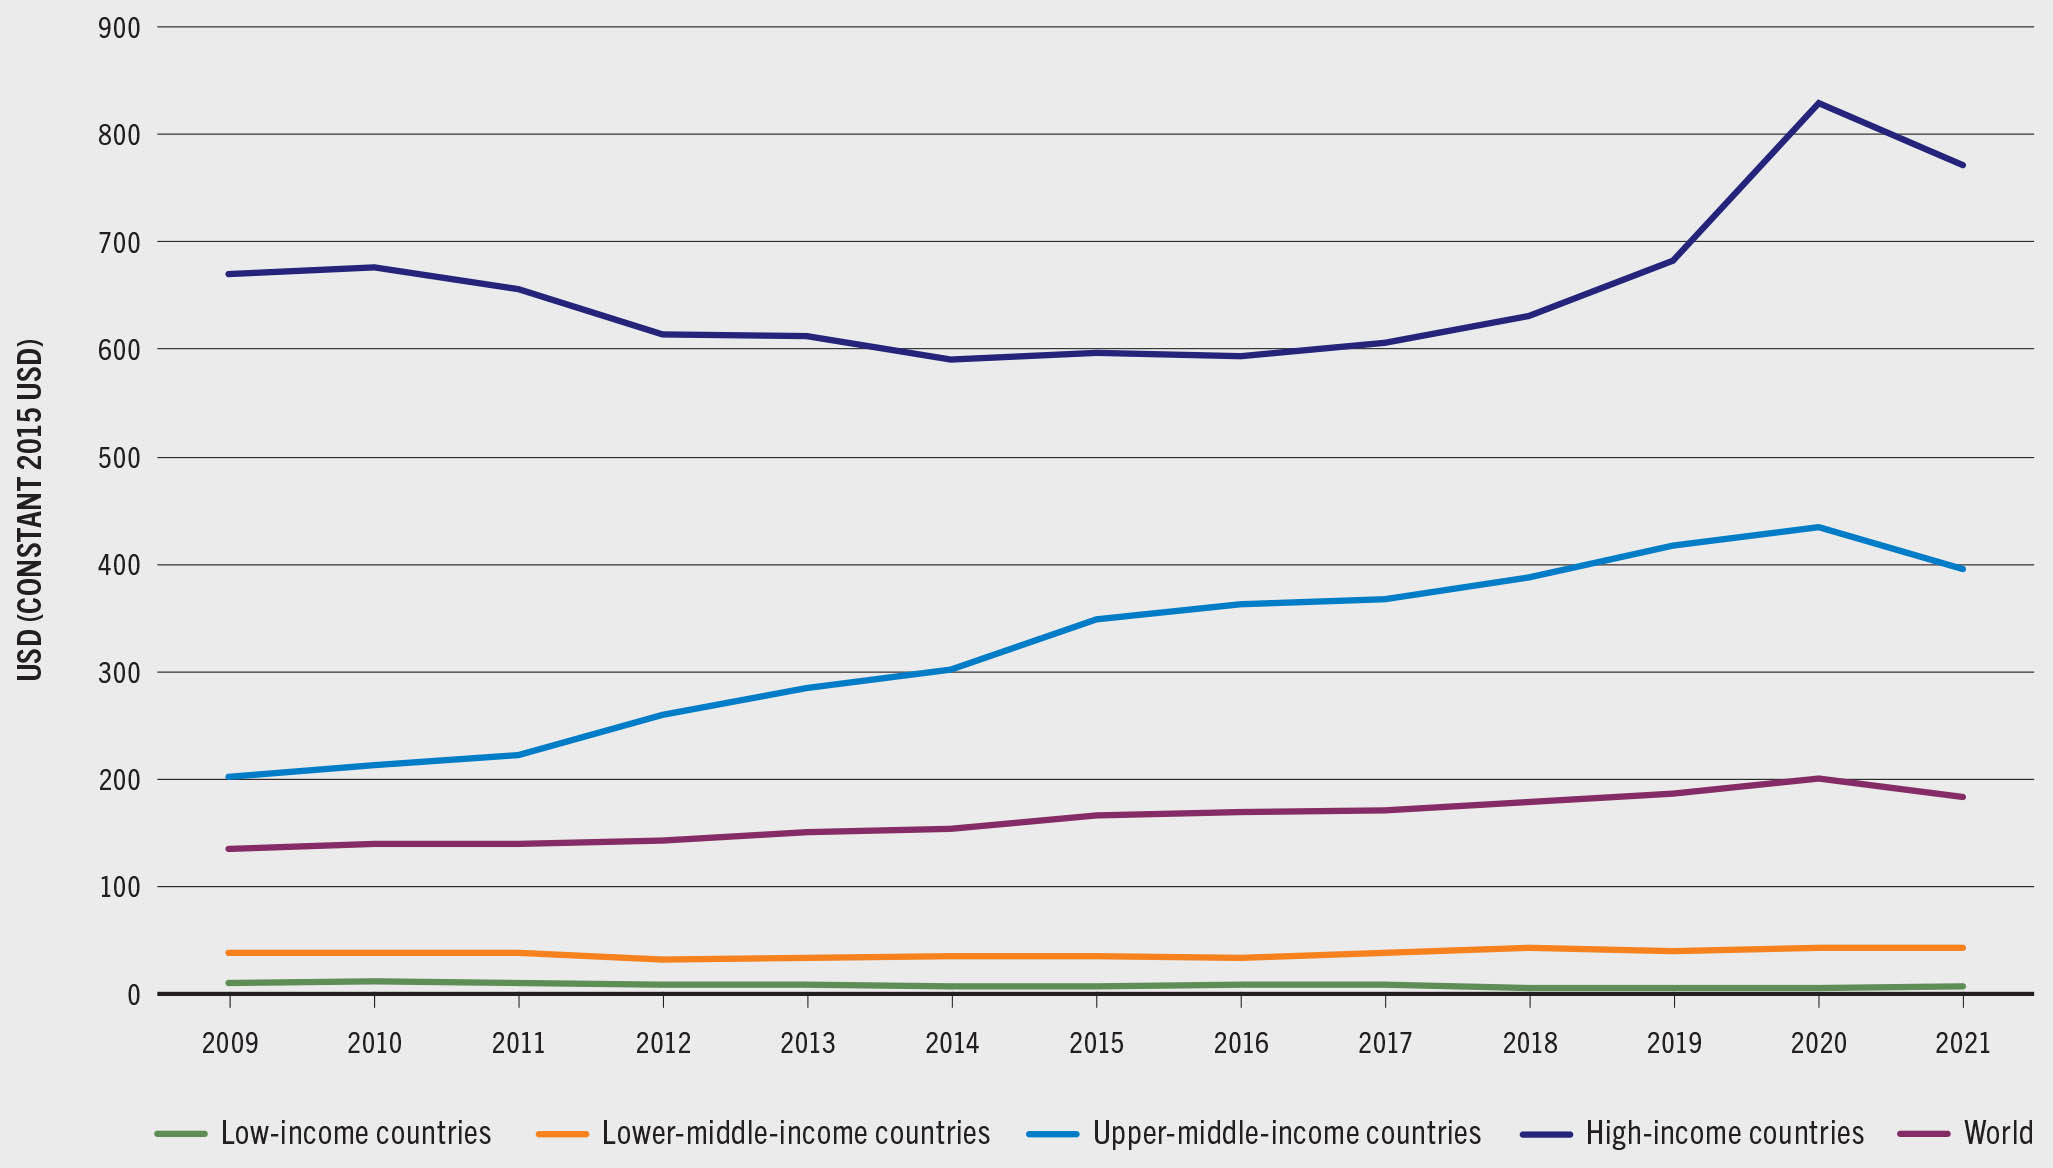
In the face of data limitations to comprehensively track government spending for the food and agriculture sector at the global level as defined by FAO’s MAFAP programme, the general domestic government expenditure on agriculture per rural inhabitant (constant 2015 USD) at the global level is tracked, using information from FAOSTAT. This is a more limited approach because the spending tracked is not for the whole food and agriculture sector but only for agriculture – hence, it is interchangeably referred to in the chapter as public spending on agriculture. Furthermore, it is not possible to detect whether budget transfers for the provision of private goods are equally (or unequally) allocated to individual agents. As will be further shown below for selected low-income countries (LICs), lower-middle-income countries (LMICs) and upper-middle-income countries (UMICs), the public spending that is directly associated with food security and nutrition can be significantly higher than public spending on agriculture. Notwithstanding this limitation, the general domestic government expenditure on agriculture at the global level shows interesting facts and patterns. Total general domestic government expenditure on agriculture had been growing steadily since the early 2000s, reaching a maximum of USD 675.4 billion (constant 2015 USD) in 2020, and then it declined to USD 617.3 billion in 2021. This expenditure, when measured per rural inhabitant, barely changed between 2010 and 2021 in LICs and only saw a very slight increase in LMICs towards the last years of the period (Figure 21). In these two country income groups, public spending on agriculture was only USD 8 and USD 37, respectively, per rural inhabitant, on average, in the period from 2010 to 2019. This points to how limited the financing for food security and nutrition through public spending on agriculture generally is in these countries.
FIGURE 21 General domestic government expenditure on agriculture per rural inhabitant is extremely low and not clearly increasing in low- and lower-middle-income countries where it is mostly needed to reduce food insecurity and malnutrition
SOURCE: Based on FAO. 2024. FAOSTAT: Government Expenditure. [Accessed on 24 July 2024]. https://www.fao.org/faostat/en/#data/IG. Licence: CC-BY-4.0.
On the other hand, governments are spending more per inhabitant where food insecurity and undernutrition are, by and large, the least problematic in the world. General domestic government expenditure on agriculture per rural inhabitant is much higher in UMICs and high-income countries (HICs) (USD 317 and USD 626 per rural inhabitant, on average, during 2010–2019, before the COVID-19 pandemic). In UMICs, general domestic government expenditure on agriculture per rural inhabitant shows a steady increase up to 2020. In HICs, in contrast, this expenditure shows a reduction up to 2016 – likely in line with these countries’ reduction in agriculture’s share of gross domestic product (GDP); from 2017 onwards, this expenditure is notably stepped up – driven by a significant increase in spending in the United States of America.m General domestic government expenditure on agriculture per rural inhabitant is extremely low in LICs and LMICs, where it is mostly needed to reduce food insecurity and malnutrition, and it has increased systematically over the years only in UMICs. As outlined in Chapter 2 (Figure 2), hunger is still on the rise in Western Asia, the Caribbean and most subregions of Africa, regions that host the largest number of LICs. At the same time, progress has been made towards reducing hunger in most subregions in Asia and in Latin America, where middle-income countries (MICs) are more numerous than LICs. Furthermore, where public spending on agriculture per rural inhabitant is higher, such as in UMICs and HICs, this spending may not always fully contribute to the efficiency, equitability and sustainability of agrifood systems.2 In fact, the 2022 edition of this report called for governments to repurpose some of the existing public support to agriculture to make healthy diets more affordable for all, offering alternative model-based scenarios.2 The importance of repurposing and optimally allocating public spending on food and agriculture is further discussed at the end of this chapter.
Public spending on agriculture correlates negatively with food insecurity and some forms of malnutrition
The association between total public spending and food security and nutrition outcomes across LICs, LMICs and UMICs has attracted only scarce empirical cross-country research. Much of the existing statistical literature focuses on one country or region, or on HICs; on limited or approximative food security and nutrition indicators; on one public expenditure sector, generally agriculture given its most direct association with food security and nutrition; or on outcomes such as growth or poverty reduction that may be related to food security and nutrition but are distinct from them. Furthermore, existing studies may not control for other factors that affect food security and nutrition or consider government policies that do not involve significant expenditure.
Cross-country evidence for 65 countries (including 11 HICs) indicates that greater public spending on agriculture, social protection and health was associated with reduced stunting.3 This has also been partially corroborated by an analysis for nine Southern African countries, which found a favourable association between public spending on agriculture, average dietary energy supply adequacy and the prevalence of undernourishment (PoU).4 Significant impacts on food security indicators (i.e. average dietary energy supply adequacy, domestic food price index, domestic food price volatility, and proportion of population using improved sanitation facilities) have also been found for public spending on agricultural R&D in Africa and also for general public expenditure in agriculture, but only for the countries that allocate the larger proportions of their budgets to agriculture.5
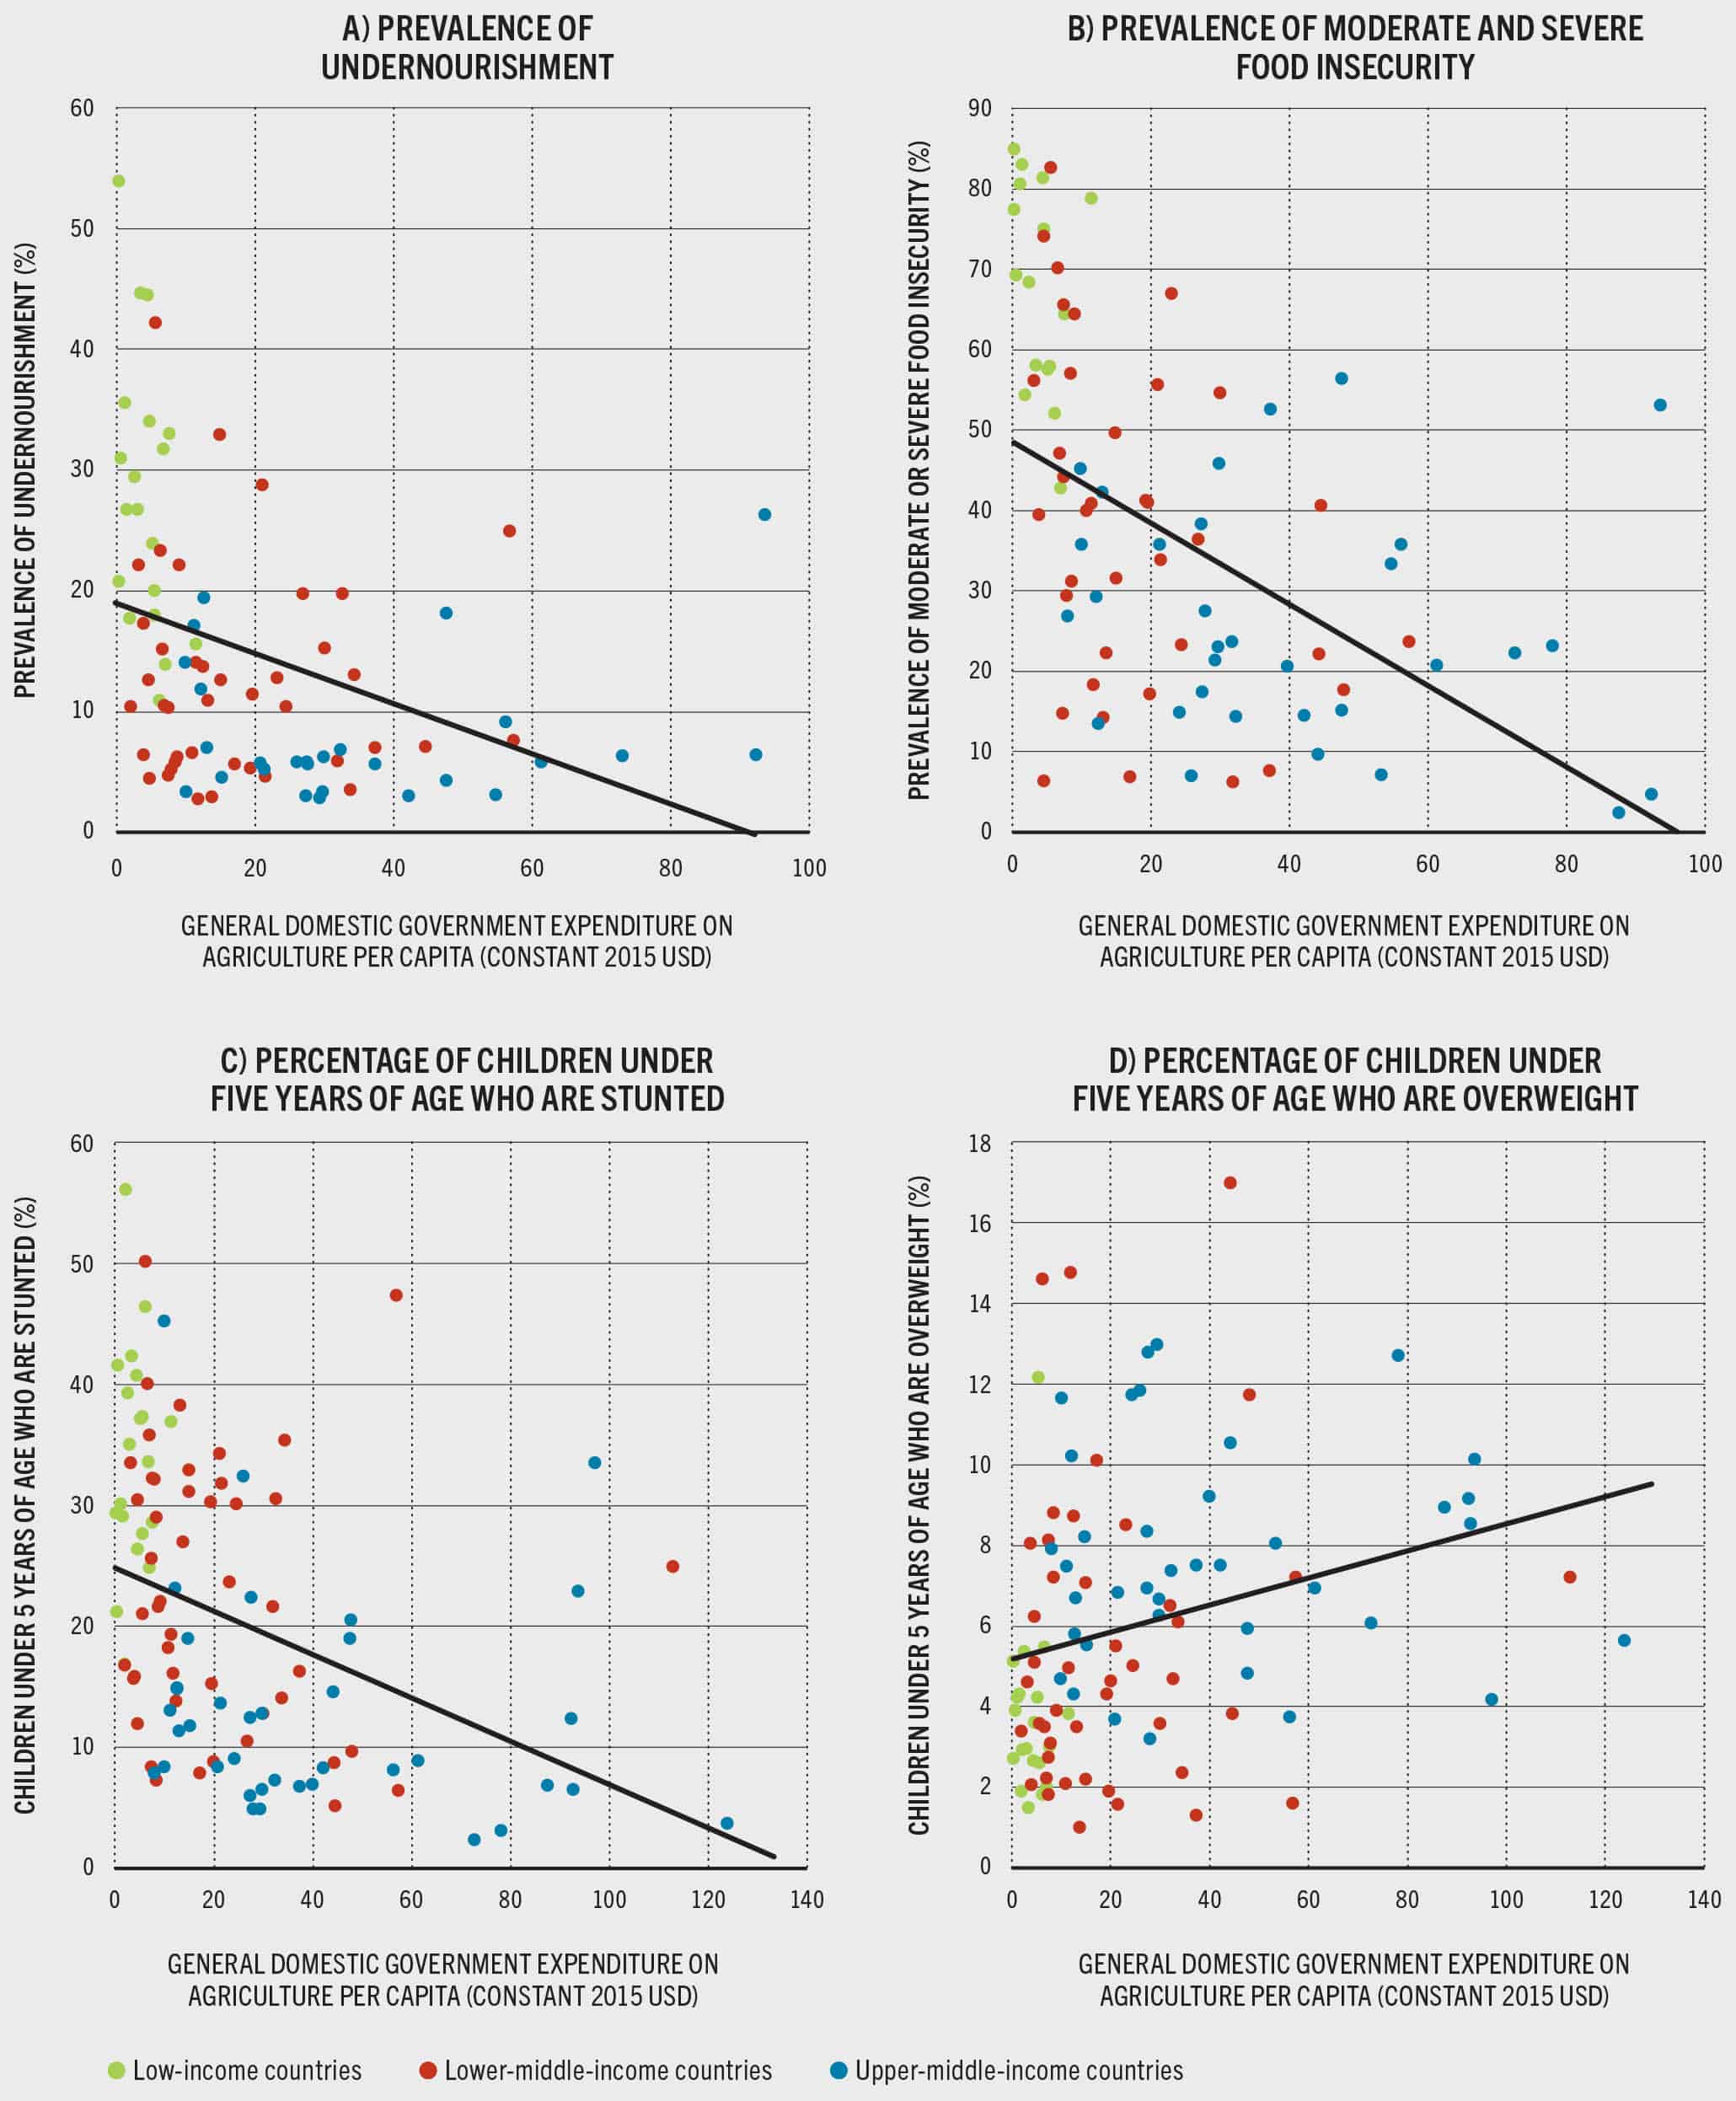
Our analysis corroborates that public spending on agriculture correlates in expected ways with most – albeit not all – food security and nutrition outcomes, even if it is only a part, and sometimes even a small one, of all the public spending on food security and nutrition, as will be further shown below for some countries. This is an analysis of observed association, which does not imply a causal relationship and can be affected by the income level of a country, among other factors. Still, it shows that the lower the general domestic government expenditure on agriculture per capita, the larger the PoU in 87 LICs, LMICs and UMICs (Figure 22A). In more than half of these (49 countries), the PoU is above 10 percent, and governments in most of these countries (39 countries, mostly LICs and LMICs) spent on average USD 20 per person or less between 2017 and 2019. In a dozen LMICs and UMICs, the PoU is 7 percent or less, and yet the governments in these countries spent USD 20 per person or less on agriculture. This is to be expected for MICs, where the PoU is low since most people’s incomes allow them to access food. The negative correlation between general domestic government expenditure on agriculture per capita and food security indicators is also seen for the prevalence of moderate or severe food insecurity (Figure 22B) and the prevalence of stunting (Figure 22C). These two additional correlations (as measured by a significant coefficient of correlation of −0.51 and −0.39, respectively) are stronger than the correlation observed for the PoU (as measured by a coefficient of correlation of −0.33).
FIGURE 22 General domestic government expenditure on agriculture per capita is negatively correlated with food security and undernutrition indicators, average 2017–2019
SOURCES: FAO. 2024. FAOSTAT: Government Expenditure. [Accessed on 24 July 2024]. https://www.fao.org/faostat/en/#data/IG. Licence: CC-BY-4.0; FAO. 2024. FAOSTAT: Suite of Food Security Indicators. [Accessed on 24 July 2024]. https://www.fao.org/faostat/en/#data/FS. Licence: CC-BY-4.0.
The literature on the association between public spending and overweight and obesity is scarcer than that on the association between public spending and food insecurity and undernutrition, and this shall continue to be explored more regularly through future editions of this report. Regarding obesity, for example, the literature overwhelmingly focuses on HICs and looks much more often into the consequences of obesity on public expenditure (especially in the health sector) than into the possible effects of public expenditure on obesity. It finds a positive association between overweight and public expenditure on agriculture, social protection and health.3 Social spending in Organisation for Economic Co-operation and Development (OECD) countries (mainly on early childhood education and care) has also been found to have a favourable impact on obesity among children aged 5 to 19 years, after controlling for other factors.6
Our correlation analysis, which encompasses LICs and MICs instead of HICs, indicates that the more governments spend on agriculture, the more countries exhibit a high percentage of children under five years of age who are overweight – with a correlation coefficient of 0.27 for 105 LICs, LMICs and UMICs (Figure 22D). There may be several explanations for this, which merit more empirical exploration in future editions of this report. One could be that a higher prevalence of overweight among children may prompt governments to spend more on some nutrition-related programmes, although this response may not necessarily be overwhelmingly happening through national budgets for agriculture. Another hypothetical explanation is that public spending on agriculture does not support enough nutrition-sensitive actions, nor does it enable healthy food environments. As seen in previous editions of this report, not only are healthy diets unaffordable for billions, but also food environments are not conducive to healthy diets.7 The world is also not producing sufficient fruits and vegetables and other nutritious foods for a growing population demanding them more, including in rural areas.8 Public support to the food and agriculture sector, including fiscal subsidies, has also created incentives to increase the availability and reduce the price of staple foods and their derivatives – including highly processed foods high in unhealthy fats, sugars and/or salt and of minimal nutritional value – while at the same time discouraging and making relatively more expensive the consumption of unsubsidized or less subsidized commodities such as fruits, vegetables and pulses.2 Unsurprisingly, as seen in Chapter 2, millions of children under five years of age are experiencing overweight.
Overweight may also be more highly correlated with public spending in the health sector compared with public spending in the agriculture sector. However, not only is there a positive correlation between general domestic government expenditure on treatment of nutritional deficiencies per capita and the percentage of children under five years of age who are overweight (not shown graphically here), but this correlation is also similar to that seen above for public spending on agriculture (i.e. coefficient of correlation equivalent to 0.33).n It may very well be the case that LICs and MICs that spend more on nutritional deficiencies are also those countries with higher levels of overweight and obesity – but this hypothesis needs further exploration. Clearly, not only will more domestic public finance be needed to support public spending on agriculture, but countries, particularly LMICs and UMICs, will need to invest more heavily in nutrition-sensitive agriculture and healthier food environments to address the problems of overweight and obesity more effectively.
The association between public spending on agriculture and food security and nutrition outcomes at the global level is likely weakened by inefficiencies in the actual public expenditures. The association between public spending on food security and nutrition and food security and nutrition outcomes is expected to be relatively stronger because, as shall be noted below, public spending on agriculture is only a small fraction of public spending on food security and nutrition.
Public spending on food security and nutrition in selected low-income countries and middle-income countries
Readily available public spending data do not exist for all the countries in the world to apply the core and extended definitions of financing for food security and nutrition introduced in Chapter 3 – so as to arrive at a global aggregate of this financing. This exercise has been piloted on public spending data for ten countries from different regions for this report: one LIC (Uganda), five LMICs (Benin, India, Kenya, Nigeria and Philippines), and four UMICs (Brazil, Georgia, Mexico and South Africa). Data sources and the approach for applying this exercise are described in the Supplementary material to Chapter 4 S4.2. The approach allows the calculation of public spending on food security and nutrition expressed in real terms for all ten countries.
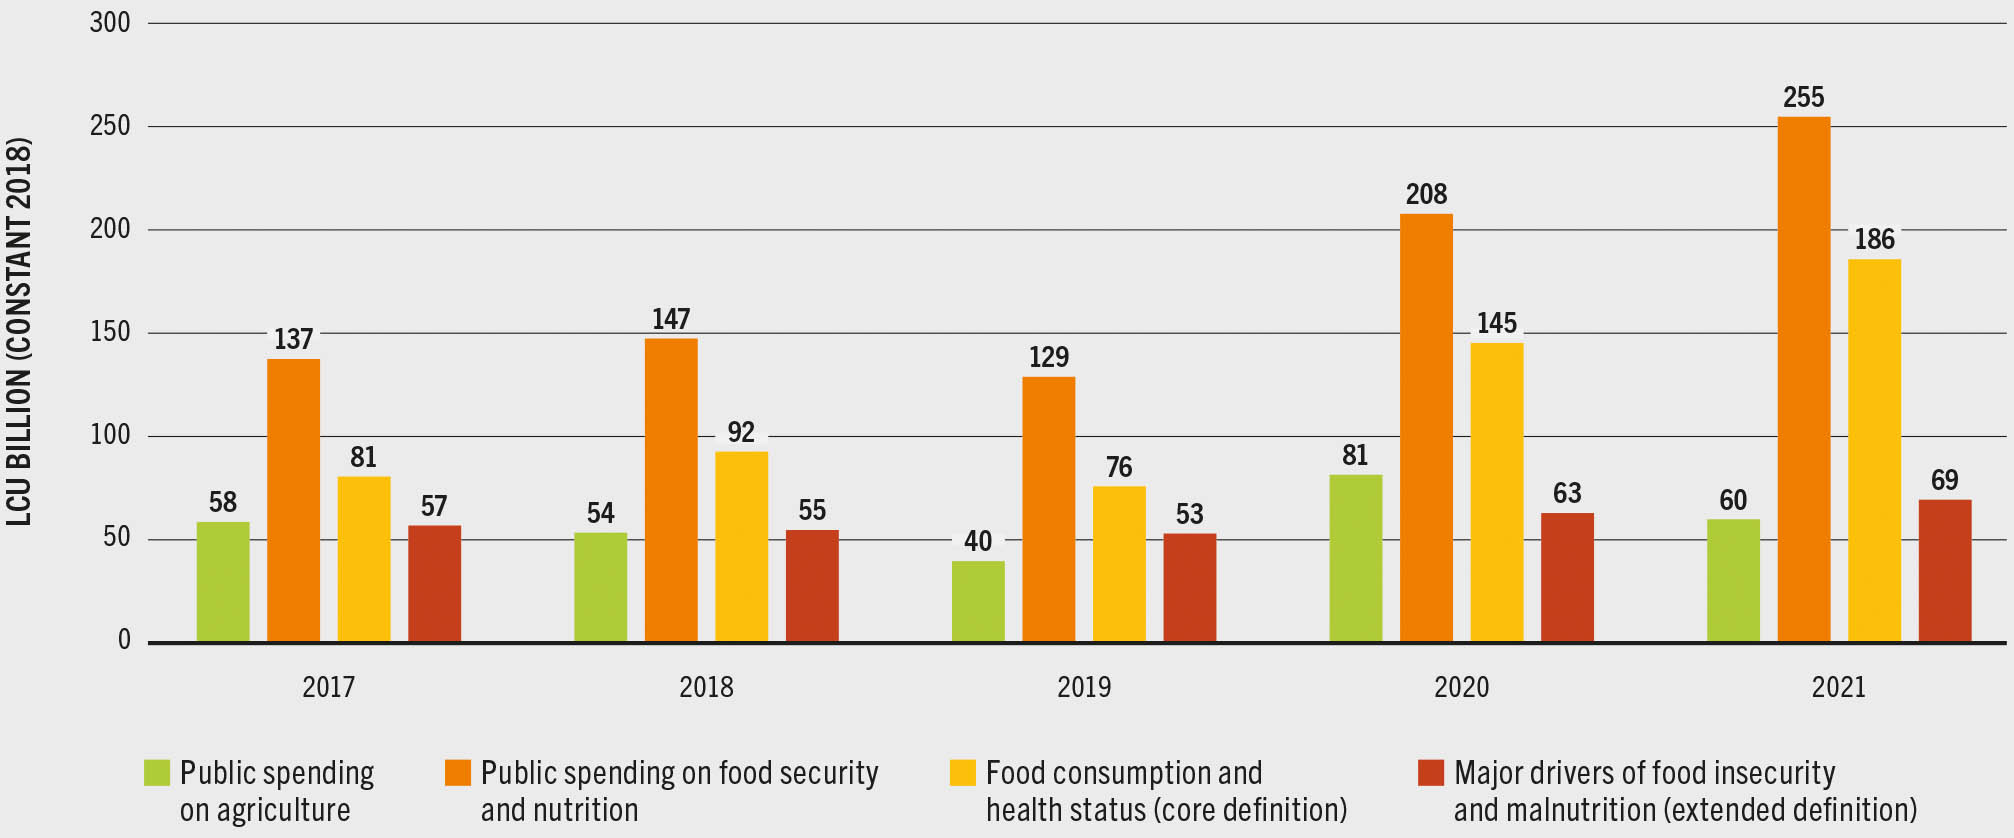
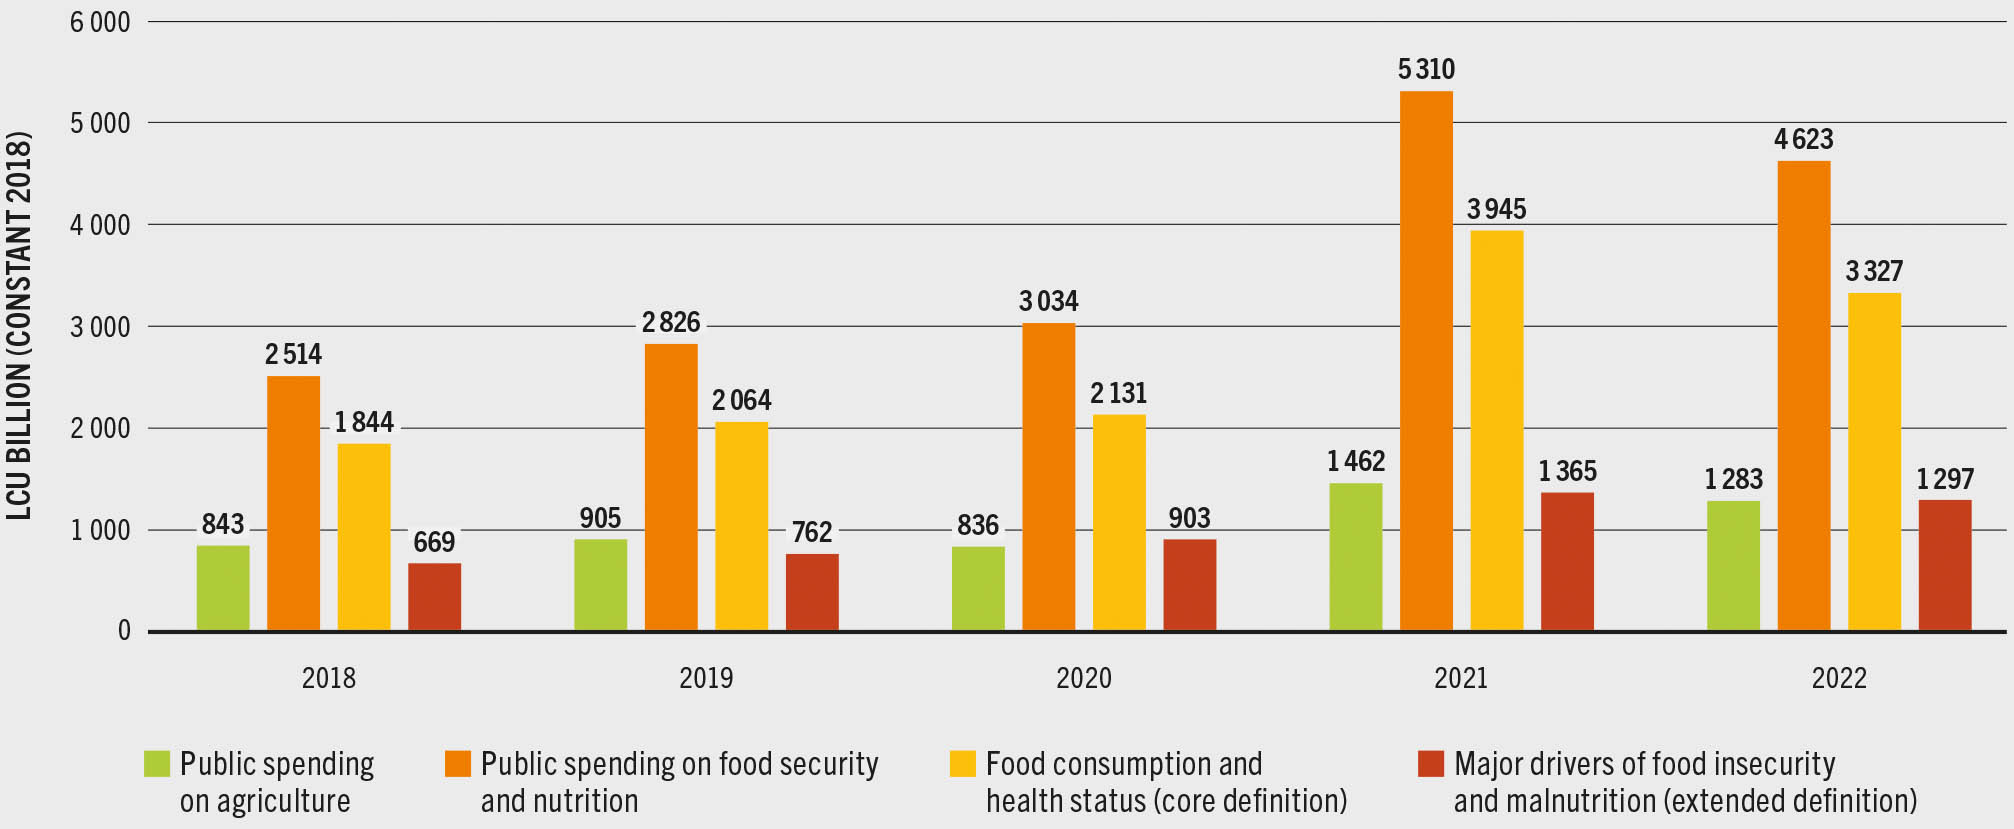
A focus on how governments spend to support food security and nutrition in countries with the lowest income per capita levels is particularly important for two reasons: i) these are the countries where public spending per capita tends to be the lowest in the world; and ii) these are the countries with the more pressing food insecurity and malnutrition challenges which have traditionally faced higher levels of undernutrition. An interesting finding is that in the two countries with the lowest income per capita analysed here, Benin and Uganda, public spending on food security and nutrition seems to have been growing. In fact, the total public spending on food security and nutrition shows an important increase from 2017/18 to 2021, and it significantly exceeds public spending on agriculture in these two countries (Figure 23 and Figure 24). In the case of Benin, considerable growth of spending on food consumption in 2020 and also in 2021 seems to suggest that during and following the COVID-19 pandemic, high priority was given to financing key determinants of food security and nutrition such as domestic production, food access and health services (Figure 23). In Uganda, considerable growth in public spending on food security and nutrition is observed only in 2021, but this stimulus was short-lived as this public spending decreased in 2022 – although it remained well above pre-COVID-19 levels (Figure 24).
FIGURE 23 Public spending on food security and nutrition shows almost steady growth in Benin up to 2021
SOURCE: Authors’ (FAO) own elaboration based on World Bank. 2023. World Bank Data Catalog: Benin BOOST platform: Public expenditure and revenue flows. [Accessed on 24 July 2024]. https://datacatalog.worldbank.org/search/dataset/0038083. Licence: CC-BY-4.0.
FIGURE 24 Public spending on food security and nutrition shows steady growth in Uganda, but this could not be sustained in 2022
SOURCE: Authors’ (FAO) own elaboration based on World Bank. 2023. BOOST open budget portal: Uganda BOOST Public Expenditure Database. [Accessed on 24 July 2024]. https://datacatalog.worldbank.org/search/dataset/0038076
The fact that public spending on food security and nutrition exceeds public spending on agriculture, reflects the important contribution of using the core and extended definitions of financing for food security and nutrition. These new definitions allow accounting for financing flows that target areas beyond the agrifood sector, such as health, water and sanitation, and education incurred in both rural and urban areas, as well as conflict-sensitive interventions that support livelihood resilience and do not fall within the boundaries of public spending on agriculture. An important share of the public spending on food security and nutrition is not accounted within the budget of the agriculture sector, but elsewhere, due to differences in where policies are being made.
On average, over the periods of analysis, 65 percent of total public spending on food security and nutrition in Benin (Table 9) and 73 percent in Uganda (Table 10) was allocated to food consumption and health status; the remaining share supported policies and actions along the six transformative pathways to address the major drivers of food insecurity and malnutrition (see Chapter 3, Figure 19). Food consumption took on average half or even more of the public spending on food security and nutrition over the period, and it mostly targeted food availability, but also food access, although to a lesser extent. Interestingly, 14 percent of these countries’ public spending on food security and nutrition is related to health and is mostly oriented towards health services and environmental health. Practices do not seem to feature in such expenditures in either country, but this is to a large extent due to the difficulty of identifying such practices in government budgets. An important share of the public spending on food security and nutrition in both countries (35 percent in Benin and 27 percent in Uganda on average over the period) contributed to addressing the major drivers of food insecurity and malnutrition and, although not shown here, these resources mostly supported policies targeting structural inequalities.
TABLE 9Composition of public spending on food security and nutrition in Benin
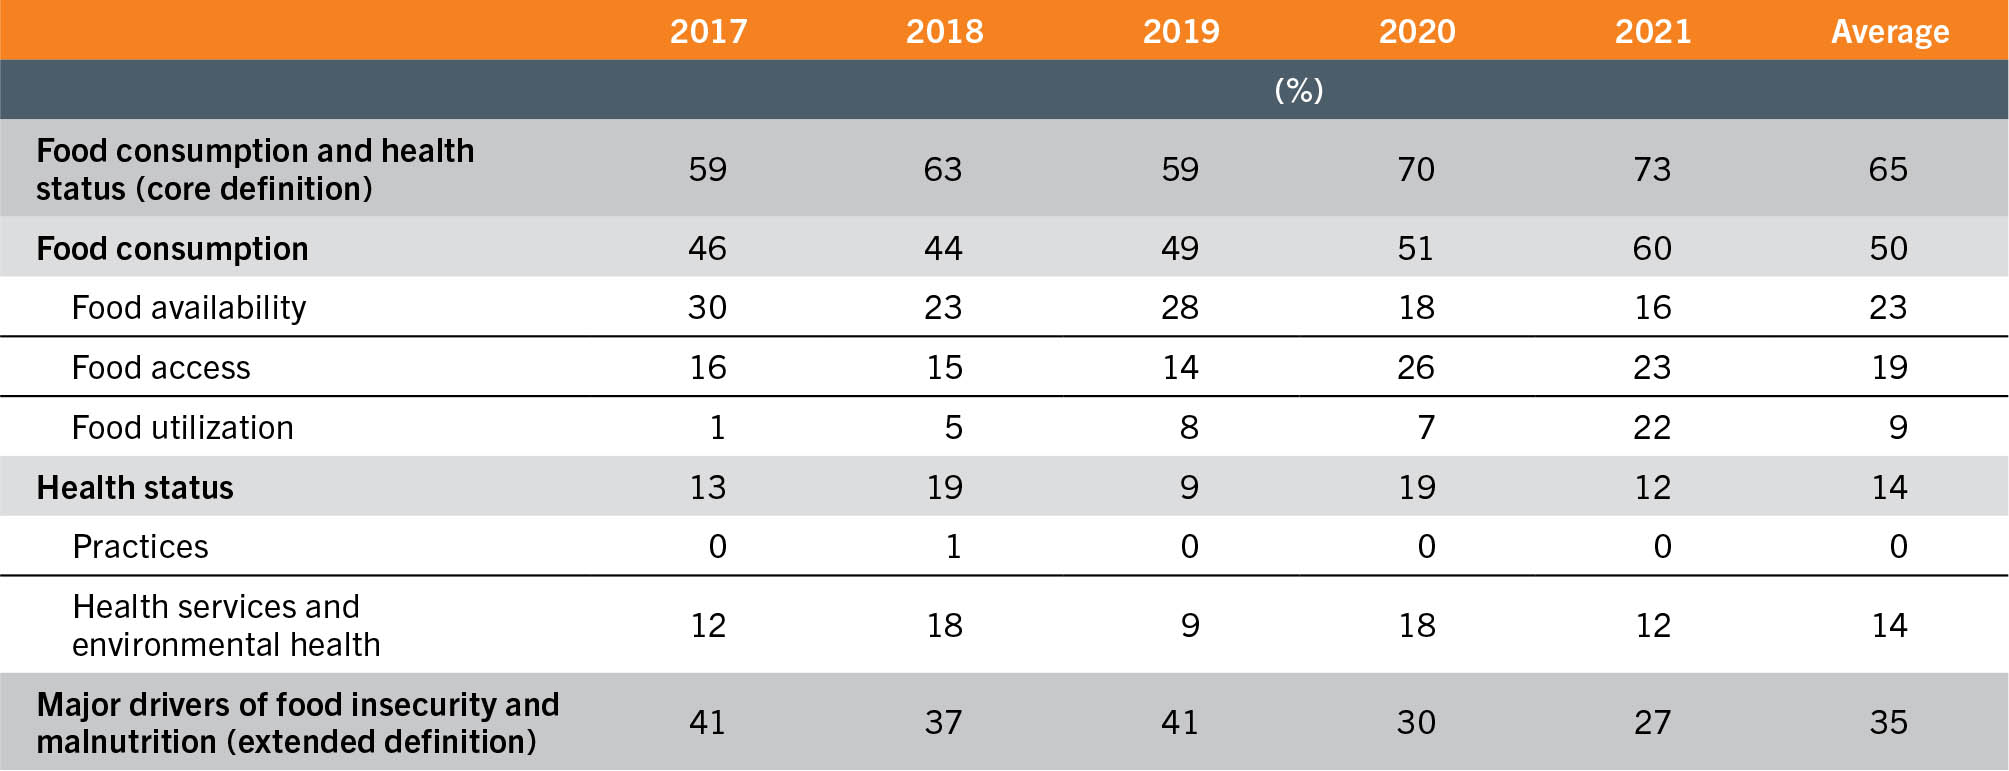
SOURCE: Authors’ (FAO) own elaboration based on World Bank. 2023. World Bank Data Catalog: Benin BOOST platform: Public expenditure and revenue flows. [Accessed on 24 July 2024]. https://datacatalog.worldbank.org/search/dataset/0038083. Licence: CC-BY-4.0.
Similar figures and tables to those presented here for Benin and Uganda are shown for eight MICs in the Supplementary material to Chapter 4 S4.2. Four general patterns can be identified from the data of these eight MICs. First, public spending on food security and nutrition exceeds general domestic government spending on agriculture more than it does in Benin and Uganda (compare Figure S4.1 to Figure S4.8 in the Supplementary material to Chapter 4 S4.2 with Figures 23 and Figure 24). In some UMICs, for example, general domestic government spending on agriculture on average represents less than 10 percent (9 percent in Brazil, 3 percent in Georgia) or around 15 percent (Mexico and South Africa) of total public spending on food security and nutrition. Second, like in Benin and Uganda, these eight MICs show an absolute increase in public spending on food security and nutrition but could not sustain the growth pace during the COVID-19 pandemic or right after, with two exceptions (Georgia and South Africa) (Figure S4.1 to Figure S4.8 in the Supplementary material to Chapter 4 S4.2). Third, the share of public spending on food security and nutrition that goes to addressing the major drivers of food insecurity and malnutrition tends to be on average higher for these eight MICs than for the countries with the lowest income per capita in the sample, Benin and Uganda. In fact, in some MICs more spending is allocated to address the major drivers of food insecurity and malnutrition (69 percent in Brazil, 60 percent in the Philippines) than to support food consumption and health status (Table 11). In some other countries, this share is about half or slightly less than half (Georgia, Mexico, Nigeria and South Africa) (Table 11). Fourth, although the data are not shown here, it is worth noting that these eight MICs allocate an important share to addressing structural inequalities, just like Benin and Uganda. However, an important difference is that these MICs allocate a much higher share of their public spending on food security and nutrition to strengthen the economic resilience of the most vulnerable to economic adversity; for example, Brazil’s share is an impressive 63 percent, and that of Georgia, the Philippines and South Africa is around 25 to 30 percent.
TABLE 10Composition of public spending on food security and nutrition in Uganda
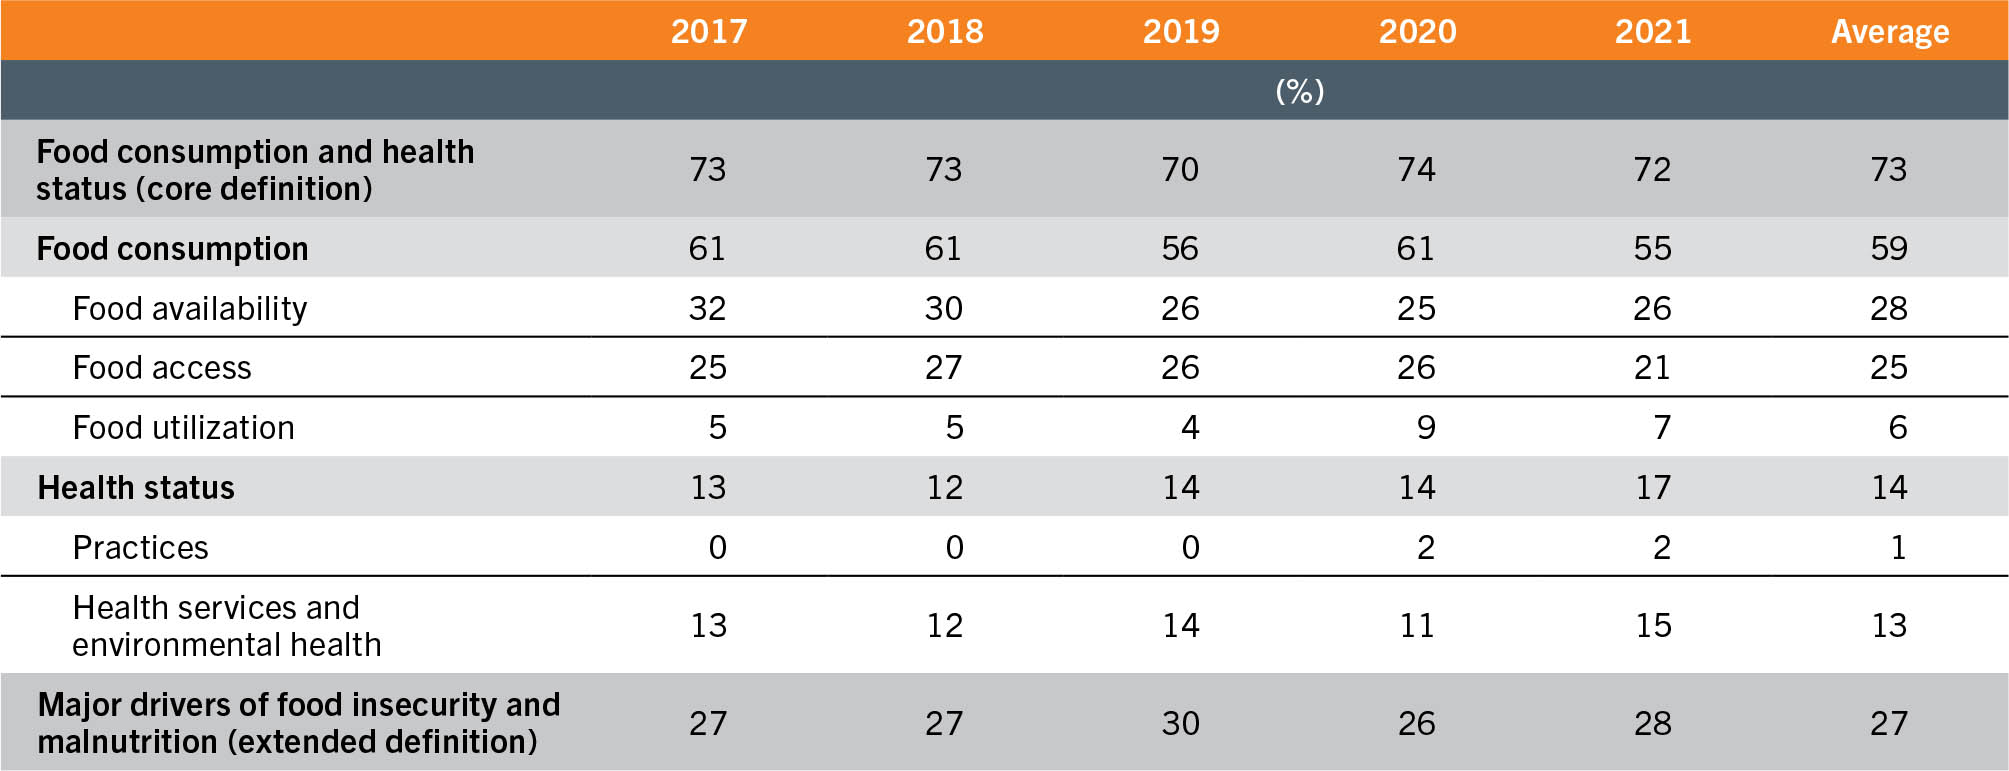
SOURCE: Authors’ (FAO) own elaboration based on World Bank. 2023. World Bank Data Catalog: Uganda BOOST platform: Public expenditure database. [Accessed on 24 July 2024]. https://datacatalog.worldbank.org/search/dataset/0038076. Licence: CC-BY-4.0.
TABLE 11Composition of public spending on food security and nutrition in selected low- and middle-income countries
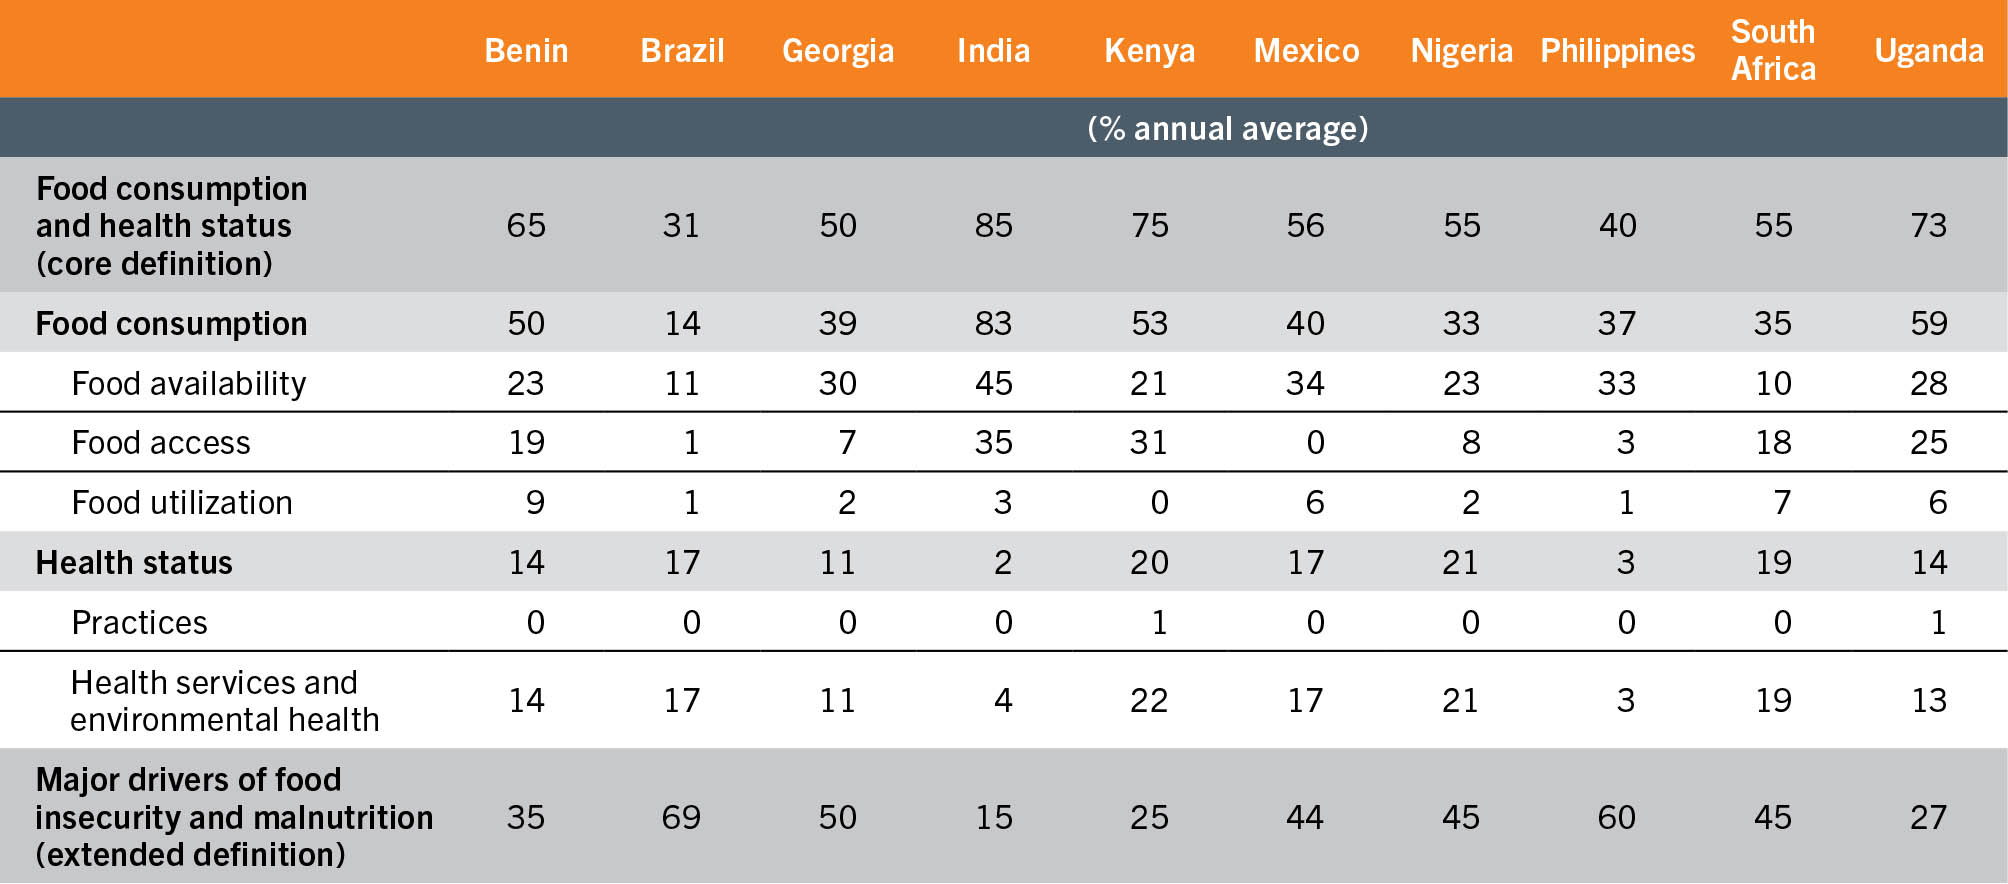
SOURCES: Authors’ (FAO) own elaboration based on World Bank. 2023. World Bank Data Catalog: Benin BOOST platform: Public expenditure and revenue flows. [Accessed on 24 July 2024]. https://datacatalog.worldbank.org/search/dataset/0038083. Licence: CC-BY-4.0 for Benin; Government of Brazil. 2024. Orçamentos Anuais PLDO I LDO I PLOA I LOA - Atos Normativos. In: gov.br – Ministério do Planejamento e Orçamento. [Cited 30 April 2024]. https://www.gov.br/planejamento/pt-br/assuntos/orcamento/orcamento/orcamentos-anuais for Brazil; Ministry of Finance of Georgia. 2024. Ministry of Finance of Georgia. [Cited 30 April 2024]. https://www.mof.ge/en/ for Georgia; Ministry of Finance, Government of India. 2024. Accounting information. In: Controller General of Accounts, Department of Expenditure. [Cited 30 April 2024]. https://cga.nic.in/index.aspx#account-section for India; The National Treasury & Economic Planning, Republic of Kenya. 2021. Sector budget proposal reports. [Cited 30 April 2024]. https://www.treasury.go.ke/sector-budget-proposal-reports for Kenya; Government of Mexico. 2024. Investor Relations Office of the Ministry of Finance and Public Credit. In: Gobierno de México. [Cited 9 May 2024]. https://www.finanzaspublicas.hacienda.gob.mx/es/Finanzas_Publicas/Ingles for Mexico; Government of Nigeria. 2024. Open Treasury Portal. [Cited 30 April 2024]. https://opentreasury.gov.ng for Nigeria; Republic of the Philippines, Department of Budget and Management. 2022. Budget of expenditures and sources of financing FY 2023. Manila. https://www.dbm.gov.ph/index.php/2023/budget-of-expenditures-and-sources-of-financing-fy-2023 for the Philippines; Republic of South Africa, National Treasury Department. 2024. National budget. In: National Treasury. [Cited 30 April 2024]. https://www.treasury.gov.za/documents/national%20budget/default.aspx for South Africa; World Bank. 2023. World Bank Data Catalog: Uganda BOOST Public Expenditure Database. [Accessed on 24 July 2024]. https://datacatalog.worldbank.org/search/dataset/0038076. Licence: CC-BY-4.0 for Uganda.
International development finance flows for food security and nutrition
The core and extended definitions of financing for food security and nutrition introduced in Chapter 3 were applied to international development finance flows at the global level. Specifically, this was done for ODA and OOF for the period from 2017 to 2021, following the methodology described in the Supplementary material to Chapter 4 S4.3 with data from the OECD Creditor Reporting System (CRS)9 and the AidData database,10 where feasible.o
Food security and nutrition take almost a quarter of official development assistance and other official flows and this share is not growing
Global ODA and OOF flows for all aid sectors amounted to USD 354 billion in 2021. The part of these flows that can be deemed related to food security and nutrition according to the core and extended definitions amounted to USD 77 billion in 2021, of which the majority (USD 61 billion or 79 percent) corresponds to ODA (Table 12). This level of ODA is higher than each of the levels of ODA reported in the different studies mentioned in Chapter 3 (see Figure 14), because the definition of financing for food security and nutrition is more comprehensive, especially as the extended definition includes interventions to address the major drivers of food insecurity and malnutrition.
TABLE 12Global official development assistance and other official flows for all aid sectors and for food security and nutrition
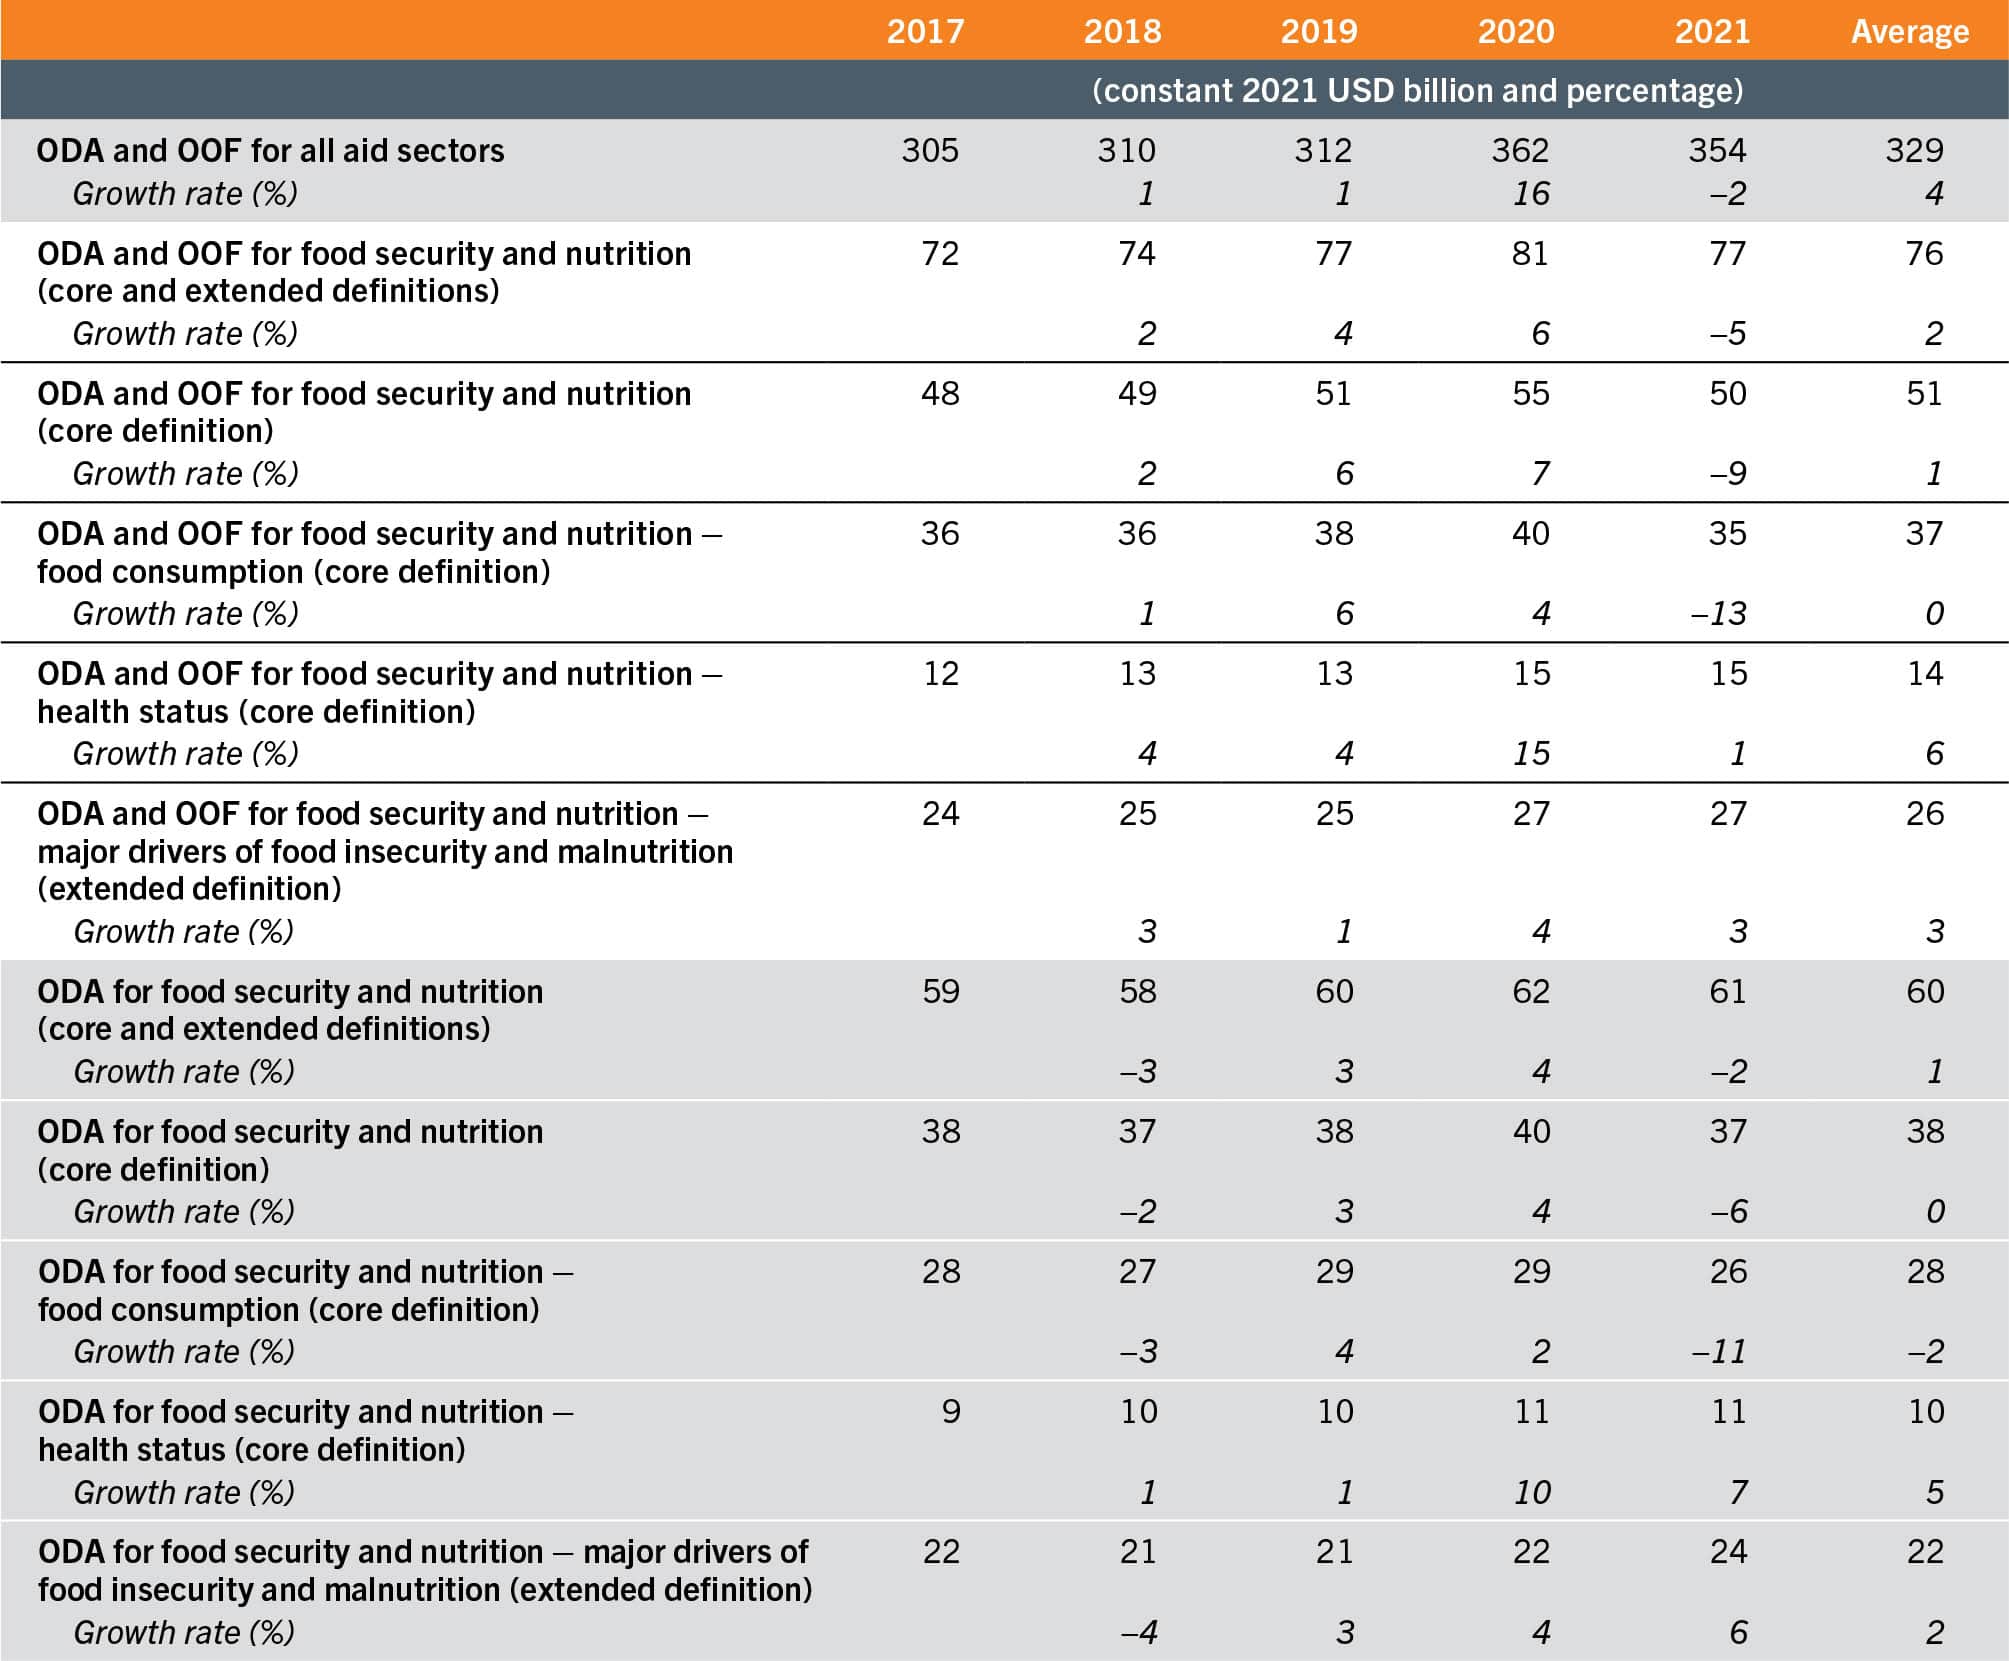
SOURCES: Authors’ (FAO) own elaboration based on the application of the methodology in the Supplementary material to Chapter 4 S4.3 to data from OECD. 2024. OECD Data Explorer. [Accessed on 24 July 2024]. https://data-explorer.oecd.org/?fs[0]=T%2Co&pg=0&fc=Topic&bp=true&snb=580; William & Mary. 2024. AidData: Data. [Accessed on 24 July 2024]. https://www.aiddata.org/datasets
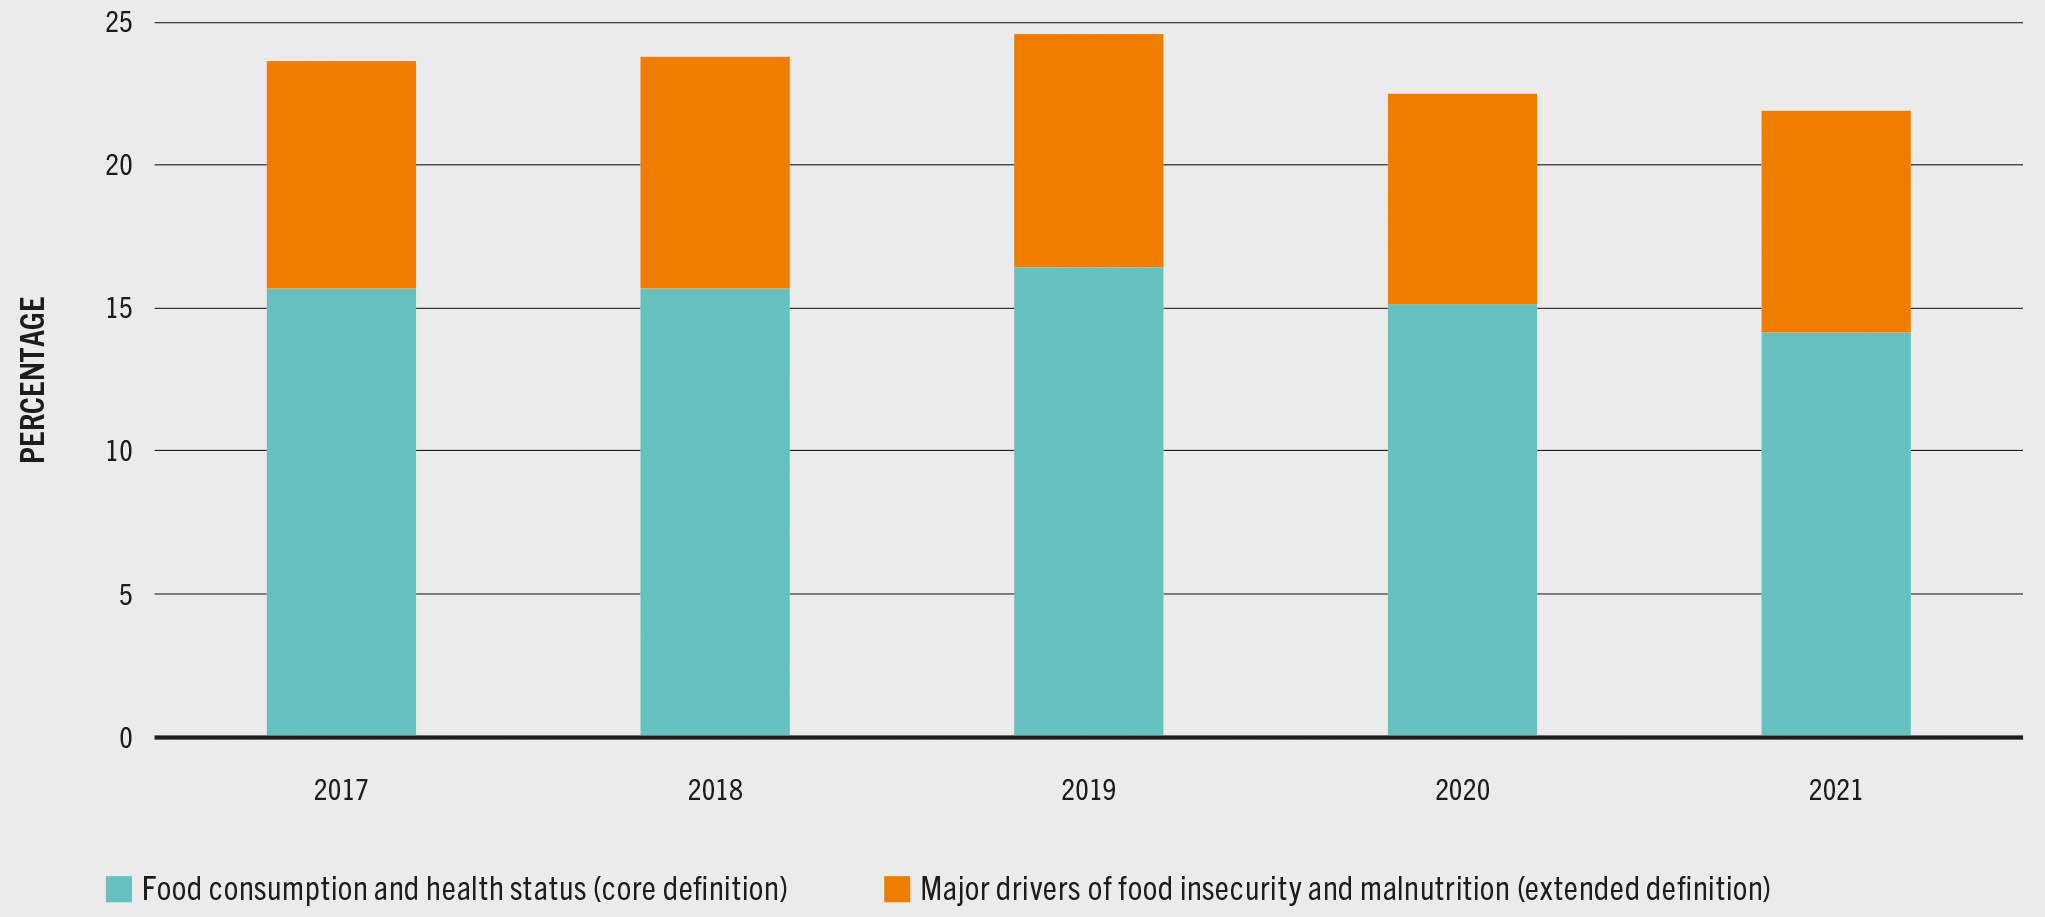
Interestingly, not even a quarter of global ODA and OOF flows for all aid sectors were allocated to food security and nutrition between 2017 and 2021. In fact, food security and nutrition flows seem to have been less of a priority for donors during this period, as these flows grew less rapidly than the flows to all aid sectors (2 percent versus 4 percent, on average, in 2017–2021), and even contracted relatively more in 2021 (−5 percent versus −2 percent, on average) when the effects of the COVID-19 emergency were still being felt (Table 12). Flows for food security and nutrition are mostly allocated to support food consumption and health (core definition), and the rest to support interventions for addressing the major drivers of food insecurity and malnutrition (extended definition) (Figure 25). The composition of the flows for food security and nutrition is, by and large, very stable over time (Figure 26).
FIGURE 25 Official development assistance (ODA) and other official flows (OOF) for food security and nutrition represent less than a quarter of global ODA and OOF flows and are mostly allocated to food consumption and health
SOURCES: Authors’ (FAO) own elaboration based on the application of the methodology in the Supplementary material to Chapter 4 S4.3 using amounts of flows in constant 2021 USD billion from OECD. 2024. OECD Data Explorer. [Accessed on 24 July 2024]. https://data-explorer.oecd.org/?fs[0]=T%2Co&pg=0&fc=Topic&bp=true&snb=580; William & Mary. 2024. AidData: Data. [Accessed on 24 July 2024]. https://www.aiddata.org/datasets
FIGURE 26 The composition of official development assistance and other official flows for food security and nutrition is very stable over time

SOURCES: Authors’ (FAO) own elaboration based on the application of the methodology in the Supplementary material to Chapter 4 S4.3 using amounts of flows in constant 2021 USD billion from OECD. 2024. OECD Data Explorer. [Accessed on 24 July 2024]. https://data-explorer.oecd.org/?fs[0]=T%2Co&pg=0&fc=Topic&bp=true&snb=580; William & Mary. 2024. AidData: Data. [Accessed on 24 July 2024]. https://www.aiddata.org/datasets
Food availability, health services and environmental health, conflict and inequality
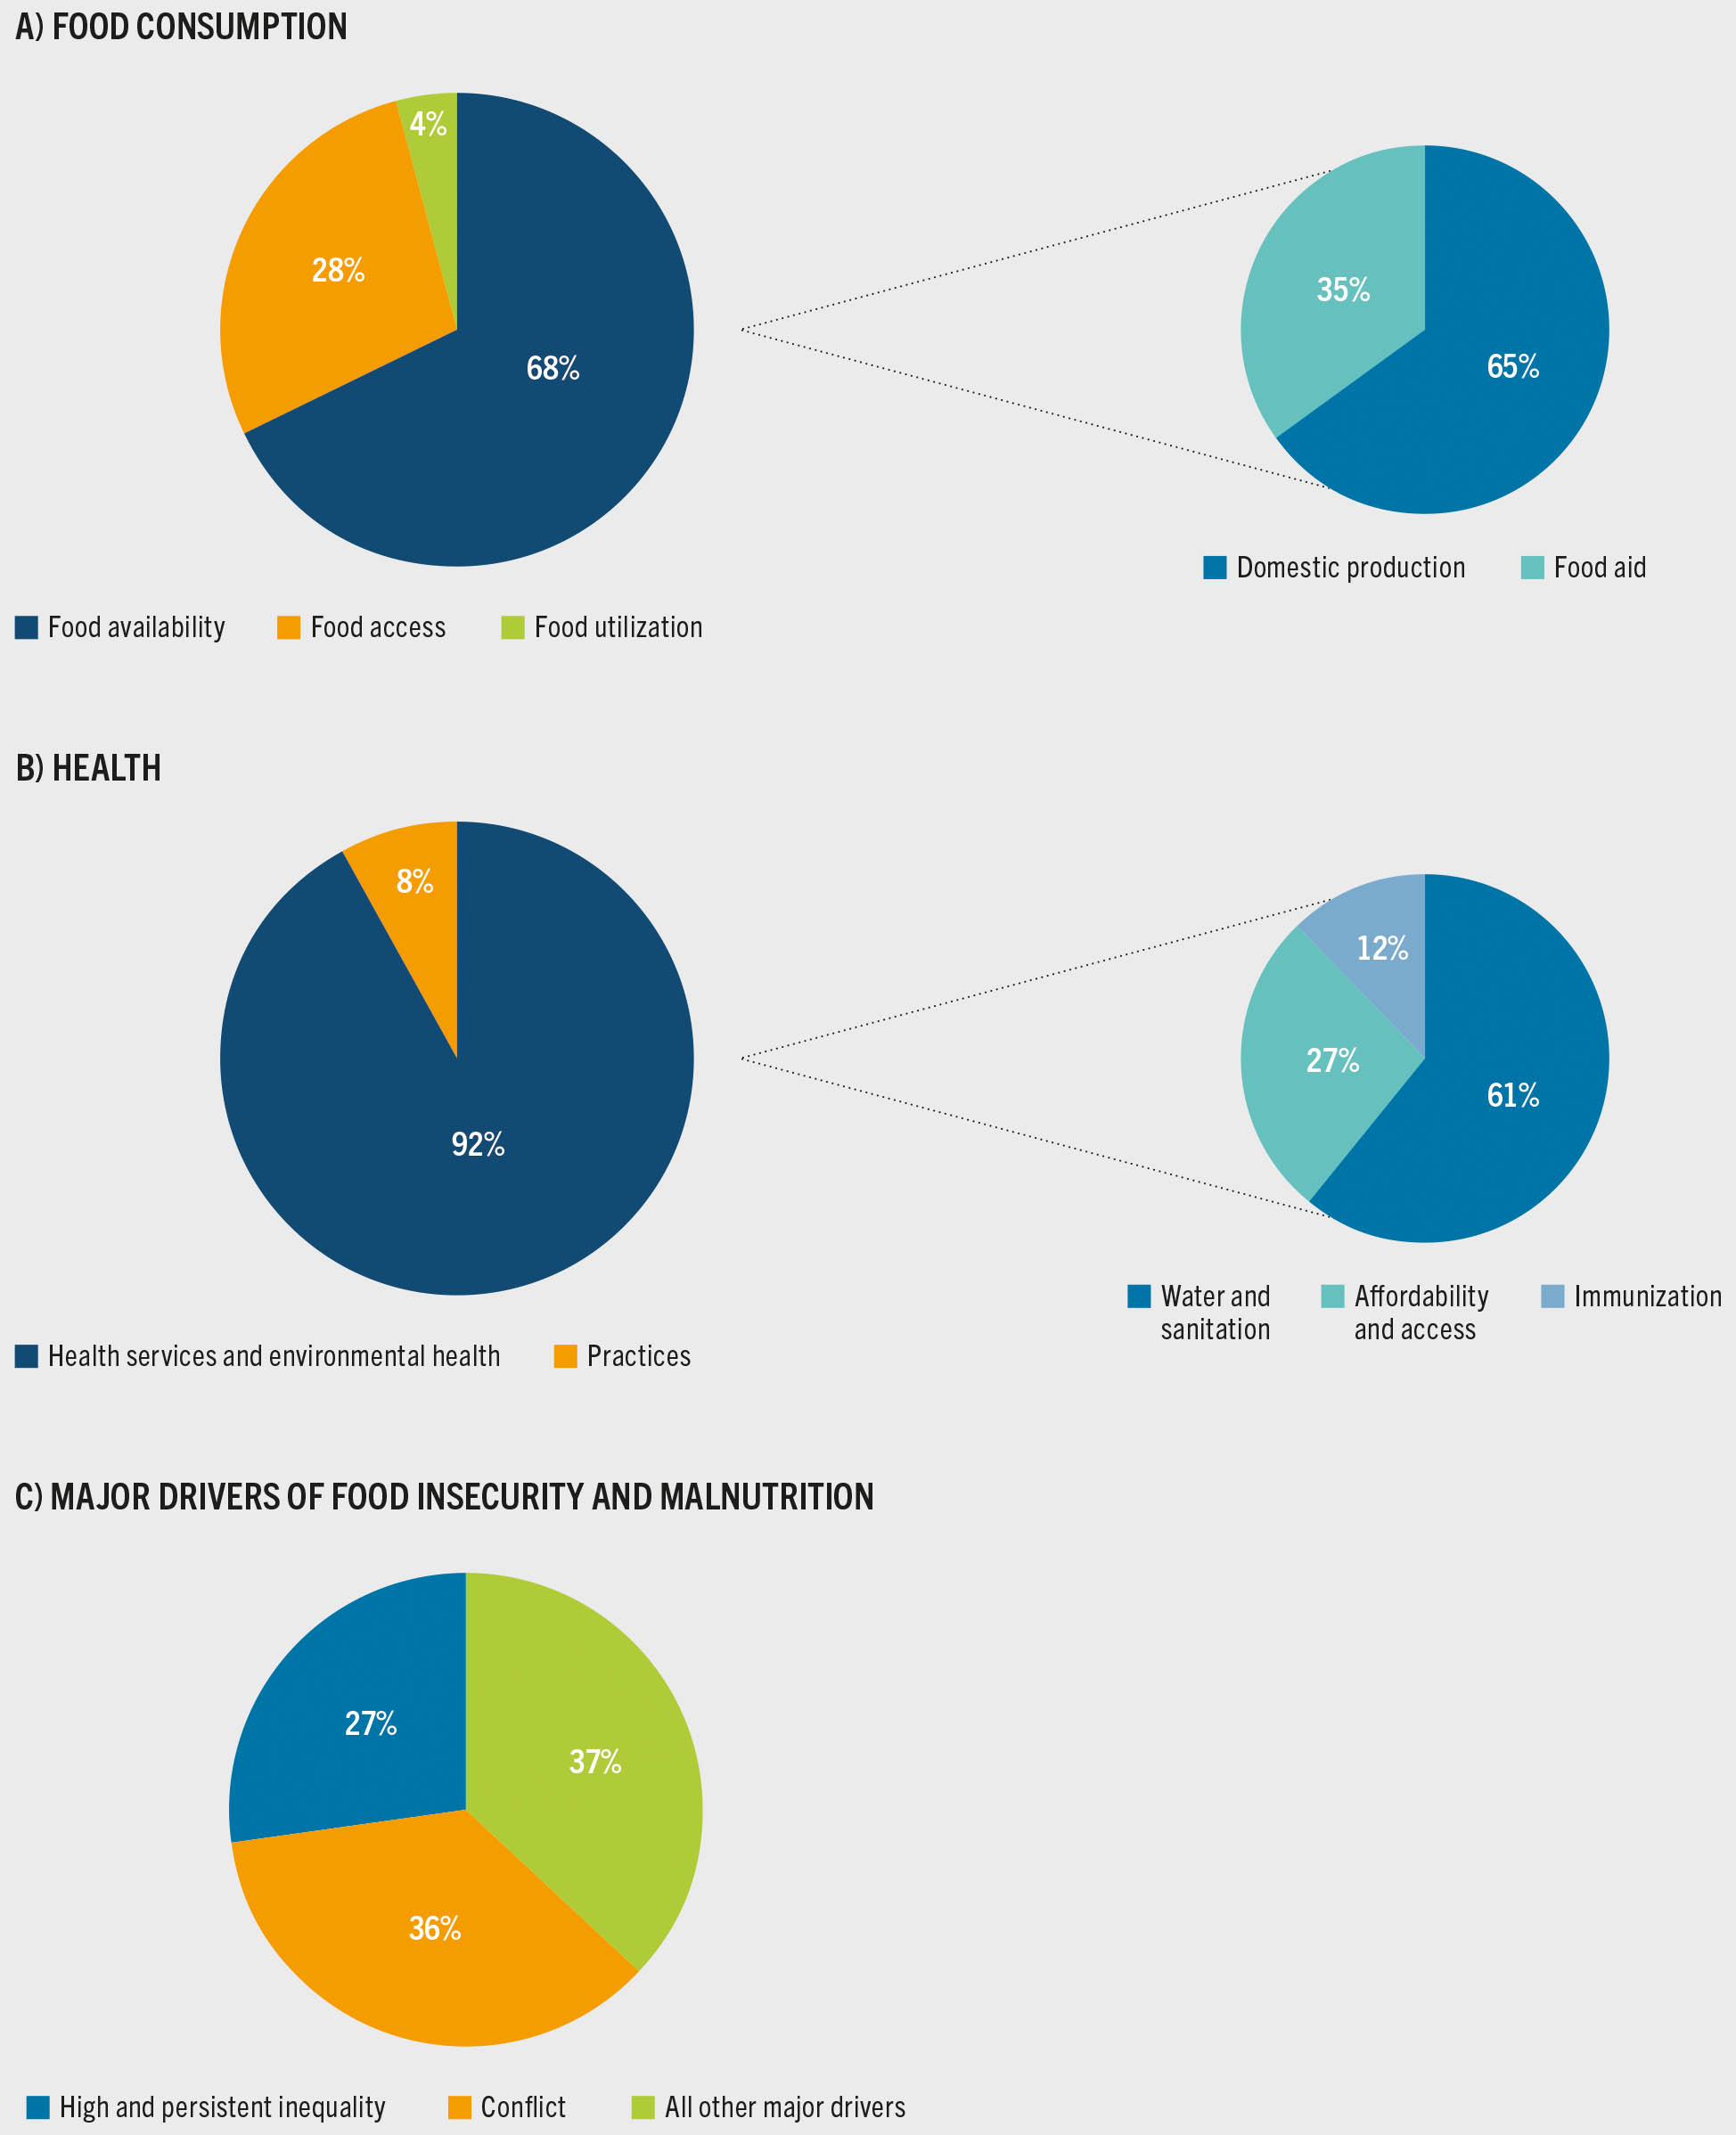
As noted earlier, the composition of ODA and OOF flows for food security and nutrition is very stable over time (Figure 26) and, by 2021, most resources were flowing to food consumption (USD 35 billion out of USD 77 billion); relatively few were allocated to interventions for addressing the major drivers of food insecurity and malnutrition (USD 27 billion), and even fewer to health status (USD 15 billion) (Table 12). Little more than two-thirds of the flows for food consumption were allocated to address food availability concerns (of which, slightly more than 64 percent were allocated to support domestic production and 35 percent to support food aid); the remaining third was overwhelmingly taken by food access (Figure 27A). Health services and environmental health took the lion’s share (92 percent) of the health-related flows, particularly in support of water and sanitation (Figure 27B). As for flows allocated to addressing the major drivers of food insecurity and malnutrition, conflict and inequality took a bit more than one-third each (Figure 27C).
FIGURE 27 Food availability, health services and environmental health, and conflict and inequality take the majority of the official development assistance and other official flows for, respectively, food consumption, health, and the major drivers of food insecurity and malnutrition, annual average, 2017–2021
SOURCES: Authors’ (FAO) own elaboration based on the application of the methodology in the Supplementary material to Chapter 4 S4.3 using amounts of flows in constant 2021 USD billion from OECD. 2024. OECD Data Explorer. [Accessed on 24 July 2024]. https://data-explorer.oecd.org/?fs[0]=T%2Co&pg=0&fc=Topic&bp=true&snb=580; William & Mary. 2024. AidData: Data. [Accessed on 24 July 2024]. https://www.aiddata.org/datasets
Flows broadly appear to target well the countries where hunger, food insecurity and malnutrition are more serious
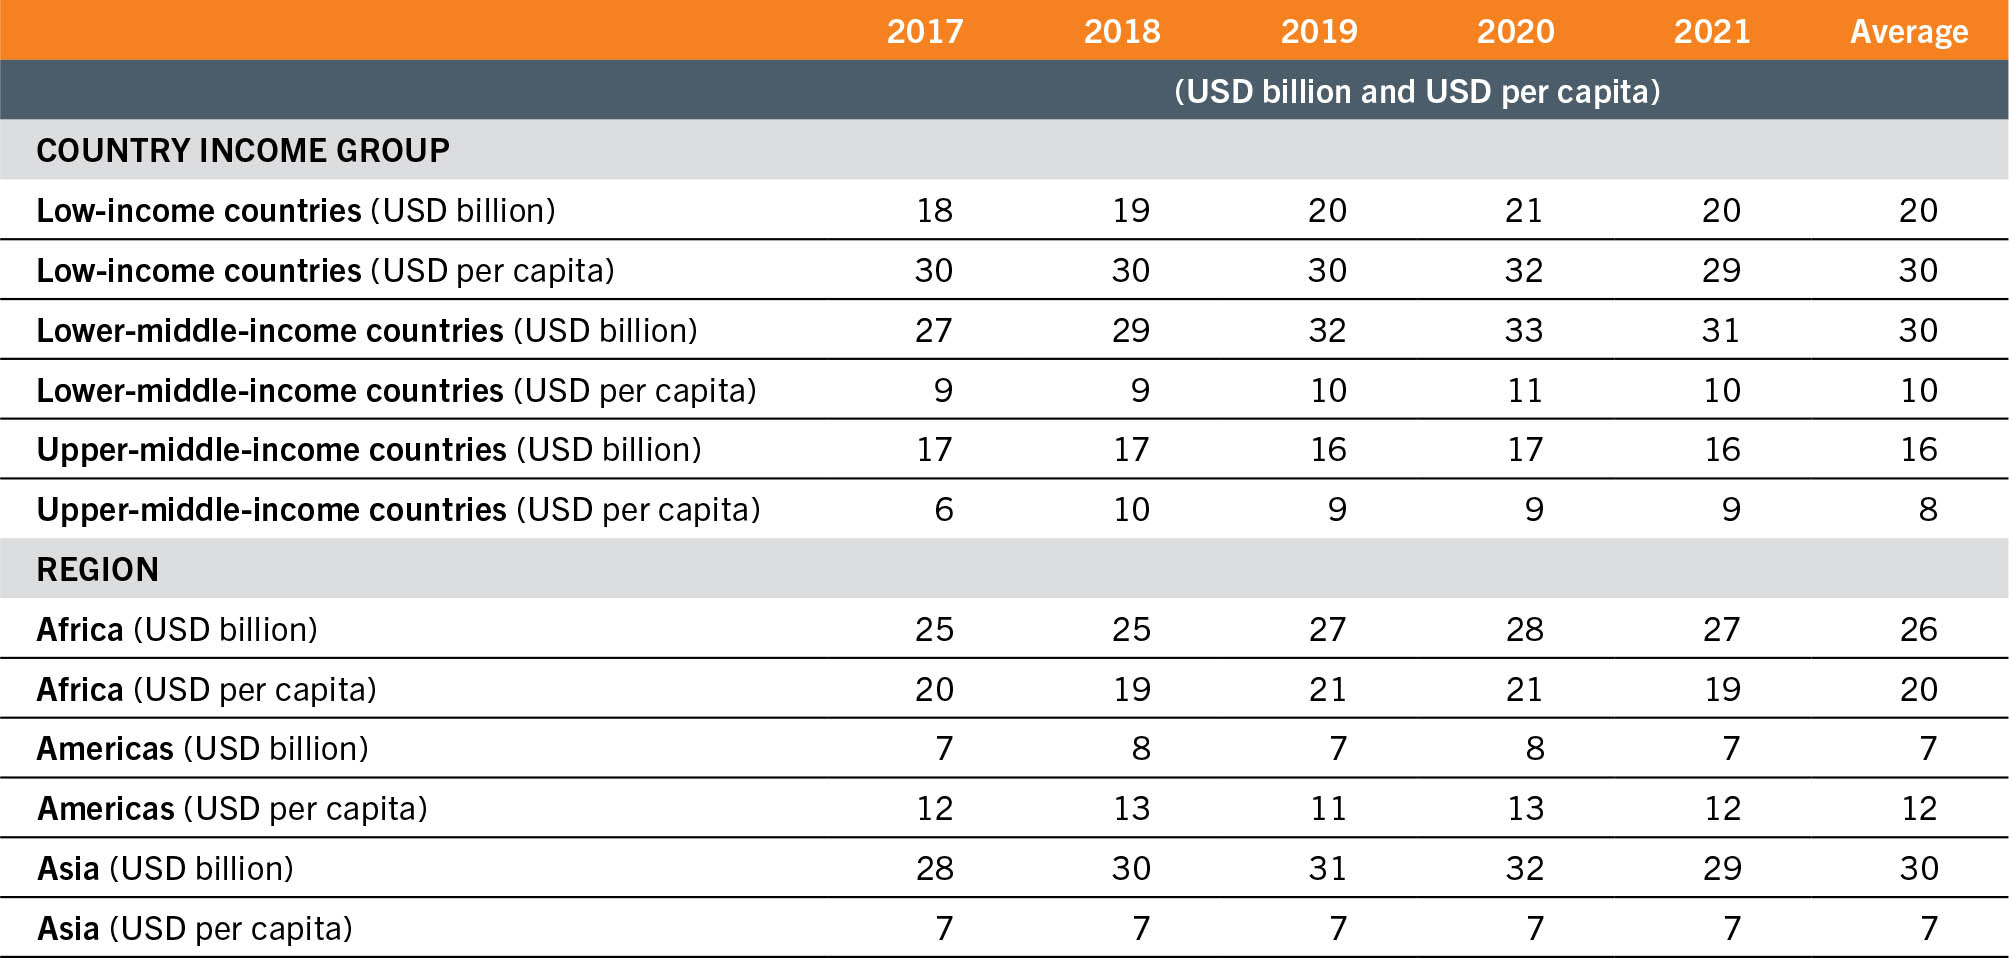
Global ODA and OOF flows for food security and nutrition broadly appear to target well the country groups and regions where hunger, food insecurity and malnutrition are higher. On a per capita basis, on average, over the period from 2017 to 2021, these flows amounted to USD 30 in LICs, compared with USD 10 in LMICs and USD 8 in UMICs (Table 13). Interestingly, due to population growth over this period and to a reduction in flows in 2021, ODA and OOF flows for food security and nutrition per person were lower in 2021 than in any other year during the same period in the case of LICs, while this is not observed for MICs. These flows also target chiefly Africa where, on a per capita basis between 2017 and 2021, on average, they amounted to USD 20, compared with USD 12 in the Americas and USD 7 in Asia – using the regional disaggregation allowed by the data (Table 13). Official development assistance and other official flows for food security and nutrition in absolute terms, from 2017 to 2021, overwhelmingly grew more for Africa across regions and for LMICs (rather than LICs) across income groups.
TABLE 13Destination of official development assistance and other official flows for food security and nutrition by recipient income group and region
SOURCES: Authors’ (FAO) own elaboration based on the application of the methodology in the Supplementary material to Chapter 4 S4.3 to data from OECD. 2024. OECD Data Explorer. [Accessed on 24 July 2024]. https://data-explorer.oecd.org/?fs[0]=T%2Co&pg=0&fc=Topic&bp=true&snb=580; William & Mary. 2024. AidData: Data. [Accessed on 24 July 2024]. https://www.aiddata.org/datasets
The private sector supports the financing of food security and nutrition, but proper accounting of private financing flows is not possible
There are several potential sources of private financing for food security and nutrition, both domestic and external, which were identified in Chapter 3 (Table 8). Unfortunately, it is not possible to track all global private sector financing for food security and nutrition to provide a single number for a given year.
Hence, in this section conclusions are drawn from incomplete data from different sources to detect patterns between global private finance and food security and nutrition. Under “private sector”, extremely distinct types of sources of financing that fall under two broad categories, non-commercial private financing and commercial private financing, are lumped together – following the methodology in the Supplementary material to Chapter 4 S4.4.
Non-commercial private financing
Non-commercial private financing comprises two main types of sources of financing, with some opposite characteristics. On the one hand, there are funds flowing from philanthropists; these amounts are comparatively modest (compared to international development assistance and public spending), but they are easy to analyse thanks to many of the main philanthropic foundations who report them in the CRS database.9 On the other hand, there are cross-border remittances from migrants;p these are much larger than the sums from international development assistance, but it is only possible to guestimate their contribution to food security and nutrition.
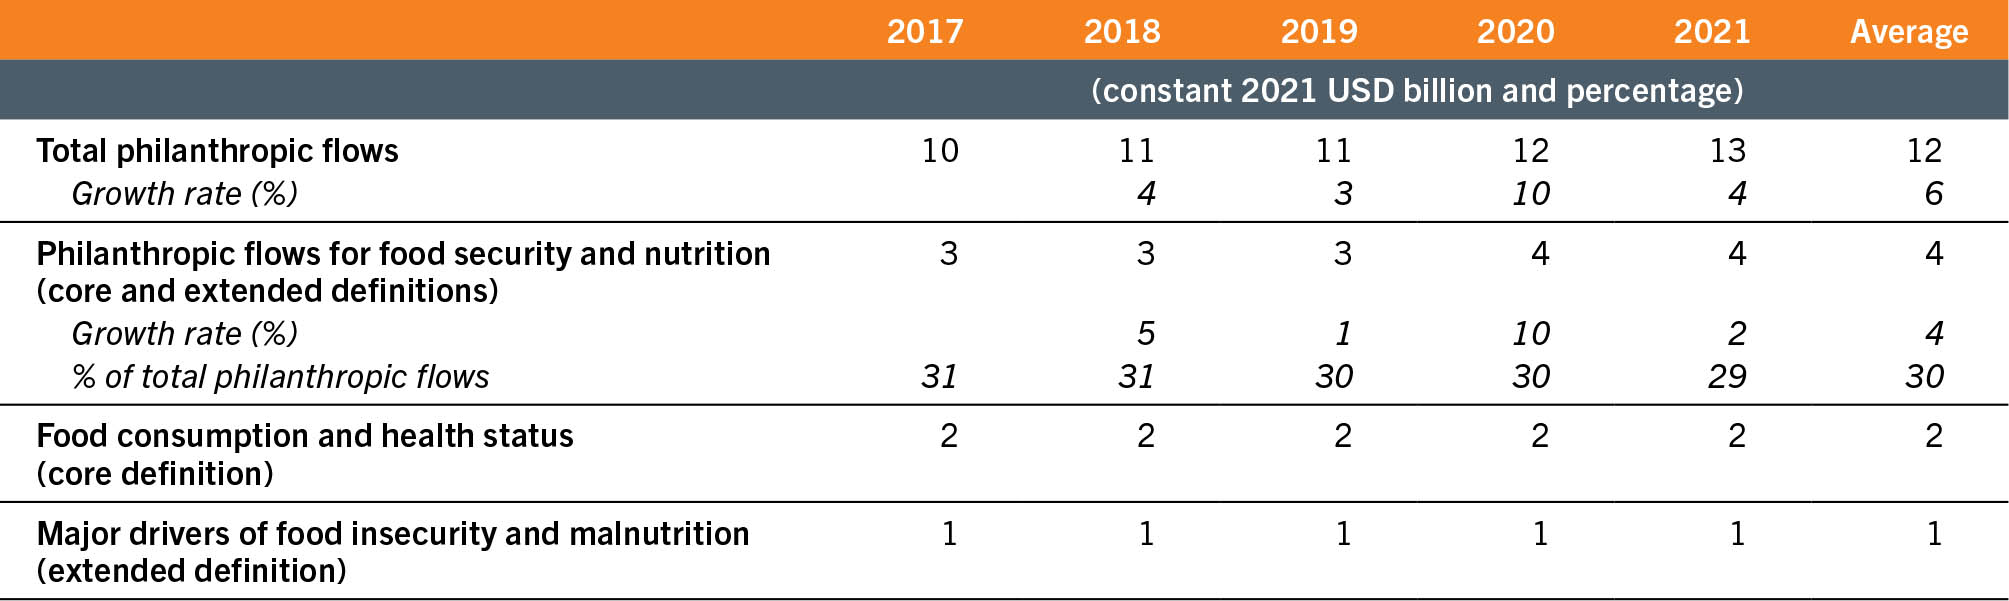
According to the CRS database,9 and after applying the core and extended definitions of financing for food security and nutrition (see Supplementary material to Chapter 4 S4.4 and S4.3, in this order), philanthropic flows to food security and nutrition amounted to only USD 4 billion per year on average between 2017 and 2021 and represented a stable share of 30 percent of all philanthropic flows. These flows increased by USD 1 billion from 2019 to 2020 but are nevertheless only a modest amount compared to other private flows. Two-thirds of philanthropic flows for food security and nutrition supported food consumption and health (as per the core definition), while the remaining third contributed to addressing the major drivers of food insecurity and malnutrition (Table 14).
TABLE 14Philanthropic flows to food security and nutrition
SOURCE: Authors’ (FAO) own elaboration based on the application of the methodology in the Supplementary material to Chapter 4 S4.3 to data from OECD. 2024. OECD Data Explorer. [Accessed on 24 July 2024]. https://data-explorer.oecd.org/?fs[0]=T%2Co&pg=0&fc=Topic&bp=true&snb=580
Drawing on data available from the World Bank and the Global Knowledge Partnership on Migration and Development (KNOMAD),11 cross-border remittances to LICs and MICs are estimated at USD 735 billion on average over the period from 2017 to 2022 (at current prices), with some growth every year except for a 1 percent drop in 2020. Of these flows, USD 344 billion (or nearly half) per year were allocated to uses that likely contributed to food security and nutrition over the same period (Table 15). Most of this sum (92 percent on average) was used for food consumption, while only the remaining small part financed investments in agriculture and other agrifood systems activities.
TABLE 15Growth and distribution of cross-border remittances that support food security and nutrition to low- and middle-income countries
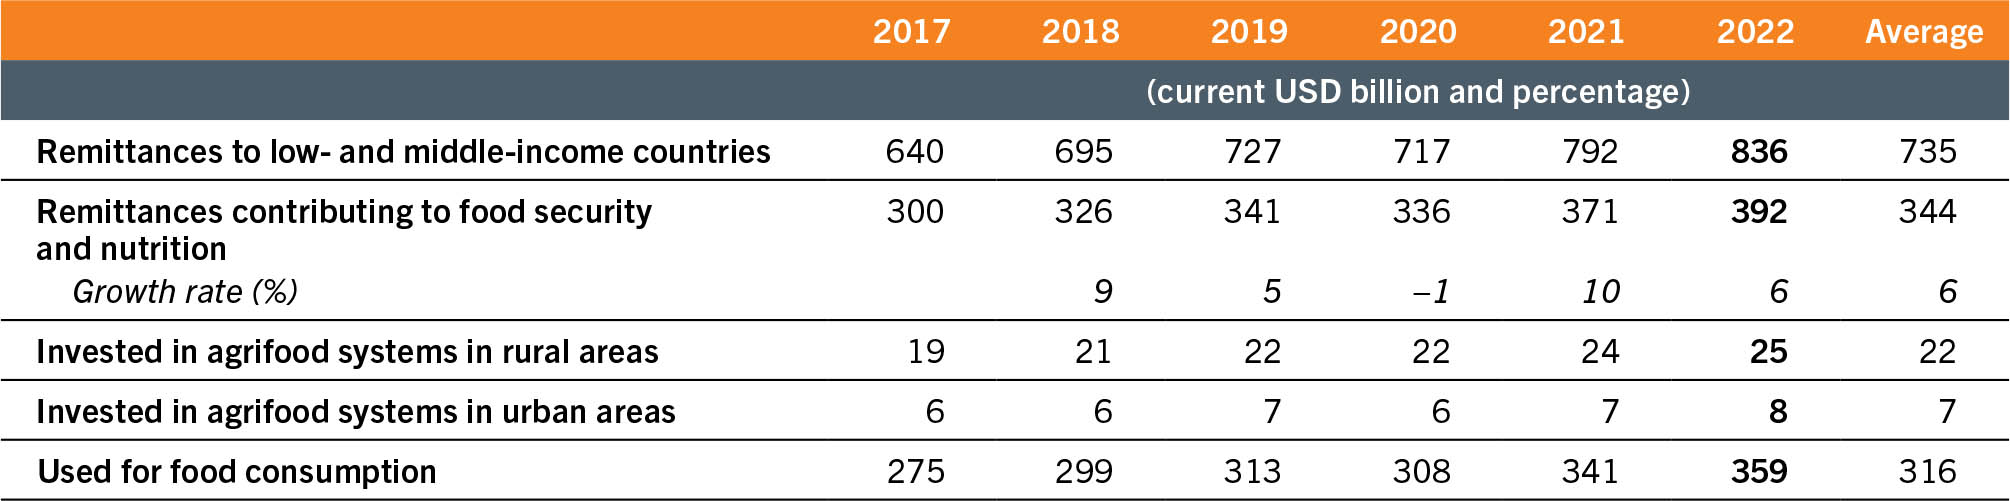
SOURCE: Authors’ (FAO) own elaboration based on Ratha, D., Chandra, V., Ju Kim, E., Plaza, S. & Shaw, W. 2023. Leveraging diaspora finances for private capital mobilization. Migration and Development Brief 39. Washington, DC, World Bank. https://www.knomad.org/sites/default/files/publication-doc/migration_development_brief_39_0.pdf
Commercial private financing
Two issues stand out when analysing commercial private financing for food security and nutrition. The first is the highly incomplete and fragmented access to data and the lack of information on the precise utilization of the funds. Comprehensive and relevant numbers on market finance (i.e. issuances of stocks and corporate bonds), international bank loans and domestic private equity could not be obtained to meaningfully arrive at a global number.
The second major issue is the difficulty of assessing whether these financing flows positively affect food security and, even more crucially, nutrition. This issue, which also exists for public spending on food and agriculture, is even more acute for the private sector. This is the case, particularly because the private sector may not necessarily be investing its resources in agrifood-related business in ways that always help reduce hunger, food insecurity and malnutrition. Large international food and beverage companies, for example, are often viewed as being part of food security and nutrition problems, rather than part of the solution to these problems (see Box 10).
BOX 10Some private investments can have negative impacts on Sustainable Development Goal 2
On food security, a recent study ran a meta-regression analysis of 24 studies that found little evidence for either negative or positive effects of foreign direct investment (FDI) on food security in developing countries, although it did suggest that the effect might be positive in the short term but negative in the long term.12
On nutrition, however, The Lancet, in its “Commercial determinants of health” series,13 observed in 2023 that a substantial group of commercial actors are escalating avoidable levels of ill health, planetary damage, and inequity – the commercial determinants of health. Similarly, a review of quantitative evidence conducted in 201914 found that FDI appears to be more clearly associated with increases in overweight, obesity and non-communicable disease prevalence than with changes in undernutrition. In addition, a network analysis revealed that many of the large players in the global food and beverage industries are at the centre of interest groups representing the “ultra-processed food” industry.15
Two recent studies in the British Medical Journal highlight that hundreds of epidemiological studies and meta-analyses have reported associations between “ultra-processed food” consumption and adverse health outcomes.16, 17 A review of 35 550 products manufactured by the global top 20 food and beverage companies (representing 22 percent of worldwide sales in the sector) in a few key countries including Brazil, China, India and South Africa found that the overwhelming majority were unhealthy according to the World Health Organization Regional Office for Europe nutrient profile model, with a small number of significant exceptions. In these four countries, healthier products accounted for just 4–12 percent of the 2020 sales of these companies.18
As far as environmental impacts are concerned, “ultra-processed foods” are associated with intensive agriculture and livestock and threaten all dimensions of agrifood systems sustainability due to the combination of low-cost ingredients at purchase and increased consumption worldwide.19 Similarly, “ultra-processed food” production and consumption have been found to have impacts on land degradation, herbicide use, eutrophication and packaging use.20
Among international commercial private financing flows, FDI is the flow type with the most comprehensive data source. According to United Nations Trade and Development (UNCTAD), between 2017 and 2022, FDI amounted to an average of USD 19 billon for “food and agriculture” (as defined in 2017–2019) or “agrifood systems” (as defined in 2020–2022), with a 44 percent drop in 2020 due to the COVID-19 pandemic and a rebound to 2019 levels in 2022 (Table 16). If one adds to this the FDIs in other sectors that can be regarded as supportive expenditure for food security and nutrition (as explained in the Supplementary material to Chapter 4 S4.1), one arrives at an additional USD 43 billon supportive of food security and nutrition on average over the period, with a 34 percent drop in 2020 mainly due to contractions in investment in transport services and infrastructure and, to a lesser extent, in the power sector during the pandemic, and a major jump of 112 percent in 2022 caused mainly by increased investment in renewable energy.
TABLE 16Foreign direct investment specific to food security and nutrition flowing to developing economies
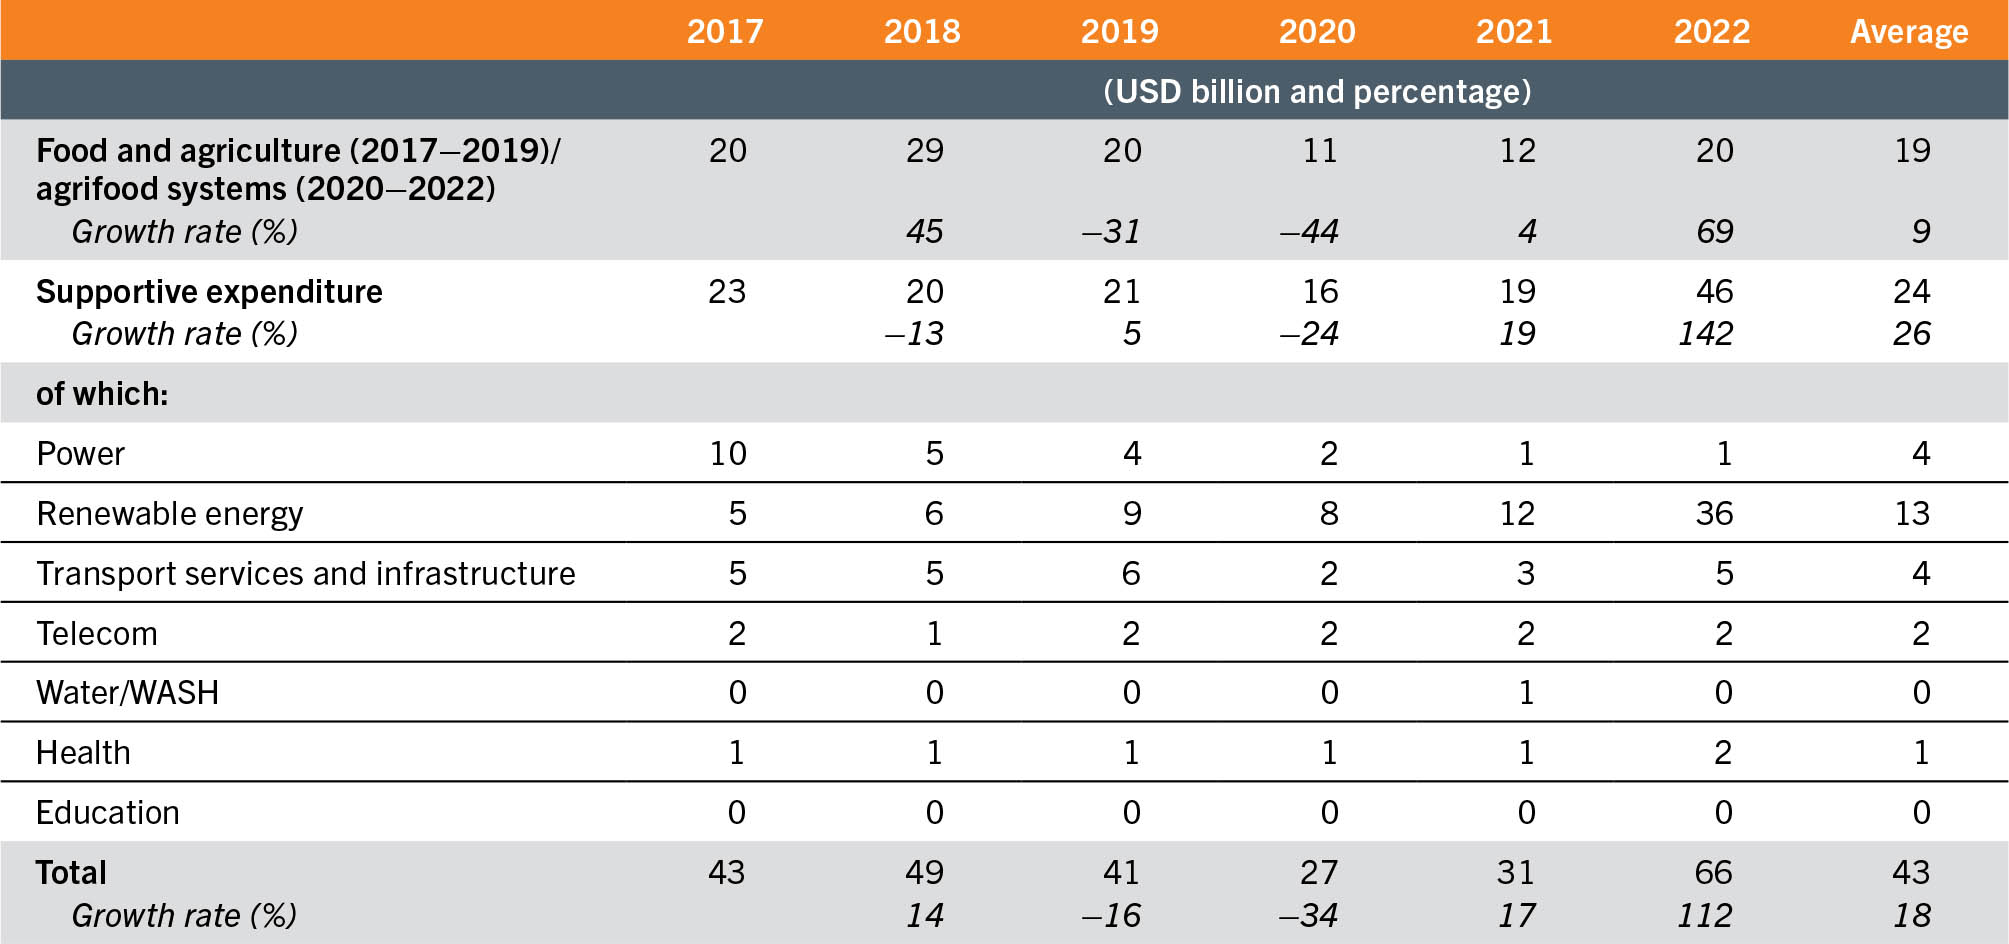
SOURCES: UNCTAD. 2020. World Investment Report 2020. International production beyond the pandemic. Geneva, Switzerland. https://unctad.org/system/files/official-document/wir2020_en.pdf; UNCTAD. 2023. World Investment Report 2023. Investing in sustainable energy for all. Geneva, Switzerland. https://unctad.org/publication/world-investment-report-2023
Blended financeq represents much more modest amounts, according to the limited data available. The 2023 edition of State of Blended Finance21 estimates that, on average over the period from 2020 to 2022, 26 percent of blended finance transactions, amounting to USD 1.2 billion per year, were “aligned” with SDG 2,r compared with 19 percent and USD 0.9 billion per year for the period from 2014 to 2019.22 Sustainable Development Goal 2 was in eighth position for 2020 to 2022 and in ninth for 2014 to 2019 in terms of its alignment with blended finance transactions.s To this, one might add numbers for “private indirect mobilization”t in LICs and MICs provided by the joint report of the multilateral development bank (MDB) Task Force on Mobilization of Private Finance. However, these numbers (USD 46 billion on average over 2017–2021 for all sectors) are broken down only into “infrastructures” and “non-infrastructures”, which is insufficient to assess their contribution to food security and nutrition.23
With regard to domestic commercial financing, FAOSTAT24 provides numbers for banking credit to agriculture in LICs, LMICs and UMICs. Net banking loans – according to this source – amount to an average of USD 10 billion between 2017 and 2021, and exhibit an almost continuous decline from USD 22 billion in 2017 to USD 2 billion in 2021 (Figure 28). While these numbers are small, one may assume that, based on ISF Advisors,25 they represent about three-quarters of the total financing available to “agri-SMEs”, at least in sub-Saharan Africa and Southeast Asia.u Furthermore, these numbers reveal a clear declining trend in net banking loans that could support food security and nutrition.
FIGURE 28 Net banking loans to agriculture, forestry and fishing show an almost continuous decline
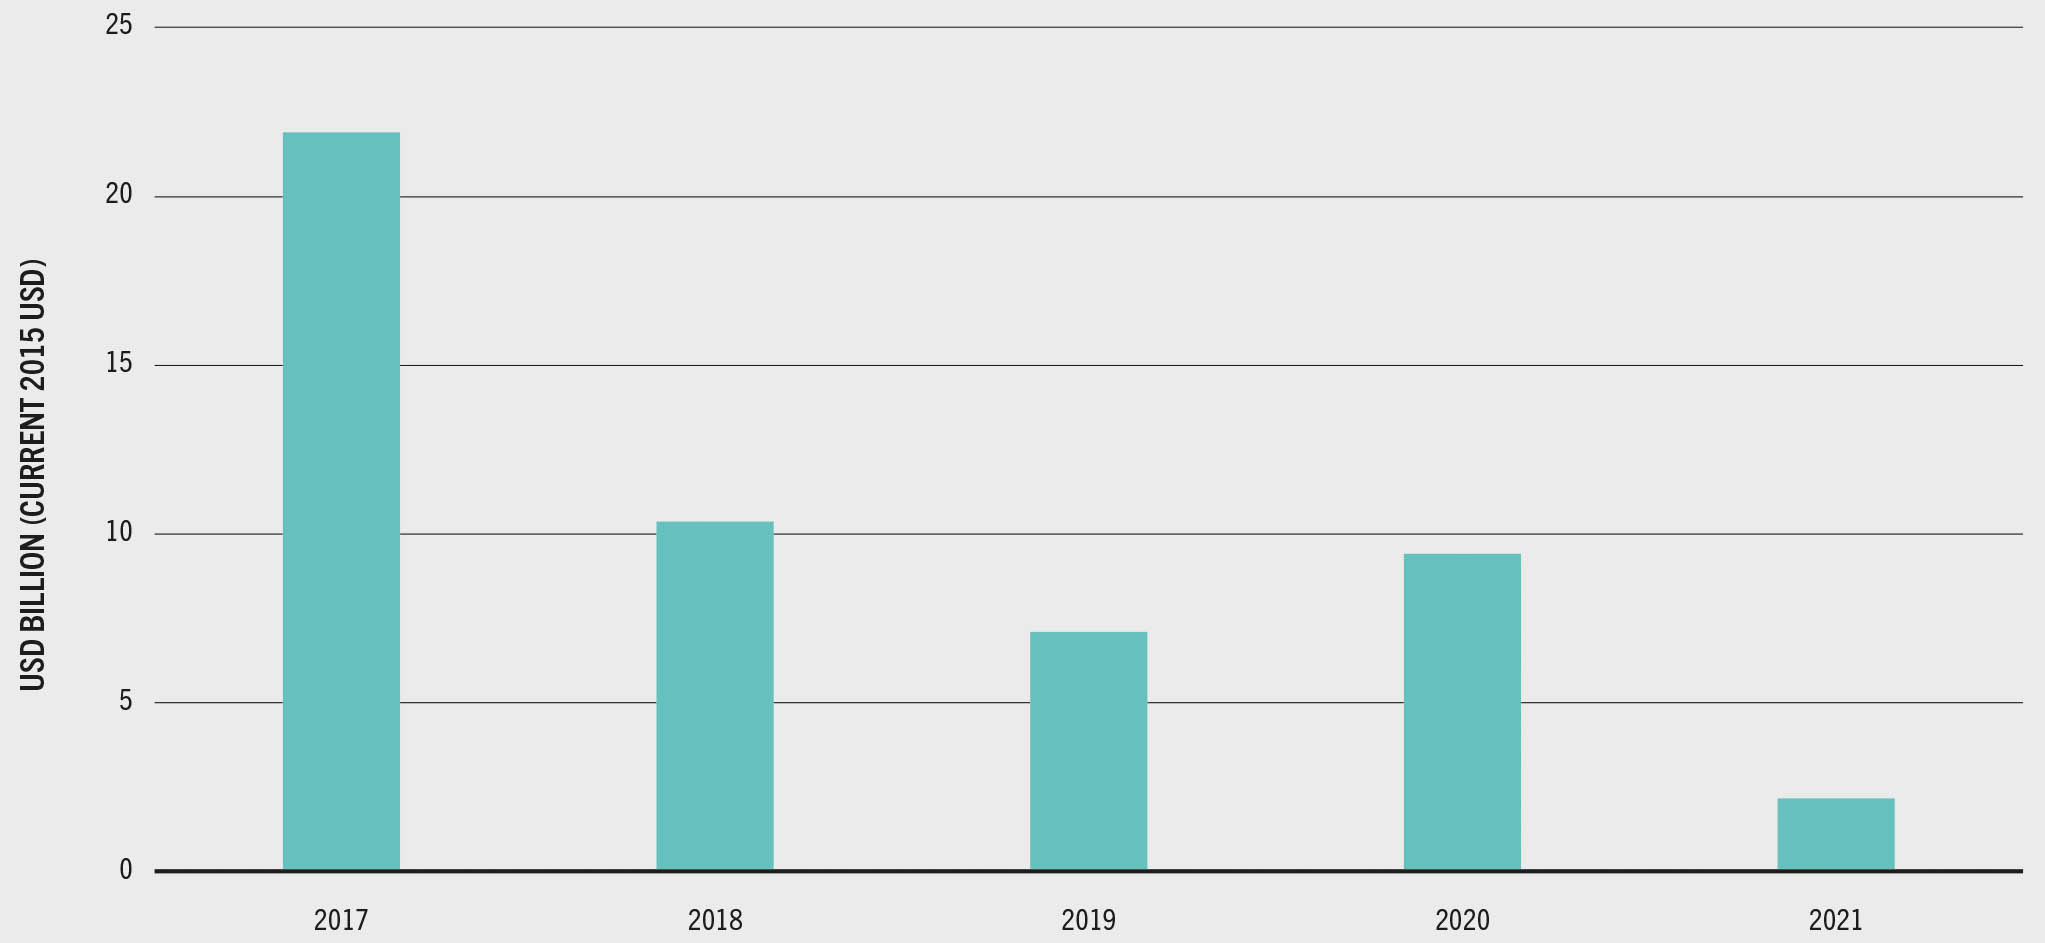
SOURCE: FAO. 2024. FAOSTAT: Credit to Agriculture. [Accessed on 24 July 2024]. https://www.fao.org/faostat/en/#data/IC. Licence: CC-BY-4.0.
Ultimately, the main source of financing for companies in sectors relevant to food security and nutrition, at least for farmers and small and medium enterprises (SMEs), appears to be self-financing. No data exist, however, on this self-financing. FAOSTAT26 provides data on capital stock in agriculture in LICs, LMICs and UMICs, from which net capital expenditure (USD 412 billion on average over 2017–2021, at constant 2015 prices) can be calculated. Self-financing could in theory be calculated by subtracting from the net capital expenditure the external financing that backs these investments, including the flows mentioned above (i.e. banking credits, cross-border remittances used for agricultural investments, domestic government subsidies to capital expenditure, and so forth). Although data on this external financing are too partial to allow for such an exercise, it is likely that the lion’s share of net capital expenditure in agriculture is being financed by farmers and SMEs themselves.


