


Prevalence of Undernourishment
Definition: Undernourishment is defined as the condition of an individual whose habitual food consumption is insufficient to provide, on average, the amount of dietary energy required to maintain a normal, active and healthy life.
How it is reported: The indicator (denominated as “prevalence of undernourishment” [PoU]) is an estimate of the percentage of individuals in the population that are in a condition of undernourishment. National estimates are reported as three-year moving averages, to control for the low reliability of some of the underlying parameters, such as the year-to-year variation in food commodity stocks, one of the components of the annual FAO Food Balance Sheets for which complete, reliable information is very scarce. Regional and global aggregates, on the other hand, are reported as annual estimates, on account of the fact that possible estimation errors are expected not to be correlated across countries.
Methodology: To compute an estimate of the prevalence of undernourishment in a population, the probability distribution of habitual dietary energy intake levels (expressed in kcal per person per day) for the average individual is modelled as a parametric probability density function (pdf), f(x).396,397 The indicator is obtained as the cumulative probability that the habitual dietary energy intake (x) is below the minimum dietary energy requirements (MDER) (i.e. the lowest limit of the range of energy requirements for the population’s representative average individual) as in the formula below:

where θ is a vector of parameters that characterizes the pdf. The distribution is assumed to be lognormal and thus fully characterized by only two parameters: the mean dietary energy consumption (DEC) and its coefficient of variation (CV).
Data source: Different data sources are used to estimate the different parameters of the model.
Minimum dietary energy requirement (MDER): Human energy requirements for an individual in a given sex/age class are determined on the basis of normative requirements for basic metabolic rate (BMR) per kilogram of body mass, multiplied by the ideal weights that a healthy person of that sex/age class may have, given his or her height, and then multiplied by a coefficient of physical activity level (PAL) to take into account physical activity.ao Given that both healthy BMIs and PALs vary among active and healthy individuals of the same sex and age, a range of energy requirements applies to each sex and age group of the population. The MDER for the average individual in the population, which is the parameter used in the PoU formula, is obtained as the weighted average of the lower bounds of the energy requirement ranges for each sex and age group, using the shares of the population in each sex and age group as weights. Similar to the MDER, the average dietary energy requirement (ADER) is estimated using the average values of the PAL category “Active or moderately active lifestyle”.
Information on the population structure by sex and age is available for most countries in the world and for each year from the UN Department of Economic and Social Affairs (DESA) Population Prospects, revised every two years. This edition of The State of Food Security and Nutrition in the World uses the 2019 revision of the World Population Prospects.398
Information on the median height in each sex and age group for a given country is derived from a recent demographic and health survey (DHS) or from other surveys that collect anthropometry data on children and adults. Even if such surveys do not refer to the same year for which the PoU is estimated, the impact of possible small intervening changes in median heights over the years on PoU estimates is expected to be negligible.
Dietary energy consumption (DEC): Ideally, data on food consumption should come from nationally representative household surveys (such as Living Standard Measurement Surveys or Household Incomes and Expenditure Surveys). However, only very few countries conduct such surveys on an annual basis. Thus, in FAO’s PoU estimates for global monitoring, DEC values are estimated from the dietary energy supply (DES) reported in the Food Balance Sheets (FBS), compiled by FAO for most countries in the world (see FAO, 2021).90
Since the last edition of this report, the new FBS domain on FAOSTAT has been updated up to 2019 for all countries. In addition, at the time of closing this report, the FBS series were updated for the following 63 countries that have the largest number of undernourished people, bringing them up to date through 2020: Afghanistan, Algeria, Angola, Bangladesh, Bolivia (Plurinational State of), Burkina Faso, Cambodia, Cameroon, Central African Republic, Chad, China (mainland), Colombia, Congo, Côte d’Ivoire, Democratic People’s Republic of Korea, Democratic Republic of the Congo, Ecuador, Eswatini, Ethiopia, Guatemala, Guinea, Haiti, Honduras, India, Indonesia, Iran (Islamic Republic of), Iraq, Kenya, Lao People’s Democratic Republic, Liberia, Madagascar, Malawi, Mali, Mexico, Mongolia, Mozambique, Myanmar, Nepal, Niger, Nigeria, Pakistan, Papua New Guinea, Peru, Philippines, Rwanda, Senegal, Sierra Leone, Somalia, South Africa, Sri Lanka, Sudan, Syrian Arab Republic, Tajikistan, Thailand, Togo, Uganda, United Republic of Tanzania, Uzbekistan, Venezuela (Bolivarian Republic of), Viet Nam, Yemen, Zambia and Zimbabwe.
Estimates for the per capita average DES in 2020 (for countries other than the 63 countries listed above) and in 2021 (for all countries), compiled on the basis of the short-run market outlook exercises conducted by FAO to inform the World Food Situation,5 are used to nowcast the 2020 and 2021 values of DEC for each country, starting from the last available year in the FBS series.
Coefficient of variation (CV): When reliable data on food consumption are available from nationally representative household surveys, the CV due to income (CV|y) can be estimated directly. Since the last edition of this report, 18 new surveys from the following 15 countries have been processed to update the CV|y: Côte d’Ivoire (2018), Ethiopia (2019), Iraq (2018), Kyrgyzstan (2018), Malawi (2019), Mali (2018), Myanmar (2017), Niger (2018), Philippines (2018), Senegal (2018), Sri Lanka (2016, 2019), Togo (2018), Uganda (2018), United Republic of Tanzania (2001, 2007, 2017) and Vanuatu (2019). That makes for a total of 118 surveys from 60 countries for which the estimate of CV|y is based on data from surveys.
When no suitable survey data are available, FIES data collected by FAO since 2014 are used to project the changes in the CV|y from 2015 (or from the year of the last food consumption survey, if more recent) up to 2019, based on a smoothed (three-year moving average) trend in severe food insecurity. The estimates are based on the assumption that recent changes in the extent of severe food insecurity measured with the FIES might closely reflect unobserved changes in the PoU. To the extent that such changes in PoU cannot be fully explained by the effect of the observed or estimated changes in average food supplies, they can thus be attributed to likely unobserved changes in the CV|y that might have occurred in the most recent year. Analysis of historic PoU estimates reveals that, on average, and once differences in DEC and MDER have been controlled for, differences in the CV|y explain about one-third of the differences in PoU across time and space. Therefore, for each country for which FIES data are available, the change in the CV|y that may have occurred from 2015, or from the date of the last available survey, is estimated as the change that would generate one-third of a percentage point change in the PoU for each observed percentage point change in the prevalence of severe food insecurity. For all other countries, the CV|y is kept constant at the estimated 2017 value. As in last year’s report, the nowcast of the CV|y for 2020 and 2021 – the years when access to food was heavily conditioned by the effects of the COVID-19 pandemic – required special treatment (see Annex 2A).
In the FAO PoU parametric approach, the CV due to differences in body weight and lifestyle, a.k.a. CV due to requirement (CV|r), represents the variability of the distribution of dietary energy requirements of a hypothetical average individual representative of a healthy population, which is also equal to the CV of the distribution of dietary energy intakes of a hypothetical average individual if everyone in the population were perfectly nourished. The distribution of dietary energy requirements of such a hypothetical average individual is assumed to be normal, and therefore its standard deviation can be estimated from any two known percentiles. We use the MDER and the average dietary energy requirement (ADER) mentioned above to approximate the 1st and the 50th percentiles.399,400 The value of CV|r is then derived as the inverse cumulative standard normal distribution of the difference between the MDER and the ADER.
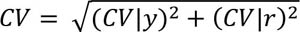
The total CV is then obtained as the geometric mean of the CV|y and the CV|r:
Challenges and limitations: While formally the state of being undernourished or not is a condition that applies to individuals, given the data usually available on a large scale, it is impossible to reliably identify which individuals in a certain group are actually undernourished. Through the statistical model described above, the indicator can only be computed with reference to a population or a group of individuals for which a representative sample is available. The prevalence of undernourishment is thus an estimate of the percentage of individuals in that group that are in such condition, and it cannot be further disaggregated.
Due to the probabilistic nature of the inference and the margins of uncertainty associated with estimates of each of the parameters in the model, the precision of the PoU estimates is generally low. While it is not possible to formally compute margins of error around PoU estimates, they are expected to likely exceed 5 percent in most cases. For this reason, FAO does not consider PoU estimates that result to be lower than 2.5 percent as sufficiently reliable to be reported.
References:
FAO. 1996. Methodology for assessing food inadequacy in developing countries. In FAO. The Sixth World Food Survey, pp. 114–143. Rome.
FAO. 2003. Proceedings: Measurement and Assessment of Food Deprivation and Undernutrition: International Scientific Symposium. Rome.
FAO. 2014. Advances in hunger measurement: traditional FAO methods and recent innovations. FAO Statistics Division Working Paper No. 14–04. Rome.
Naiken, L. 2002. Keynote paper: FAO methodology for estimating the prevalence of undernourishment. Paper presented at the Measurement and Assessment of Food Deprivation and Undernutrition International Scientific Symposium, Rome, 26–28 June 2002. Rome, FAO.
Wanner, N., Cafiero, C., Troubat, N. & Conforti, P. 2014. Refinements to the FAO methodology for estimating the prevalence of undernourishment indicator. Rome, FAO.
Prevalence OF Food insecurity as measured by the Food Insecurity Experience Scale (FIES)
Definition: Food insecurity as measured by this indicator refers to limited access to food, at the level of individuals or households, due to lack of money or other resources. The severity of food insecurity is measured using data collected with the Food Insecurity Experience Scale survey module (FIES-SM), a set of eight questions asking respondents to self-report conditions and experiences typically associated with limited access to food. For purposes of annual SDG monitoring, the questions are asked with reference to the 12 months preceding the survey.
Using sophisticated statistical techniques based on the Rasch measurement model, the information obtained in a survey is validated for internal consistency and converted into a quantitative measure along a scale of severity, ranging from low to high. Based on their responses to the FIES-SM items, the individuals or households interviewed in a nationally representative survey of the population are assigned a probability of being in one of three classes: i) food secure or only marginally insecure; ii) moderately food insecure; and iii) severely food insecure, as defined by two globally set thresholds. Based on FIES data collected over three years from 2014 to 2016, FAO has established the FIES reference scale, which is used as the global standard for experience-based food-insecurity measures, and to set the two reference thresholds of severity.
SDG Indicator 2.1.2 is obtained as the cumulated probability to be in the two classes of moderate and severe food insecurity. A separate indicator (FIsev) is computed by considering only the severe food insecurity class.
How it is reported: In this report, FAO provides estimates of food insecurity at two different levels of severity: moderate or severe food insecurity (FImod+sev) and severe food insecurity (FIsev). For each of these two levels, two estimates are reported:
- the prevalence (percent) of individuals in the population living in households where at least one adult was found to be food insecure; and
- the estimated number of individuals in the population living in households where at least one adult was found to be food insecure.
Data source: Since 2014, the eight-question FIES survey module has been applied in nationally representative samples of the adult population (defined as aged 15 or older) in more than 140 countries included in the Gallup© World Poll (GWP), covering more than 90 percent of the world population. In 2021, interviews were conducted by both telephone and face-to-face modalities. Telephone interviews were maintained in some countries already covered with this modality in 2020 given the high risk of community transmission from conducting face-to-face data collection during the COVID-19 pandemic. By evaluating Dual Frame coverage (i.e. the proportion of the adult population that is covered by a combination of landline and mobile phones), countries with a minimum of 70 percent coverage were included as part of the 2020 World Poll though Computer Assisted Telephone Interviewing (CATI).
Gallup traditionally uses telephone surveys in Northern America, Western Europe, some parts of Asia, and Gulf Cooperation Council (GCC) countries. In Central and Eastern Europe, much of Latin America, nearly all of Asia, the Near East and Africa, an area frame design is used for face-to-face interviewing.
In most countries, samples include about 1 000 individuals, with larger samples of 3 000 individuals in India, 3 500 in China (mainland) and 2 000 in the Russian Federation.
In addition to the GWP, in 2021 FAO collected data in 20 countries through Geopoll® and Kantar® with the specific objective of filling data gaps on access to food. The countries covered were: Antigua and Barbuda, Bahamas, Barbados, Comoros, Democratic Republic of the Congo, Djibouti, Dominica, Eswatini, Guinea-Bissau, Haiti, Lao People’s Democratic Republic, Madagascar, Maldives, Niger, Rwanda, Saint Kitts and Nevis, Sao Tome and Principe, Suriname, Trinidad and Tobago, and Zambia.
For Afghanistan, Angola, Armenia, Belize, Benin, Botswana, Burkina Faso, Cabo Verde, Canada, Chad, Chile, Costa Rica, Côte d’Ivoire, Dominican Republic, Ecuador, Fiji, Ghana, Greece, Grenada, Guinea-Bissau, Honduras, Indonesia, Israel, Kazakhstan, Kenya, Kiribati, Kyrgyzstan, Lesotho, Malawi, Mexico, Namibia, Niger, Nigeria, Pakistan, Palestine, Paraguay, Philippines, Republic of Korea, Russian Federation, Saint Kitts and Nevis, Saint Lucia, Saint Vincent and the Grenadines, Samoa, Senegal, Seychelles, Sierra Leone, South Africa, South Sudan, Sri Lanka, Sudan, Togo, Tonga, Uganda, United Arab Emirates, United Republic of Tanzania, United States of America, Vanuatu, Viet Nam and Zambia, national government survey data were used to calculate the prevalence estimates of food insecurity by applying FAO’s statistical methods to adjust national results to the same global reference standard, covering more than a quarter of the world population. Countries are considered for the year or years when national data are available. For the remaining years, the following strategy was followed:
- When more than one year of national data is available, the missing years are linearly interpolated.
- If only one year of data is available, missing years are informed as follows:
- –using FAO data if considered compatible with the national surveys;
- –imputed using the trend suggested by FAO data if national data are not compatible;
- –imputed using the trend of the subregion if no other information is available; and
- –considered constant to the level of the national survey if the subregion cannot be computed or the trend of other surveys or the subregion is not applicable to the country-specific situation considering evidence found in support of the trend (for instance, evolution of poverty, extreme poverty, employment and food inflation, among others).
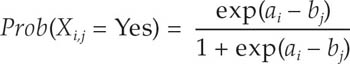
Methodology: The data were validated and used to construct a scale of food-insecurity severity using the Rasch model, which postulates that the probability of observing an affirmative answer by respondent i to question j is a logistic function of the distance, on an underlying scale of severity, between the position of the respondent, ai, and that of the item, bj.
By applying the Rasch model to the FIES data, it is possible to estimate the probability of being food insecure (pi,L) at each level of severity of food insecurity L (moderate or severe, or severe), for each respondent i, with 0 < p i,L < 1.
The prevalence of food insecurity at each level of severity (FIL) in the population is computed as the weighted sum of the probability of being food insecure for all respondents (i) in a sample:
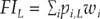
where wi are post-stratification weights that indicate the proportion of individuals or households in the national population represented by each record in the sample.
As only individuals aged 15 years or more are sampled in the GWP, the prevalence estimates directly produced from these data refer to the population aged 15 years and older. To arrive at the prevalence and number of individuals (of all ages) in the population, an estimate is required of the number of people living in the households where at least one adult is estimated to be food insecure. This involves a multistep procedure detailed in Annex II of the Voices of the Hungry Technical Report (see link in the “References” section, below).
Regional and global aggregates of food insecurity at moderate or severe, and severe levels, FIL,r, are computed as:
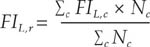
where r indicates the region, FI L,c is the value of FI at level L estimated for country c in the region, and Nc is the corresponding population size. When no estimate of FIL is available for a country, it is assumed to be equal to the population-weighted average of the estimated values of the remaining countries in the same region. A regional aggregate is produced only if the countries for which an estimate is available cover at least 50 percent of the region’s population.
Universal thresholds are defined on the FIES global standard scale (a set of item parameter values based on results from all countries covered by the GWP in 2014–2016) and converted into corresponding values on local scales. The process of calibrating each country’s scale against the FIES global standard can be referred to as equating and permits the production of internationally comparable measures of food insecurity severity for individual respondents, as well as comparable national prevalence rates.
The problem stems from the fact that, when defined as a latent trait, the severity of food insecurity has no absolute reference against which it could be evaluated. The Rasch model enables identification of the relative position that the various items occupy on a scale that is denominated in logit units but whose “zero” is arbitrarily set, usually to correspond to the mean estimated severity. This implies that the zero of the scale changes in each application. To produce comparable measures over time and across different populations requires establishing a common scale to use as a reference and finding the formula needed to convert measures across different scales. As is the case for converting measures of temperature across difference measuring scales (such as Celsius and Fahrenheit), this requires the identification of a number of “anchoring” points. In the FIES methodology, these anchoring points are the severity levels associated with the items whose relative position on the scale of severity can be considered equal to that of the corresponding items on the global reference scale. The “mapping” of the measures from one scale to the other is then obtained by finding the formula that equates the mean and the standard deviations (SD) of the common items’ severity levels.
Challenges and limitations: When food-insecurity prevalence estimates are based on FIES data collected in the GWP, with national sample sizes of about 1 000 in most countries, confidence intervals rarely exceed 20 percent of the measured prevalence (that is, prevalence rates of 50 percent would have margins of error of up to plus or minus 5 percent). Confidence intervals are likely to be much smaller, however, when national prevalence rates are estimated using larger samples and for estimates referring to aggregates of several countries. To reduce the impact of year-to-year sampling variability, country-level estimates are presented as three-year averages, computed as averages of all available years in the considered triennia.
References:
Gallup. 2020. Gallup Keeps Listening to the World Amid the Pandemic. In: Gallup. Cited 25 May 2021. https://news.gallup.com/opinion/gallup/316016/gallup-keeps-listening-world-amid-pandemic.aspx
FAO. 2016. Methods for estimating comparable rates of food insecurity experienced by adults throughout the world. Rome. www.fao.org/3/a-i4830e.pdf
FAO. 2018. Voices of the Hungry. In: FAO. Rome. Cited 28 April 2020. www.fao.org/in-action/voices-of-the-hungry
Stunting, wasting and overweight in children under 5 years of age
Definition of stunting (children under 5 years of age): Height/length (cm) for age (months) < -2 SD of the WHO Child Growth Standards median. Low height-for-age is an indicator that reflects the cumulative effects of undernutrition and infections since and even before birth. It may be the result of long-term nutritional deprivation, recurrent infections and lack of water and sanitation infrastructures.
How it is reported: The percentage of children aged 0–59 months who are below -2 SD from the median height-for-age of the WHO Child Growth Standards.
Definition of wasting: Weight (kg) for height/length (cm) < -2 SD of the WHO Child Growth Standards median. Low weight-for-height is an indicator of acute weight loss or a failure to gain weight and can be a consequence of insufficient food intake and/or an incidence of infectious diseases, especially diarrhoea.
How it is reported: The percentage of children aged 0–59 months who are below -2 SD from the median weight-for-height of the WHO Child Growth Standards.
Definition of overweight: Weight (kg) for height/length (cm) > +2 SD of the WHO Child Growth Standards median. This indicator reflects excessive weight gain for height generally due to energy intakes exceeding children’s energy requirements.
How it is reported: The percentage of children aged 0–59 months who are above +2 SD from the median weight-for-height of the WHO Child Growth Standards.
Data source: UNICEF, WHO & World Bank. 2021. UNICEF-WHO-World Bank: Joint child malnutrition estimates - Levels and trends (2021 edition). Cited 6 April 2022. https://data.unicef.org/resources/jme-report-2021, www.who.int/data/gho/data/themes/topics/joint-child-malnutrition-estimates-unicef-who-wb, https://datatopics.worldbank.org/child-malnutrition
Methodology:
Country-level estimates
The UNICEF/WHO-World Bank Group Joint Child Malnutrition Estimates (JME) country dataset
The UNICEF/WHO-World Bank Group JME dataset of country estimates requires the collection of national data sources that contain information on child malnutrition – specifically, data on the height, weight and age of children under 5, which can be used to generate national level prevalence estimates for stunting, wasting and overweight. These national-level data sources are mainly comprised of household surveys (e.g. Multiple Indicator Cluster Surveys, Demographic and Health Surveys). Some administrative data sources (e.g. from surveillance systems) are also included where population coverage is high. As of the latest review closure on 31 January 2021, the primary source dataset contained 997 data sources from 157 countries and territories, with nearly 80 percent of children living in countries with at least one data point within the past five years on stunting, wasting and overweight. This suggests that the global estimates are highly representative of the majority of children across the globe for the most recent period. The dataset contains the point estimate (and where available, the standard error), the 95 percent confidence bounds and the unweighted sample size. Where microdata are available, the JME uses estimates that have been recalculated to adhere to the global standard definition. Where microdata are not available, reported estimates are used, except in cases where adjustments are required to standardize for: i) use of an alternate growth reference from the 2006 WHO Growth Standards; ii) age ranges that do not include the full 0–59-month age group; and iii) data sources that were only nationally representative for populations residing in rural areas. Further details related to data source compilation, re-analysis of microdata, and data source review are described elsewhere.401
The JME country dataset serves different purposes for different indicators. For wasting, the JME country dataset serves as the country estimates themselves (i.e. the wasting prevalence in the JME country dataset from a household survey for a country in a given year is the wasting prevalence reported for that country in that year). For stunting and overweight, the JME country dataset is used to generate country-modelled estimates which serve as the official JME estimates (i.e. the stunting prevalence from a household survey for a given country in a given year is not reported as the prevalence for that country in that year; rather, it feeds into the modelled estimates described in the next section below).
Country-level model for stunting and overweight estimates
The technical details of the statistical models are provided elsewhere.401 Briefly, for both stunting and overweight, prevalence was modelled at logit (log-odds) scale using a penalized longitudinal mixed-model with a heterogeneous error term. The quality of the models was quantified with model-fit criteria that balance the complexity of the model with the closeness of the fit to the observed data. The proposed method has important characteristics, including non-linear time trends, regional trends, country-specific trends, covariate data and a heterogeneous error term. All countries with data contribute to estimates of the overall time trend and the impact of covariate data on prevalence. For overweight, the covariate data consisted of linear and quadratic socio-demographic index (SDI),ap and data source type. The same covariates were used for stunting, plus an additional covariate of the average health system access over the previous five years.
Annual country-level modelled estimates from 2000 to 2020aq on stunting and overweight were disseminated by the JME in 2021 for 155 countries with at least one data point (e.g. from a household survey) included in the JME country dataset described above. Modelled country estimates were also produced for an additional 49 countries, used solely for generation of regional and global aggregates. Modelled estimates for these 49 countries are not shown because they did not have any household surveys in the JME country dataset or because the modelled estimates remained pending final review at the time of publication. The results for the 204 countries can be used to calculate estimates and uncertainty intervals for any group of countries aggregated. The uncertainty intervals are important in monitoring trends, especially for countries with sparse data and where primary data sources present large primary data source sampling errors. When only sparse data are available in the most recent period, the inclusion of a survey can affect a substantial change in the predicted trajectory. For this reason, uncertainty intervals are needed to enhance trend interpretability in terms of the caution level employed. The uncertainty intervals for the new JME method have been tested and validated with various data types.
Regional and global estimates
Regional and global wasting estimates are only presented for the most recent year, 2020, unlike stunting and overweight estimates for which an annual time series is available from 2000 to 2020.ar This is because the JME are based on national-level country prevalence data, which come from cross-sectional surveys (i.e. a snapshot at one point in time) that are collected infrequently (every three to five years) in most countries. Since stunting and overweight are relatively stable over the course of a calendar year, it is reasonable to track changes in these two conditions over time with these data, whereas wasting is an acute condition that can change frequently and rapidly. An individual child can be affected by wasting more than once in a calendar year (i.e. can recover but then become wasted again in the same year), and the risk of wasting in many contexts can be driven by seasonal variations, which can result in seasonal spikes in prevalence. For example, wasting prevalence, in some contexts, may double between the post-harvest season (often associated with higher food availability and weather patterns that are less likely to cause disease) and the pre-harvest season (often associated with food shortages, heavy rains and related diseases that can affect nutrition status). Given that country surveys can be collected during any season, the prevalence estimate from any survey may be at a high or a low; or it may fall somewhere in between if data collection spanned across several seasons. Thus, the prevalence of wasting captures the situation of wasting at a specific point in time and not over an entire year. Variations in seasons across surveys make it difficult to draw inferences on trends. The lack of methods to account for seasonality and incident cases of wasting are the main reasons why the JME does not present annual trends for this form of malnutrition.
Generation of regional and global estimates
Different methods were applied to generate regional and global estimates for stunting and overweight compared to wasting, as described below. In short, results from the new country-level model were used to generate the regional and global estimates for stunting and overweight, while the JME subregional multilevel model was used to generate the global and regional estimates for wasting.
Stunting and overweight
Global and regional estimates for all years from 2000 to 2020as were derived as the respective country averages weighted by the countries’ under-five population from the United Nations World Population Prospects, 2019 revision,398 using model-based estimates for 204 countries. This includes 155 countries with national data sources (e.g. household surveys) included in the JME country dataset described above. It also includes 49 countries with modelled estimates generated for development of regional and global aggregates but for which country modelled estimates are not shown because they did not have any household surveys in the JME country dataset or because the modelled estimates remained pending final review at the time of publication. Confidence intervals were generated based on bootstrapping methodology.
Wasting
The wasting prevalence data from national data sources described in the above section about the JME country dataset were used to generate the regional and global estimates for the year 2020at using the JME subregional multilevel model, applying population weights for children under 5 years of age from the United Nations World Population Prospects, 2019 revision.398
Challenges and limitations: The recommended periodicity for countries to report on stunting, overweight and wasting is every three to five years; however, for some countries, data are available less frequently. While every effort has been made to maximize the comparability of statistics across countries and over time, country data may differ in terms of data collection methods, population coverage and estimation methods used. Survey estimates come with levels of uncertainty due to both sampling errors and non-sampling errors (technical measurement errors, recording errors, etc.). Neither of the two sources of error has been fully taken into account for deriving estimates at the country or regional and global levels.
For the prevalence of wasting, as surveys are generally carried out during a specific period of the year, the estimates can be affected by seasonality. Seasonal factors related to wasting include food availability (e.g. pre-harvest periods) and disease (rainy season and diarrhoea, malaria, etc.), while natural disasters and conflicts can also show real shifts in trends that would need to be treated differently than a seasonal variation. Hence, country year estimates for wasting may not necessarily be comparable over time. Consequently, only estimates from the most recent year (2020)au are provided.
References:
de Onis, M., Blössner, M., Borghi, E., Morris, R. & Frongillo, E.A. 2004. Methodology for estimating regional and global trends of child malnutrition. International Journal of Epidemiology, 33(6): 1260–1270. https://doi.org/10.1093/ije/dyh202
GBD 2019 Risk Factors Collaborators. 2020. Global burden of 87 risk factors in 204 countries and territories, 1990–2019: a systematic analysis for the Global Burden of Disease Study 2019. The Lancet, 396(10258): 1223–1249. https://doi.org/10.1016/s0140-6736(20)30752-2
UNICEF, WHO & World Bank. 2021. UNICEF-WHO-World Bank: Joint child malnutrition estimates - Levels and trends (2021 edition). Cited 6 April 2022. https://data.unicef.org/resources/jme-report-2021, www.who.int/data/gho/data/themes/topics/joint-child-malnutrition-estimates-unicef-who-wb, https://datatopics.worldbank.org/child-malnutrition
UNICEF, WHO & World Bank. 2021. Technical notes from the background document for country consultations on the 2021 edition of the UNICEF-WHO-World Bank Joint Malnutrition Estimates. SDG Indicators 2.2.1 on stunting, 2.2.2a on wasting and 2.2.2b on overweight. New York, USA, UNICEF. data.unicef.org/resources/jme-2021-country-consultations
WHO. 2014. Comprehensive Implementation Plan on maternal, infant and young child nutrition. Geneva, Switzerland. www.who.int/nutrition/publications/CIP_document/en
WHO. 2019. Nutrition Landscape Information System (NLIS) country profile indicators: interpretation guide. Geneva, Switzerland. www.who.int/publications/i/item/9789241516952
Exclusive breastfeeding
Definition: Exclusive breastfeeding (EBF) for infants <6 months of age is defined as receiving only breastmilk and no additional food or drink, not even water. Exclusive breastfeeding is a cornerstone of child survival and is the best food for newborns, as breastmilk shapes the baby’s microbiome, strengthens the immune system and reduces the risk of developing chronic diseases.
Breastfeeding also benefits mothers by preventing postpartum haemorrhage and promoting uterine involution, decreasing risk of iron-deficiency anaemia, reducing the risk of various types of cancer and providing psychological benefits.
How it is reported: Percentage of infants aged 0–5 months who are fed exclusively on breastmilk with no additional food or drink, not even water, in the 24 hours preceding the survey.402
Data source: UNICEF. 2021. Infant and young child feeding. In: UNICEF. New York, USA. Cited 6 April 2022. data.unicef.org/topic/nutrition/infant-and-young-child-feeding
Methodology:
This indicator includes breastfeeding by a wet nurse and feeding expressed breastmilk.
The indicator is based on a recall of the previous day’s feeding to a cross-section of infants 0–5 months of age.
In 2012, the regional and global exclusive breastfeeding estimates were generated using the most recent estimate available for each country between 2005 and 2012. Similarly, 2020 estimates were developed using the most recent estimate available for each country between 2014 and 2020. Global and regional estimates were calculated as weighted averages of the prevalence of exclusive breastfeeding in each country, using the total number of births from the World Population Prospects, 2019 revision398 (2012 for the baseline and 2020 for the current) as weights. Estimates are presented only where the available data are representative of at least 50 percent of corresponding regions’ total number of births, unless otherwise noted.
Challenges and limitations: While a high proportion of countries collect data for exclusive breastfeeding, data are lacking in high-income countries in particular. The recommended periodicity of reporting on exclusive breastfeeding is every three to five years. However, for some countries, data are reported less frequently, meaning changes in feeding patterns are often not detected for several years after the change occurs.
Regional and global averages may be affected depending on which countries had data available for the periods considered in this report.
Using the previous day’s feeding as a basis may cause the proportion of exclusively breastfed infants to be overestimated, as some infants who may have been given other liquids or foods irregularly may not have received these on the day before the survey.
References:
UNICEF. 2021. Infant and young child feeding: exclusive breastfeeding. In: UNICEF. New York, USA. Cited 6 April 2022. data.unicef.org/topic/nutrition/infant-and-young-child-feeding
WHO. 2014. Comprehensive Implementation Plan on maternal, infant and young child nutrition. Geneva, Switzerland. www.who.int/nutrition/publications/CIP_document/en
WHO. 2019. Nutrition Landscape Information System (NLIS) country profile indicators: interpretation guide. Geneva, Switzerland. www.who.int/publications/i/item/9789241516952
WHO & UNICEF. 2021. Indicators for assessing infant and young child feeding practices: definitions and measurement methods. https://apps.who.int/iris/rest/bitstreams/1341846/retrieve
Low birthweight
Definition: Low birthweight is defined as a weight at birth of less than 2 500 g (less than 5.51 lbs), regardless of gestational age. A newborn’s weight at birth is an important marker of maternal and foetal health and nutrition.403
How it is reported: The percentage of newborns weighing less than 2 500 g (less than 5.51 lbs) at birth.
Data source: UNICEF & WHO. 2019. UNICEF-WHO joint low birthweight estimates. In: UNICEF. New York, USA and Geneva, Switzerland. Cited 28 April 2020. www.unicef.org/reports/UNICEF-WHO-low-birthweight-estimates-2019, www.who.int/nutrition/publications/UNICEF-WHO-lowbirthweight-estimates-2019
Methodology: Nationally representative estimates of low birthweight prevalence can be derived from a range of sources, broadly defined as national administrative data or representative household surveys. National administrative data are those coming from national systems including Civil Registration and Vital Statistics (CRVS) systems, national Health Management Information Systems (HMIS) and birth registries. National household surveys which contain information about birthweight as well as key related indicators including maternal perception of size at birth (MICS, DHS) are also an important source of low birthweight data especially in contexts where many births are unweighted and/or data heaping is a problem. Prior to entry into the country dataset, country data are reviewed for coverage and quality and adjusted where the source is a household survey. Administrative data are categorized as: i) high coverage, if representing ≥90 percent of live births; ii) medium coverage, if representing between 80 and 90 percent of live births; or iii) not included, if covering <80 percent of live births. To be included in the dataset, survey data need to have:
- a birthweight in the dataset for at minimum 30 percent of the sample;
- a minimum of 200 birthweights in the dataset;
- no indication of severe data heaping – this means that: a) ≤55 percent of all birthweights can fall on the three most frequent birthweights (i.e. if 3 000 g, 3 500 g and 2 500 g were the three most frequent birthweights, when added together, they have to make up ≤55 percent of all birthweights in the dataset); b) ≤10 percent of all birthweights are ≥4 500 g; and c) ≤5 percent of birthweights fall on tail ends of 500 g and 5 000 g; and
- undergone an adjustment for missing birthweights and heaping.12
Modelling methods were applied to the accepted (and for household survey data, accepted and adjusted) country data to generate annual country estimates from 2000 to 2015, with methods varying by availability and type of input data as follows:
- b-spline: Data for countries with ≥8 data points from higher coverage administrative sources ≥1 point prior to 2005 and ≥1 point more recent than 2010 are smoothed with b-spline regression to generate annual low birthweight estimates. A b-spline regression model was used to predict the standard error and calculate 95 percent confidence intervals for the country-level low birthweight estimates. These low birthweight estimates follow very closely those included in the countries’ own administrative reports.
- Hierarchical regression: Data for countries not meeting requirements for b-spline but with ≥1 low birthweight data point from any source meeting inclusion criteria are fitted into a model using covariates to generate annual low birthweight estimates, as well as uncertainty ranges, using a bootstrap approach. The model includes natural log of neonatal mortality rate; the proportion of children underweight (weight-for-age z score below -2 SD from median weight for age of reference population); data type (higher quality administrative, lower quality administrative, household survey); UN region (e.g. Southern Asia, Caribbean); and a country-specific random effect. These low birthweight estimates may vary substantially from estimates reported by countries in administrative and survey reports, especially given that the household survey estimates are adjusted for missing birthweights and heaping, while survey reports often present a low birthweight estimate just for the children with a birthweight and with no adjustment for data heaping.
- No estimate: Countries for which low birthweight input data were not available and/or did not meet inclusion criteria are indicated in the database as “no estimate”. A total of 54 countries in the current country database were reported as having “no estimate”. Despite not presenting an estimate for these individual 54 countries, annual low birthweight estimates were derived for them using the hierarchical regression methods detailed above but were used only to input into regional and global estimates.
Modelled annual country estimates are used to generate regional and global estimates from 2000–2015. Global estimates are derived by summing the estimated number of live births weighing less than 2 500 g for 195av countries with an estimate in the United Nations regional grouping for each year, and then dividing by all live births in each year in those 195 countries. Regional estimates are similarly derived, based on countries in each regional grouping. To obtain the global and regional level estimates of uncertainty, 1 000 low birthweight point estimates were made for each country for each year using either b-spline (by randomly sampling from a normal distribution plotted using the calculated standard error) or hierarchical regression approach (using a bootstrap approach). The country low birthweight estimates for each of the 1 000 samples were summed at worldwide or regional level and the 2.5th and 97.5th centiles of the resulting distributions were used as the confidence intervals.
Challenges and limitations: A major limitation of monitoring low birthweight globally is the lack of birthweight data for many of the world’s children. There is a notable bias among the unweighted, with those born to poorer, less-educated, rural mothers being less likely to have a recorded birthweight when compared to their richer, urban counterparts with more highly educated mothers.13 As the characteristics of the unweighted are risk factors for having a low birthweight, estimates that do not well represent these children may be lower than the true value. Furthermore, poor quality of available data with regard to excessive heaping on multiples of 500 g or 100 g exists in the majority of available data from lower-middle-income countries (LMICs)13 and can further bias low birthweight estimates. The methods applied to adjust for missing birthweights and heaping for survey estimates in the current database404 are meant to address the problem; however, there were a total of 54 countries for which it was not possible to generate a reliable birthweight estimate. In addition, the confidence limits of the regional and global estimates may be artificially small given that about half of the modelled countries had a country-specific effect generated at random for each bootstrap prediction, some of which were positive and others negative, making the relative uncertainty at the regional and global level tend to be less than that at the individual country level.
References:
Blanc, A. & Wardlaw, T. 2005. Monitoring low birth weight: An evaluation of international estimates and an updated estimation procedure. Bulletin World Health Organization, 83(3): 178–185.
Blencowe, H., Krasevec, J., de Onis, M., Black, R.E., An, X., Stevens, G.A., Borghi, E., Hayashi, C., Estevez, D., Cegolon, L., Shiekh, S., Ponce Hardy, V., Lawn, J.E. & Cousens, S. 2019. National, regional, and worldwide estimates of low birthweight in 2015, with trends from 2000: a systematic analysis. The Lancet Global Health, 7(7): e849–e860.
Adult obesity
Definition: BMI ≥ 30.0 kg/m2. The body mass index (BMI) is the ratio of weight-to-height commonly used to classify the nutritional status of adults. It is calculated as the body weight in kilograms divided by the square of the body height in metres (kg/m2). Obesity includes individuals with BMI equal to or higher than 30 kg/m2.
How it is reported: Percentage of population over 18 years of age with BMI ≥ 30.0 kg/m2 standardized by age and weighted by sex.406
Data source: WHO. 2020. Global Health Observatory (GHO) data repository. In: WHO. Geneva, Switzerland. Cited 28 April 2020. apps.who.int/gho/data/node.main.A900A?lang=en (1 698 population-based studies with more than 19.2 million participants aged 18 years or older, measured in 186 countries).407
Methodology: A Bayesian hierarchical model was applied to selected population-based studies that had measured height and weight in adults aged 18 years and older to estimate trends from 1975 to 2014 in mean BMI and in the prevalence of BMI categories (underweight, overweight and obesity). The model incorporated nonlinear time trends and age patterns, national versus subnational and community representativeness, and whether data covered both rural and urban areas versus only one of them. The model also included covariates that help predict BMI, including national income, proportion of population living in urban areas, mean number of years of education, and summary measures of availability of different food types for human consumption.
Challenges and limitations: Some countries had few data sources, and only 42 percent of included sources reported data for people older than 70 years.
References:
NCD-RisC (NCD Risk Factor Collaboration). 2016. Trends in adult body-mass index in 200 countries from 1975 to 2014: a pooled analysis of 1698 population-based measurement studies with 19.2 million participants. The Lancet, 387(10026): 1377–1396.
WHO. 2019. Nutrition Landscape Information System (NLIS) country profile indicators: interpretation guide. Geneva, Switzerland. www.who.int/publications/i/item/9789241516952
Anaemia in women aged 15 to 49 years
Definition: Percentage of women aged 15−49 years with a haemoglobin concentration less than 120 g/L for non-pregnant women and lactating women, and less than 110 g/L for pregnant women, adjusted for altitude and smoking.
How it is reported: Percentage of women aged 15 to 49 years with a haemoglobin concentration below 110 g/L for pregnant women and below 120 g/L for non-pregnant women.
Data source:
WHO. 2021. Vitamin and Mineral Nutrition Information System (VMNIS). In: WHO. Geneva, Switzerland. Cited 25 May 2021. www.who.int/teams/nutrition-food-safety/databases/vitamin-and-mineral-nutrition-information-system
WHO. 2021. Global anaemia estimates, Edition 2021. In: WHO | Global Health Observatory (GHO) data repository. Geneva, Switzerland. Cited 25 May 2021. www.who.int/data/gho/data/indicators/indicator-details/GHO/prevalence-of-anaemia-in-women-of-reproductive-age-(-)
Methodology: The preferable source of data is population-based surveys. Data were taken from the Micronutrients Database of the WHO Vitamin and Mineral Information System (VMNIS). This database compiles and summarizes data on the micronutrient status of populations from various other sources, including data collected from the scientific literature and through collaborators, including WHO regional and country offices, United Nations organizations, ministries of health, research and academic institutions, and non-governmental organizations. In addition, anonymized individual-level data are obtained from multi-country surveys, including demographic and health surveys, multiple indicator cluster surveys, reproductive health surveys and malaria indicator surveys.
The 2021 edition of anaemia estimates in women aged 15 to 49 years, by pregnancy status, included 489 data sources spanning 1995–2020. Adjustments of data on blood haemoglobin concentrations for altitude and smoking were carried out whenever possible. Biologically implausible haemoglobin values (<25 g/L or >200 g/L) were excluded. A Bayesian hierarchical mixture model was used to estimate haemoglobin distributions and systematically address missing data, non-linear time trends, and representativeness of data sources. Briefly, the model calculates estimates for each country and year, informed by data from that country and year themselves, if available, and by data from other years in the same country and in other countries with data for similar time periods, especially countries in the same region. The model borrows data, to a greater extent, when data are non-existent or weakly informative, and to a lesser extent for data-rich countries and regions. The resulting estimates are also informed by covariates that help predict blood haemoglobin concentrations (e.g. socio-demographic index, meat supply [kcal/capita], mean BMI for women, and log of under-five mortality for children).408 The uncertainty ranges (credibility intervals) reflect the major sources of uncertainty, including sampling error, non-sampling error due to issues in sample design/measurement, and uncertainty from making estimates for countries and years without data.
Challenges and limitations: Despite a high proportion of countries having nationally representative survey data available for anaemia, there is still a lack of reporting on this indicator, especially in high-income countries. As a result, the estimates may not capture the full variation across countries and regions, thus tending to “shrink” towards global means when data are sparse.
References:
Stevens, G.A., Finucane, M.M., De-Regil, L.M., Paciorek, C.J., Flaxman, S.R., Branca, F., Peña-Rosas, J.P., Bhutta, Z.A. & Ezzati, M. 2013. Global, regional, and national trends in haemoglobin concentration and prevalence of total and severe anaemia in children and pregnant and non-pregnant women for 1995–2011: a systematic analysis of population-representative data. The Lancet Global Health, 1(1): e16–e25.
WHO. 2014. Comprehensive Implementation Plan on maternal, infant and young child nutrition. Geneva, Switzerland.
WHO. 2021. Nutrition Landscape Information System (NliS) Country Profile. In: WHO. Geneva, Switzerland. Cited 10 May 2021. www.who.int/data/nutrition/nlis/country-profile
WHO. 2021. Vitamin and Mineral Nutrition Information System (VMNIS). In: WHO. Geneva, Switzerland. Cited 10 May 2021. www.who.int/teams/nutrition-food-safety/databases/vitamin-and-mineral-nutrition-information-system
WHO. 2021. WHO Global Anaemia estimates, 2021 Edition. In: WHO | Global Health Observatory (GHO) data repository. Geneva, Switzerland. Cited 10 May 2021. www.who.int/data/gho/data/themes/topics/anaemia_in_women_and_children

