


A. Methodology for 2020 and 2021 PoU nowcasts
As in previous editions of this report, due to lack of detailed information on the most recent values of each of the elements that contribute to computing the PoU and NoU (see Annex 1B), estimates referring to the most recent year are nowcasted; in other words, they are predictions of the very recent past.
As already noted last year, 2020 was unique in many respects due to the COVID-19 pandemic, which imposed unprecedented restrictions on people’s ability to work and move. This demanded special considerations when nowcasting the values of the PoU, especially with respect to estimating the likely change in the CV and to modelling the way in which inequality in access to food contributes to rates of undernourishment. Both aspects required special treatment.
It is now clear that the COVID-19 pandemic has had effects on people’s ability to access food lasting into 2021, a reason why the special treatment to nowcast the CV is applied to nowcasting values for both 2020 and 2021.
Estimating changes in FIsev from 2019 to 2021
While it was possible to nowcast the values of DEC in 2020 and 2021 using the traditional approach based on information provided by the Markets and Trade Division of FAO, used to inform FAO Agricultural Outlooks, it was necessary to modify the traditional approach used to nowcast the CV. Normally, changes in CV|y (the component of the CV associated with differences in households’ economic conditions) are derived from differences in three-year averages of the prevalence of severe food insecurity based on the FIES (FIsev) that are not explained by changes in food supplies. Use of the three-year average addressed the need to control for possible excess sampling variability in country-level estimates of the FIsev (which, for most countries, is based on relatively small samples of FIES data) and is consistent with an assumption that CV|y follows a relatively stable trend. The exceptional nature of 2020 and 2021 makes it difficult to maintain this last assumption. Because of that, the changes between the 2017–2019 average and the 2020 annual values of FIsev were used to nowcast the 2020 values of CV|y, and the changes between the 2020 and 2021 annual values of FIsev were used to nowcast the 2021 values of CV|y.
Adjustments in the proportion of change in FIsev that is attributed to CV|y
Another parameter that needed attention last year to nowcast the 2020 value of PoU was the percentage of change in FIsev (used as a proxy for the expected change in the PoU) that is attributed to CV|y. Normally, this has been assumed to be equal to one-third, based on an econometric analysis of past values of PoU, DEC and CV|y. The exceptional nature of 2020 (and now of 2021) calls into question that regularity. As no national household consumption and expenditure survey collected data in 2020 or in 2021, we still lack any empirical basis to determine how to properly modify it. The solution last year was to conduct a sensitivity analysis modifying the percentage of change in FIsev that is attributed to CV|y from a minimum of one-third to a maximum of one. The same approach was followed this year. The result is a range of possible values of CV|y, and hence of PoU, in 2020 and in 2021. For completeness, Table A2.1 presents the lower and upper bounds of the PoU in 2020 and 2021 at the global, regional and subregional levels.
TABLE A2.1RANGES OF PoU AND NoU NOWCASTED IN 2020 AND 2021
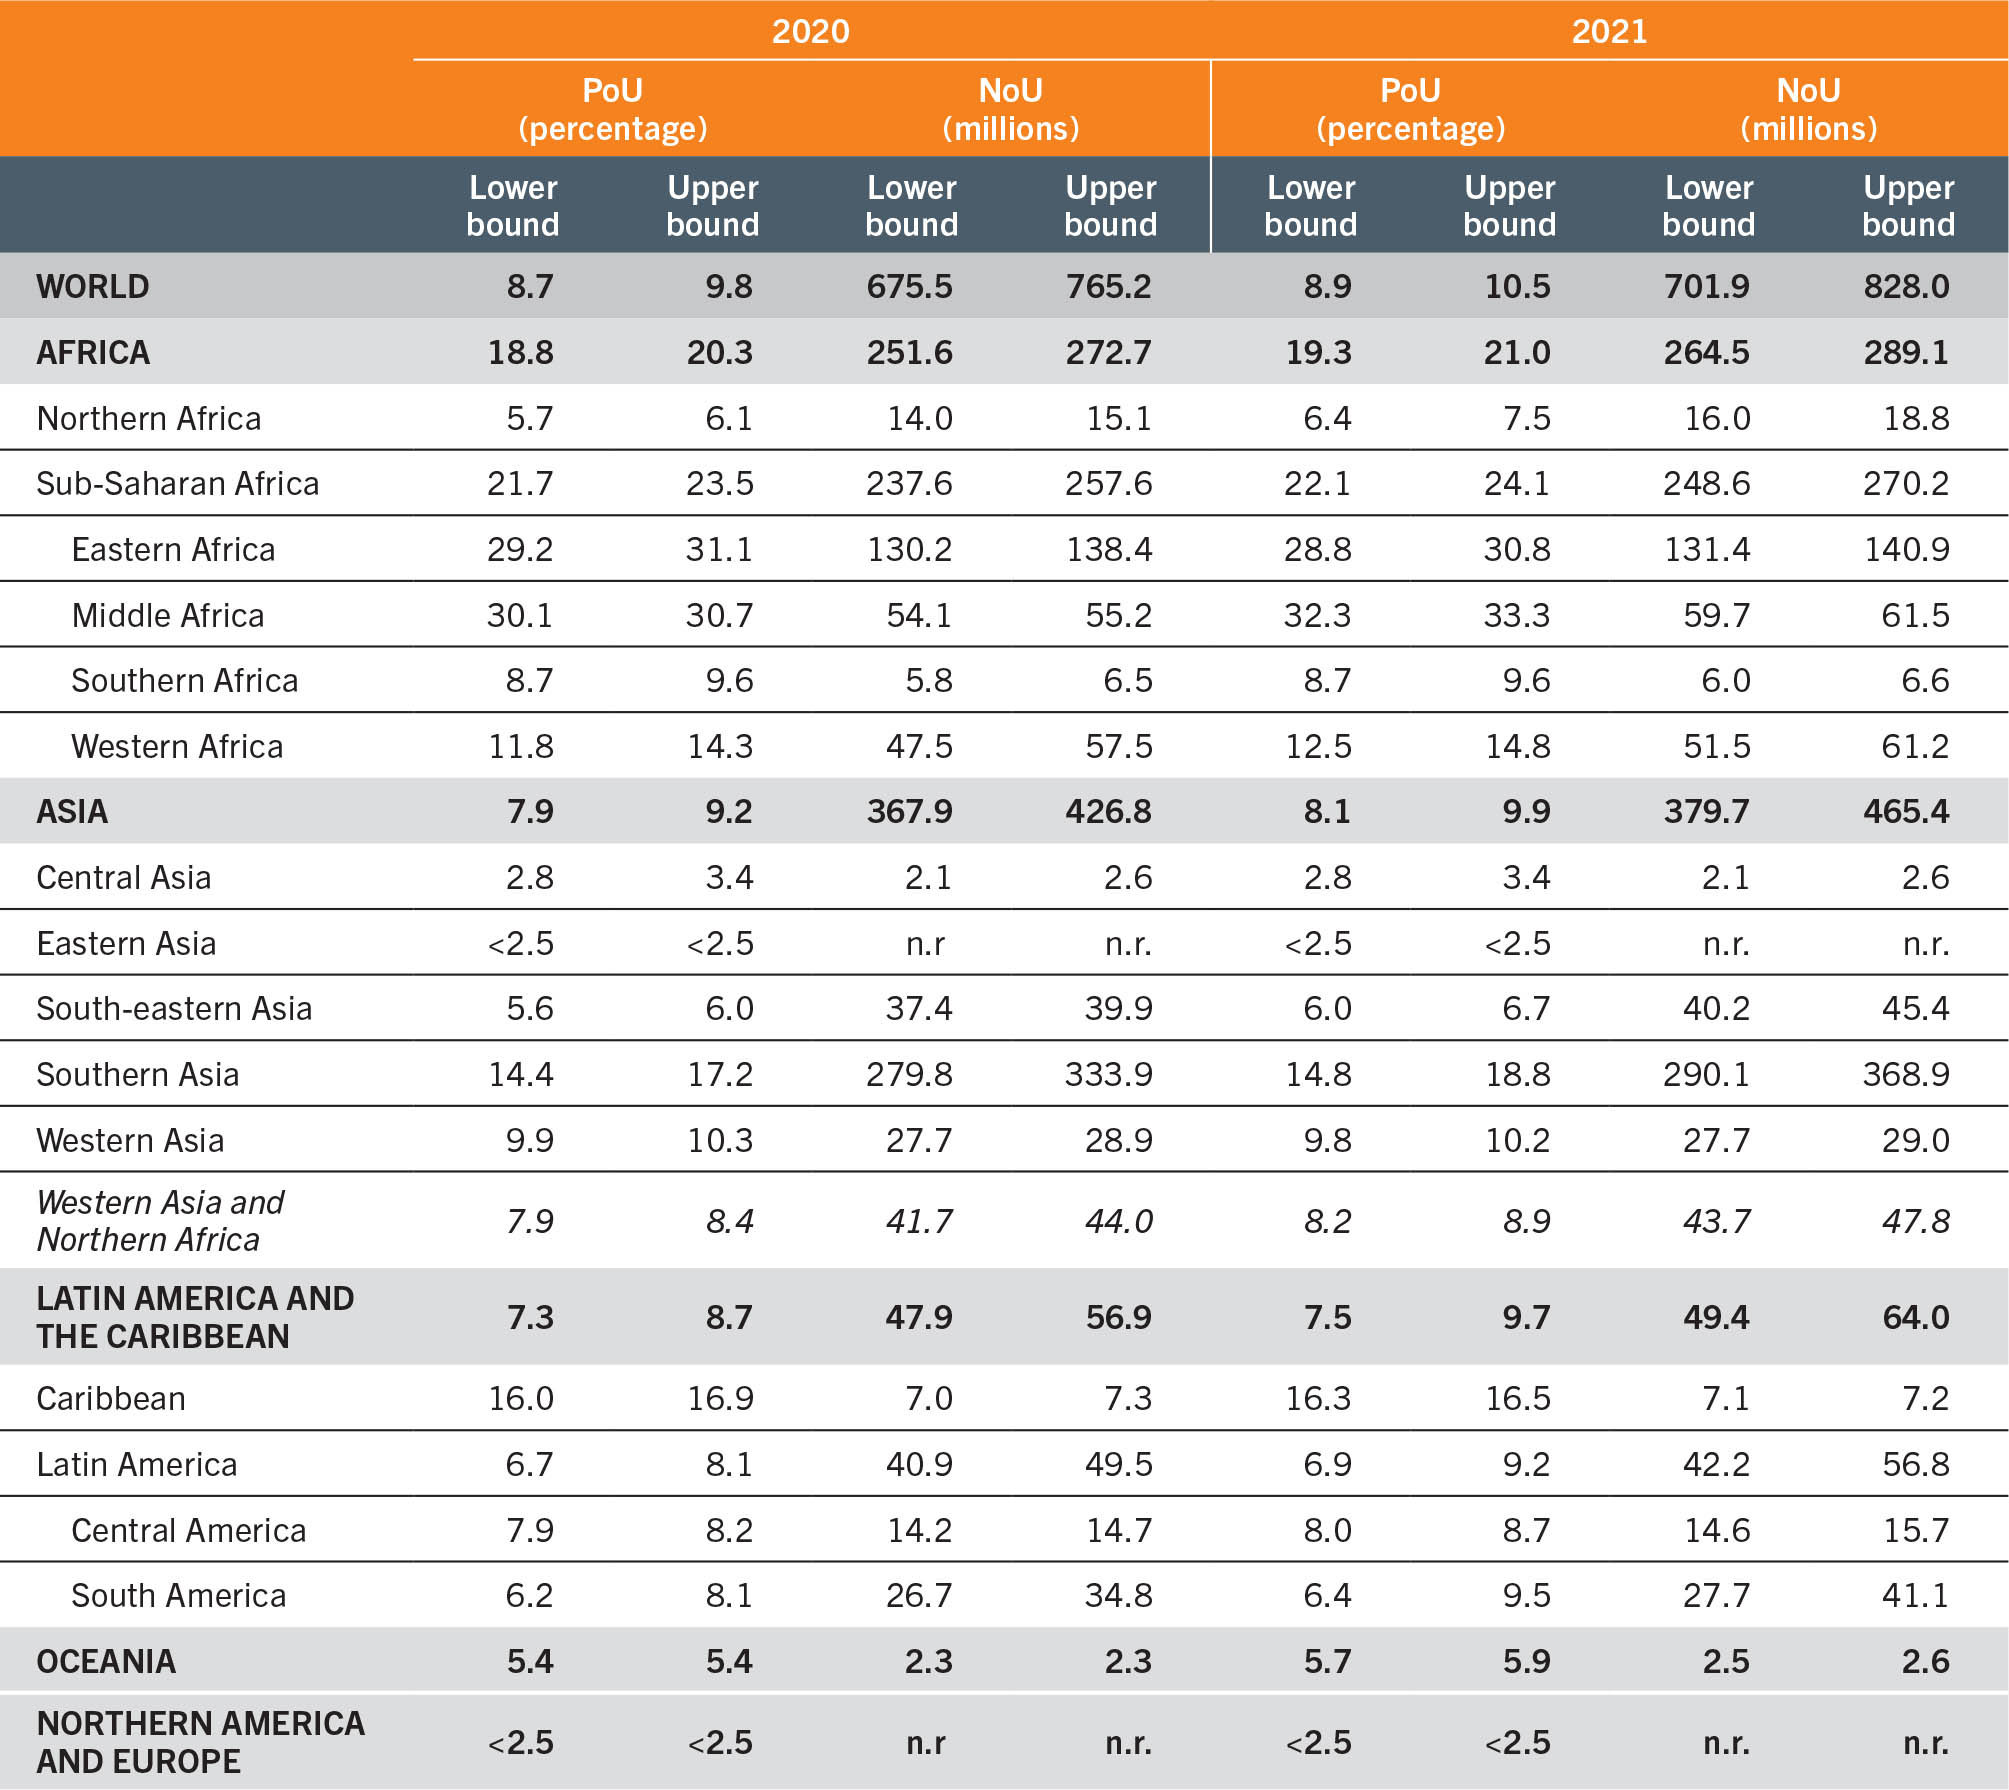
SOURCE: FAO.
B. Methodology for projections of PoU to 2030
To project PoU values to 2030, we project the three fundamental variables that enter in the PoU formula (DEC, CV and MDER) separately, based on different inputs, depending on the scenario considered.
The main source of information is the output of the MIRAGRODEP recursive, dynamic computable general equilibrium (CGE) model, which provides series of projected values, at country level, for:
- real per capita GDP (GDP_Vol_pc);
- income Gini coefficient (gini_income);
- an index of real food price (Prices_Real_Food);
- extreme poverty headcount rate (that is, the percentage of the population with real daily income below USD 1.9) (x190_ALL); and
- daily per capita food consumption (DES_Kcal).
The MIRAGRODEP model was calibrated to the pre-COVID-19 situation of the world economy in 2018 and was used to generate projections of macroeconomic fundamentals into 2019–2030 under two scenarios: a reference scenario, aimed at capturing the impact of COVID-19 as reflected in the latest available update of the IMF World Economic Outlook409 published in April 2022, and a no-COVID-19 scenario, based on the October 2019 edition of World Economic Outlook, which is the last one before the pandemic. A more detailed description of the MIRAGRODEP model, as well as the assumptions used to build the reference scenario and the no-COVID-19 scenario, can be found in Laborde and Torero (forthcoming).410
In addition, we use the median variant projections of total population (both sexes), its composition by gender and age, and the crude birth rate as provided by the 2019 revision of the World Population Prospects.398
Projections of DEC
To project the series of DEC we use the following formula:
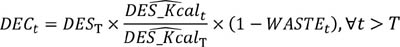
with T = 2021 for the reference scenario, and T = 2019 for the no-COVID-19 one.
In other words, we take the model projected series of DES_Kcal and adjust its level so that the value for year T matches the actual value. (This is necessary as the MIRAGRODEP model has been calibrated to an older FBS series.)
Projections of MDER
To project the MDER, we simply compute it based on the data on the composition of the population by sex and age as projected by the 2019 World Population Prospects398 (medium variant).
Projections of the CV
As always, the total CV is computed as 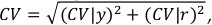 where the two components refer to variability due to differences across households, based on their income level, and variability across individuals based on differences in sex, age, body mass and physical activity level.
CV|r is simply computed based on WPP population projected data (similarly to what we do for the MDER), while CV|y is computed using a linear combination of relevant macroeconomic and demographic variables, based on the estimated coefficients from a multiple regression of historic CV|y, and fed with the projections from the MIRAGRODEP model and WPP.
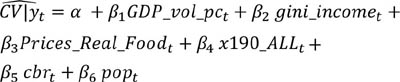
To estimate the coefficients used in the above formula, we considered alternative models, as summarized in Table A2.2, which yield very similar predictions.
TABLE A2.2REGRESSION COEFFICIENTS FROM THREE MODELS ESTIMATED ON HISTORIC CV|y VALUES (2000–2019)
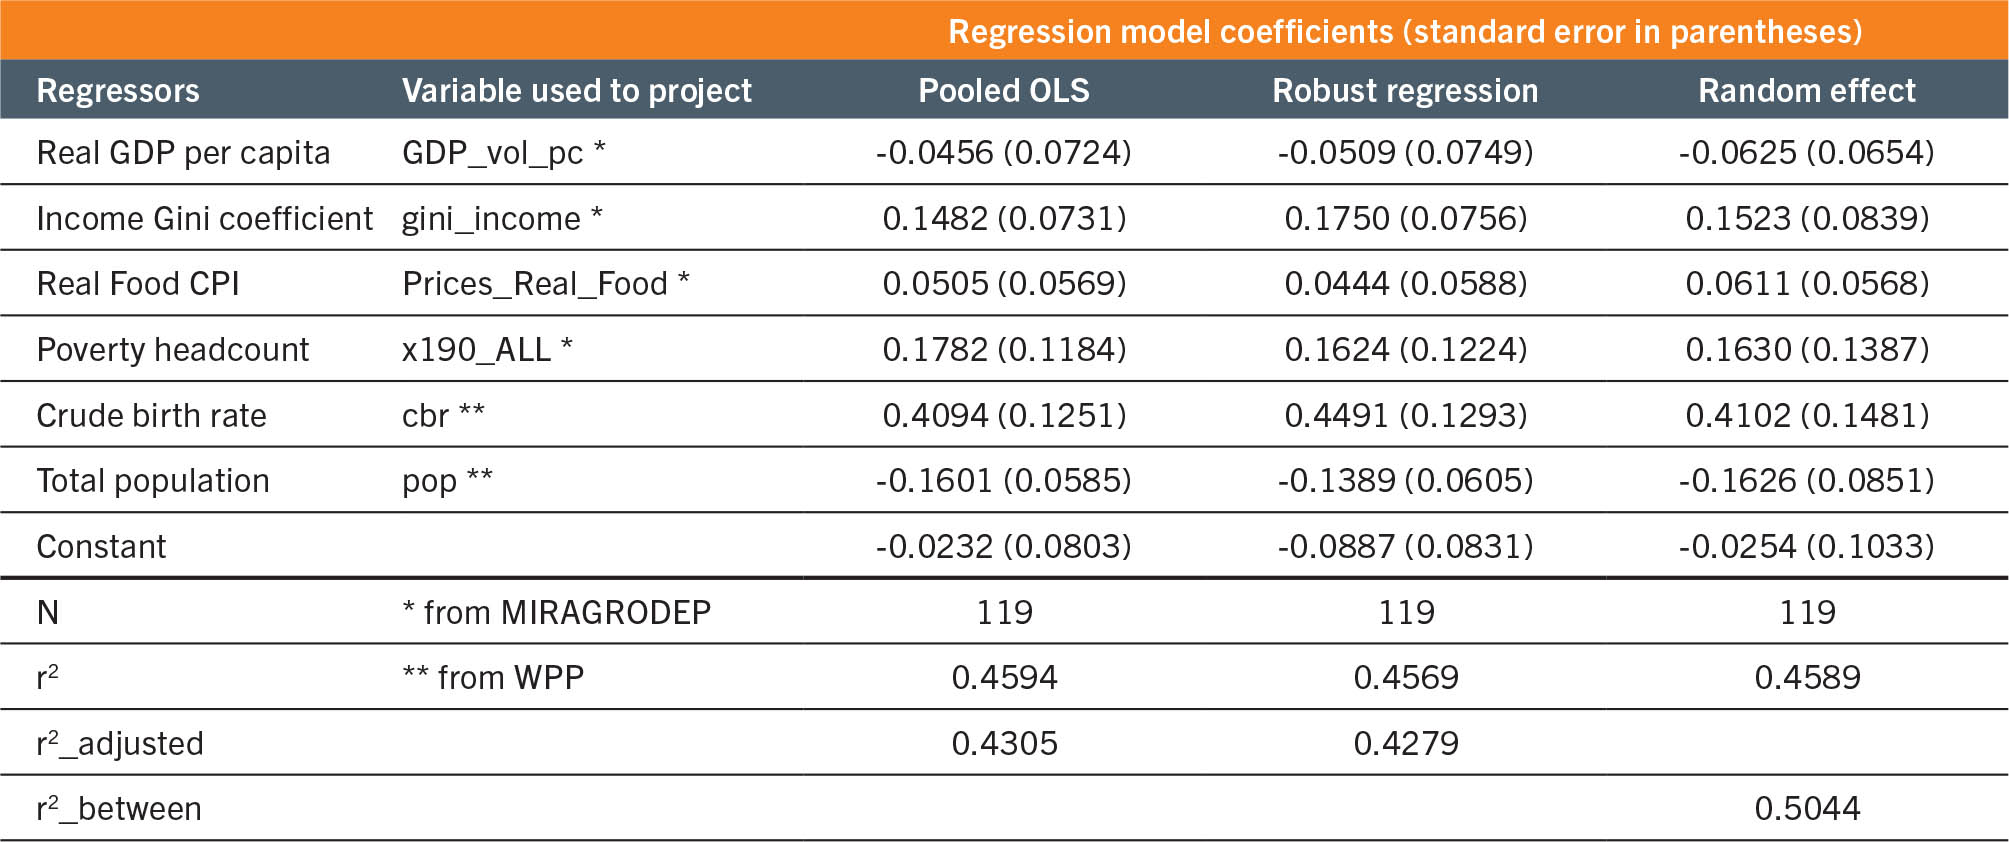
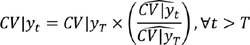
The series of CV|y values predicted by the formula separately for each country for the years T + 1 to 2030 is then calibrated to the value for year T, similarly to what is done for the DES:
C. Methodology for inequality analysis on nutrition outcomes
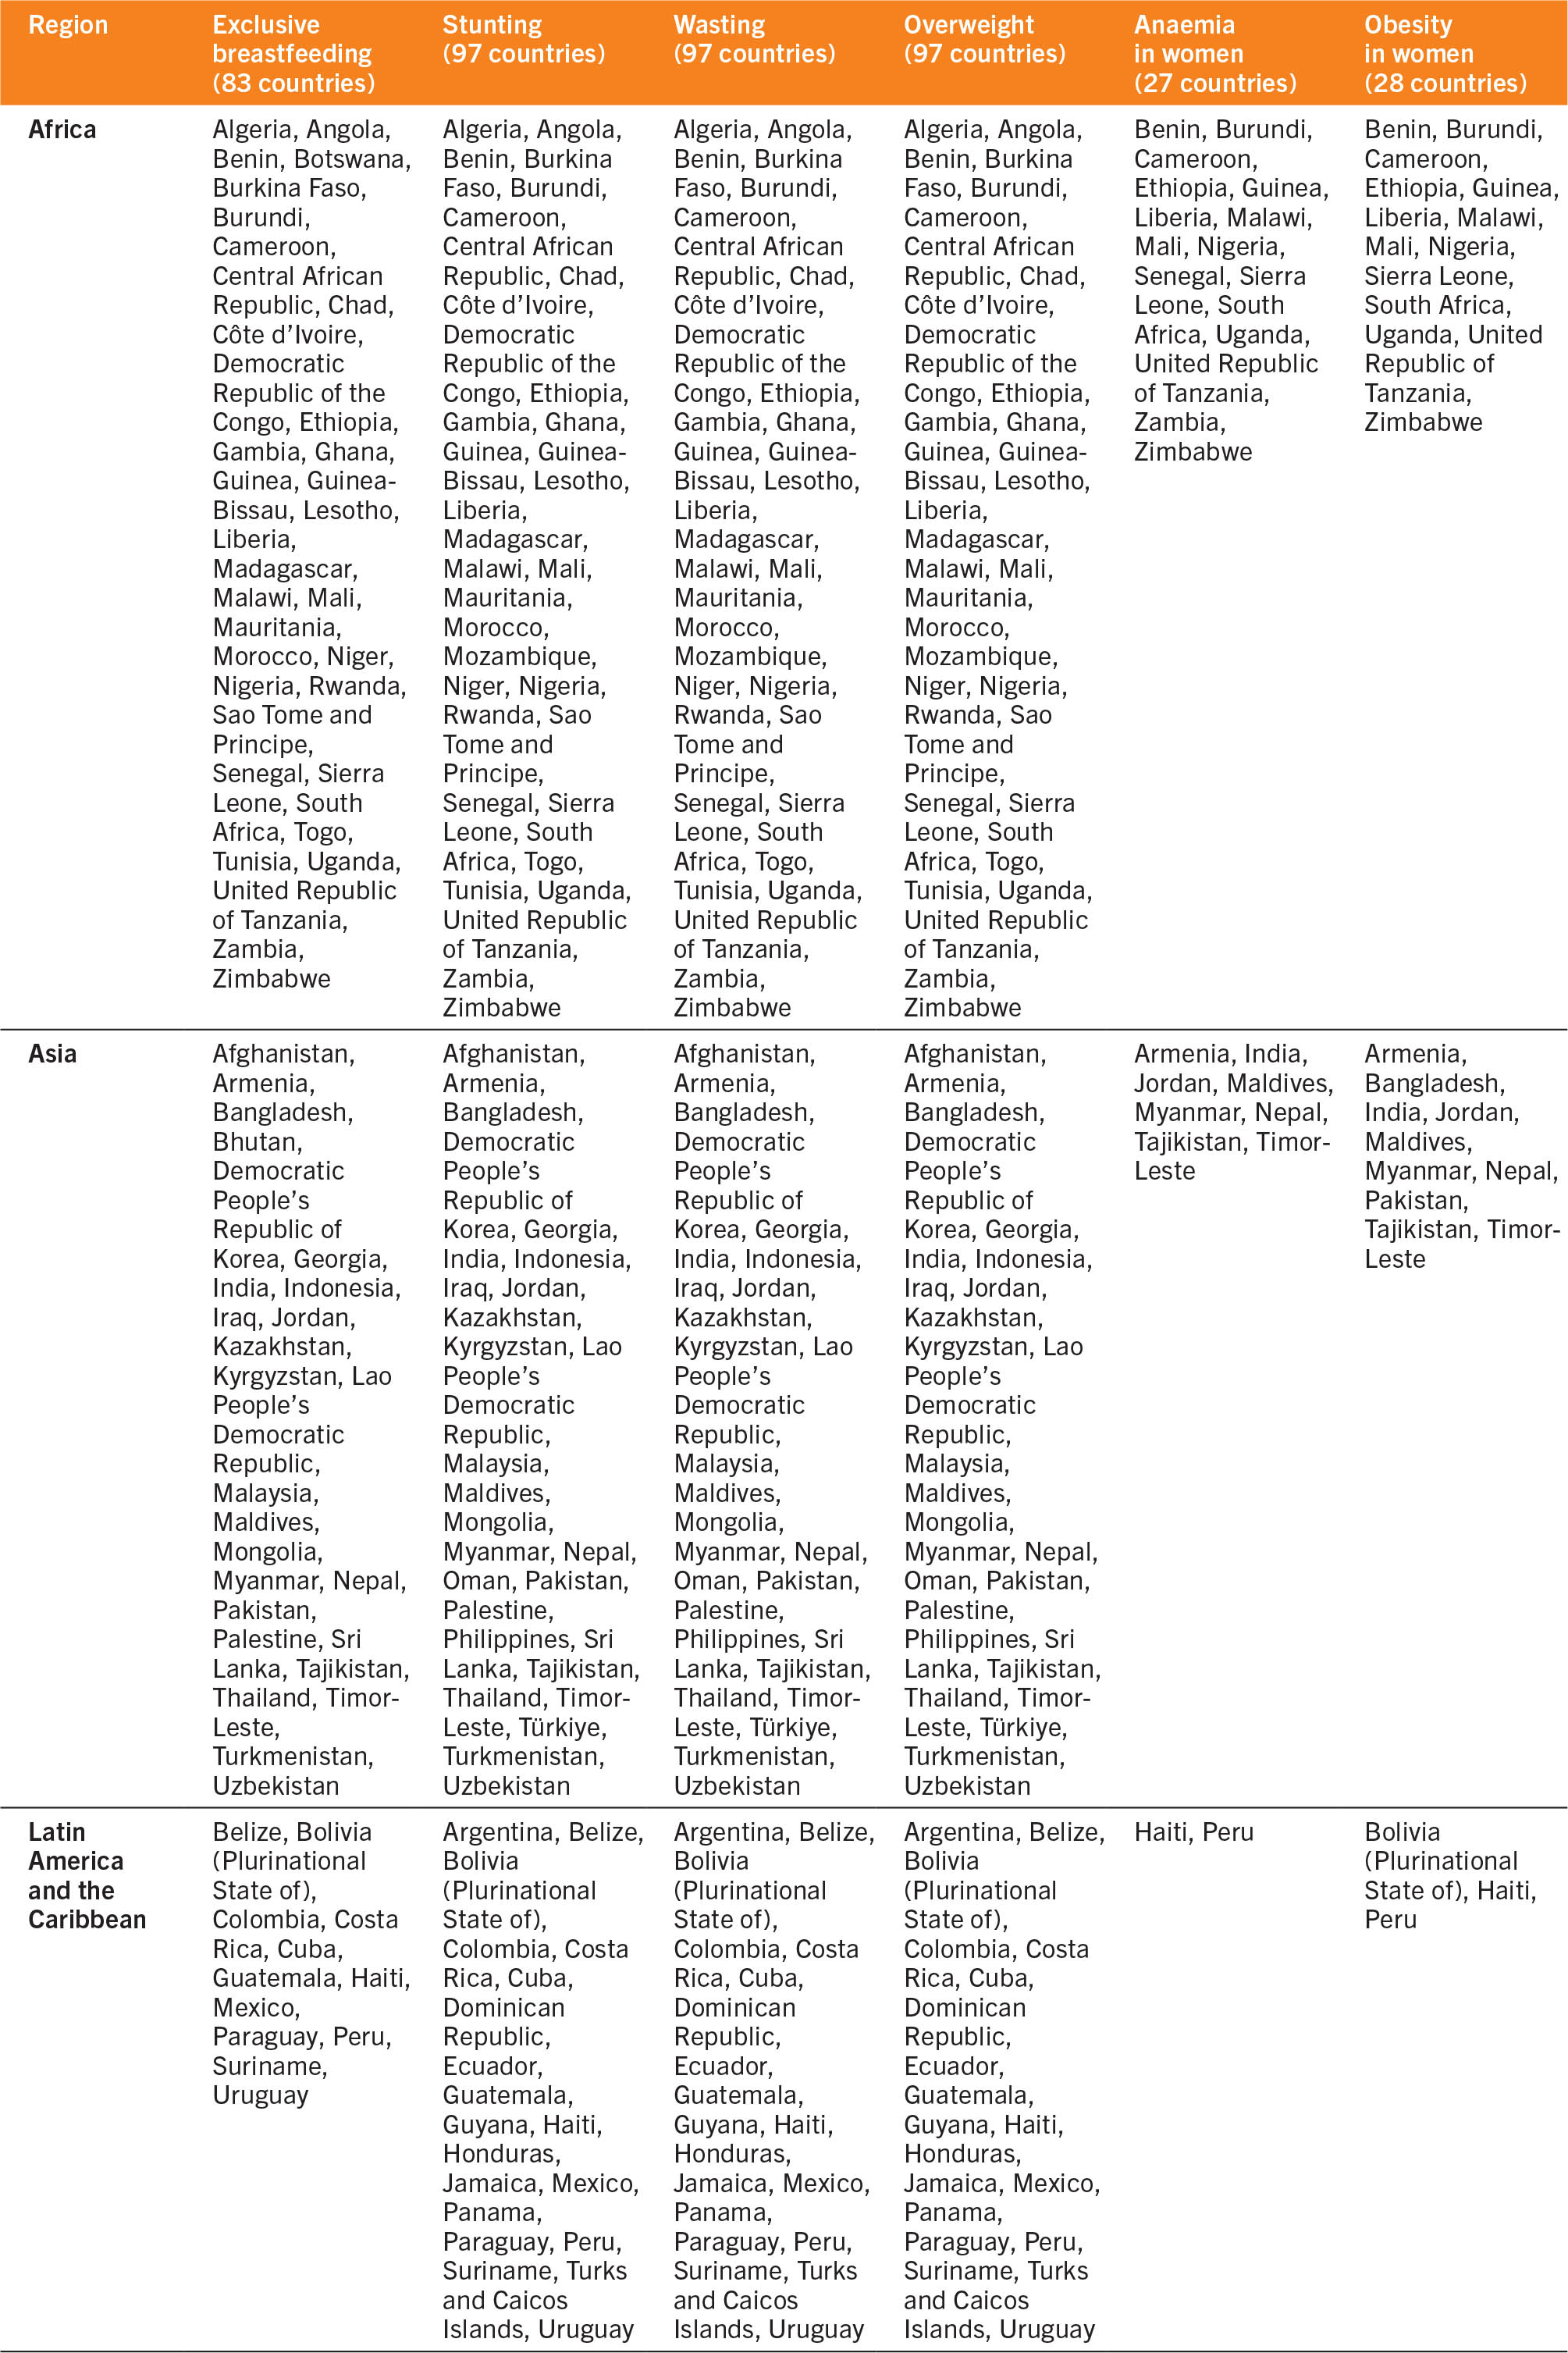
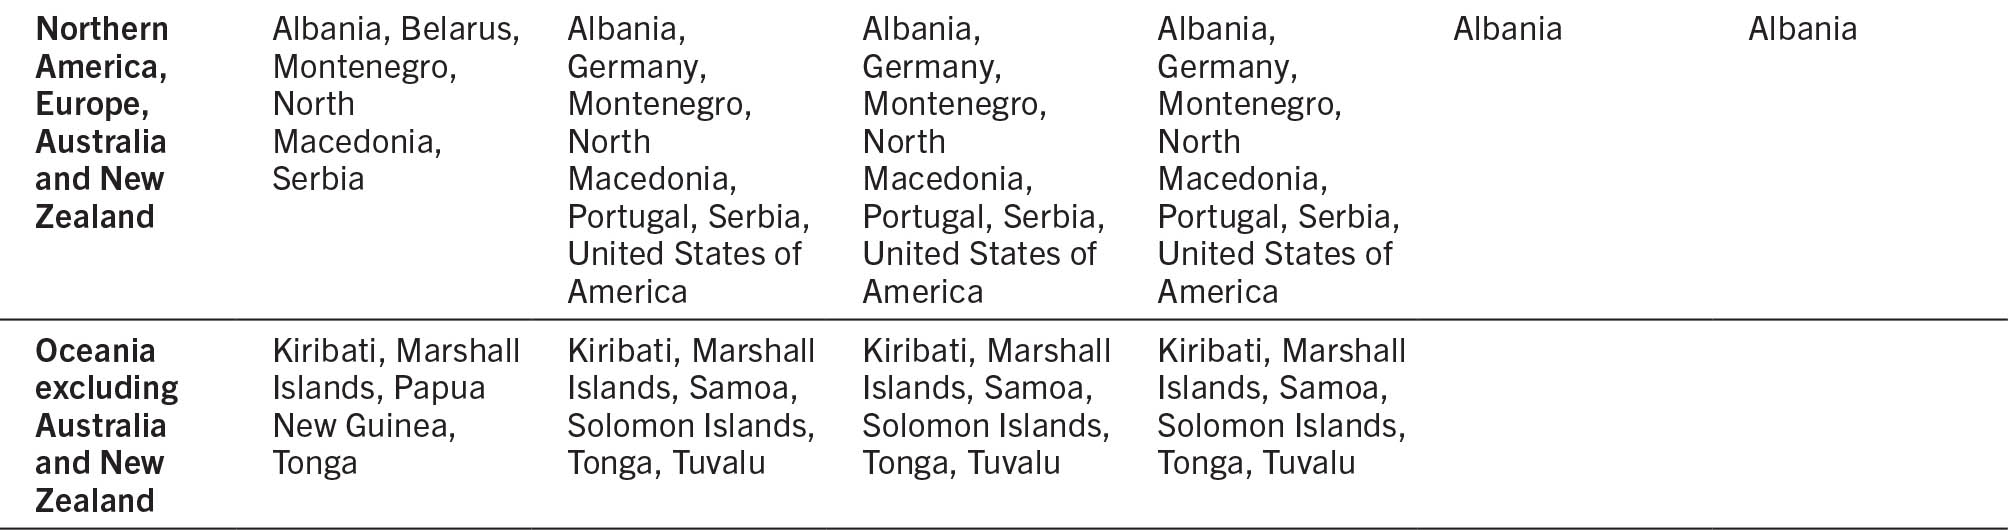
An inequality analysis in Section 2.2 was carried out according to urban and rural residence, household wealth, education level and gender as applied to six nutrition indicators using Equiplots. This type of chart depicts mean prevalences for subpopulations within each category of the respective inequity dimension (e.g. rural and urban within type of residence, wealth quintiles). Equiplots allow visual interpretation of prevalence levels and distance between groups, which represents absolute inequality. The analysis was performed across regions based on data availability for countries within each region. Unweighted analysis was applied using the latest available data from national surveys between 2015 and 2021. The list of countries contributing to each region is presented in Table A2.3; data sources are included in table notes.
TABLE A2.3Countries with nutrition outcome data from national surveys between 2015 and 2021 that contributed to the inequality analysis
D. Methodology for assessment of progress against nutrition targets at the regional and global levels
These methodological notes pertain to results presented in Figure 15 in Section 2.2 of the report which depicts the proportion of countries with progress ratios across the various categories, that is, the proportion of the number of countries with data available in each category.
Progress since the baseline year of 2012 was assessed against the 2030 nutrition targets established by UNICEF/WHO26 using an adapted version of rules from the WHO-UNICEF Technical Expert Advisory Group on Nutrition Monitoring.411
Country progress was assessed based on the ratio between the progress achieved (relative reduction) and the target reduction to achieve the 2030 targets. That is, the proportion of progress achieved so far is given by
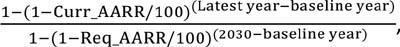
where Curr_AARRaw is the AARR based on recent yearsax and Req_AARR is the required AARRay to reach the country target if the 2030 global target is adopted. Note, progress towards the exclusive breastfeeding target (EBF) was done based on the reduction of non-exclusive breastfeeding rate, that is, 100 minus EBF rate.
Country progress ratios represent the amount of progress made up to the latest year for which data are available (in terms of reduction), compared to the total required to reach the target. For example, a country that has reduced the number of children who are stunted by 30 percent by 2020 (the latest year for which data are available), when compared to the target of 50 percent reduction by 2030, will have a ratio of 30/50, or 60 percent. This means that country has achieved 60 percent of the progress needed to reach the target between baseline year 2012 and 2020, having still to attain 40 percent of the needed progress in the last 10 years before 2030.
For summarizing progress in each region, countries’ progress ratios were categorized into five categories:
- worsening (any negative progress – going in the wrong direction);
- progress ratio between 0 and 24.9 percent;
- between 25 percent and 49.9 percent;
- between 50 percent and 74.9 percent; and
- greater than 75 percent.
Note, for each indicator other than EBF, when the latest prevalence was smaller than 3 percent, the value ratio was set at 100 percent to indicate that the target was reached already, even when worsening. In case of EBF, the value ratio was set at 100 percent when the latest prevalence was 70 percent or greater. For wasting and EBF, progress assessment is included only for those countries where the latest survey year is 2015 or more recent. Important also to note when interpreting progress achieved is that progress ratios are based on exponential functions, in contrast to changing linearly across time, as indicated in the above equation.
E. Methodology for the cost and affordability of a healthy diet
FAO continues to systematically monitor and report annually on these new indicators in this report. Estimates are updated for year 2020 (see sections below, Updating the cost of a healthy diet and Updating the affordability of a healthy diet). In addition, periodic revisions to the entire data series will be carried out to refine and improve the accuracy of the estimations as new data become available and methodologies advance. The revision to the cost and affordability of a healthy diet this year accounts for new income distributions, a revised average share of income that can be credibly reserved for food, and a methodological refinement to estimate the cost of the diet that is more robust, provides greater transparency, and supports long-term monitoring utilizing annually reported price data. Box 6 in Section 2.3 provides a brief summary of these revisions and implications (see Herforth et al. [forthcoming]54 for a full description of data sources and methodology).
The cost of a healthy diet
A healthy diet provides not only adequate calories but also adequate levels of all essential nutrients and food groups needed for an active and healthy life (see Section 2.1). The cost of a healthy diet is defined as the cost of the least expensive locally available foods to meet requirements for energy and food-based dietary guidelines (FBDG) for a representative person within energy balance at 2 330 kcal/day. The FBDGs analysed explicitly recommend food quantities for each food group and provide a wide regional representation. Although it is not selected based on nutrient content but is determined by FBDGs, this diet meets on average nearly 95 percent of nutrient needs, so it can therefore almost always be considered as nutrient adequate.
The availability and prices of items in each food group needed for a healthy diet were obtained from the ICP as national averages for 2017. Item definitions are internationally standardized, allowing classification by food group and calculation of the least-costs to reach FBDG requirements in each country, representing an average across markets and throughout the year.412 For a detailed description of the healthy diet and related methodology, see the background methods paper to this report.54
Affordability of a healthy diet
In this report, to determine affordability, the cost of a healthy diet is compared with country-specific income distributions that are derived from the World Bank’s PIP.51 The resulting measures of affordability include the percentage and number of people who cannot afford a healthy diet in a given country, in 2020. A healthy diet is considered unaffordable when its cost exceeds 52 percent of the income in a country. This percentage accounts for a portion of income that can be credibly reserved for food, based on observations that the population in LICs spend, on average, 52 percent of their income on food, as derived from the 2017 ICP national accounts household expenditure data.
Based on this threshold and comparing the cost of the diet with country income distributions, we obtain the percentage of people for whom the cost of the diet is unaffordable. These proportions are then multiplied by the 2020 population in each country using the World Development Indicators (WDI) of the World Bank, to obtain the number of people who cannot afford a healthy diet in a given country. For a detailed description of the affordability indicators and related methodology, see Annex 3 of FAO, IFAD, UNICEF, WFP and WHO (2020).3
Updating the cost of a healthy diet
The ICP is currently the only source of retail food price data for internationally standardized items, as part of the program’s larger effort to compute purchasing power parity (PPP) exchange rates across all countries of the world. However, these data are only available once every three to five years, which does not allow for yearly global monitoring of diet costs to guide programmes and policies. In the absence of updated food price data, in this report, the method of updating the cost indicator between ICP publication years relies on consumer price indices (CPIs) published by FAO. This dataset tracks change in monthly general and food CPIs at the national level with reference to a base year of 2015. The annual CPIs are computed as simple averages of the 12 monthly CPIs within a year. In particular, CPIs data for food and non-alcoholic beverages are used to update the cost of a healthy diet in 2020 for all countries except Bermuda, Central African Republic and Guyana, for which the general CPI is used. For Bermuda, the data are sourced from the government’s website.413 The cost of a healthy diet is estimated by multiplying each country’s 2017 actual cost, expressed in local currency units (LCU), with the CPI ratio:
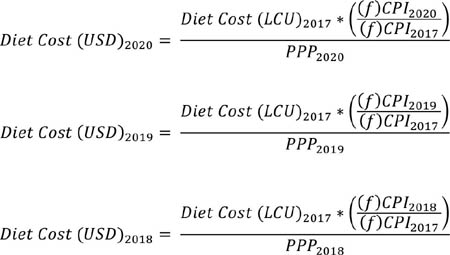
The cost of a healthy diet is first updated in LCU and then converted into international dollars using the WDI PPP for private consumption conversion factors, to compare the cost across countries and political entities. For a detailed description of the methodology, see Bai et al. (forthcoming).414
The cost of a healthy diet was computed for 169 countries in 2017 and updated for 2018–2020 for all countries except Anguilla, Montserrat, and Taiwan Province of China that have neither information on CPIs nor on PPPs. Out of the remaining 166 countries, there are 22 countries with missing PPP data in any year between 2018 and 2020,az and one country with missing CPIs data (Turks and Caicos Islands). For the 22 countries, PPP imputations were applied using an Autoregressive Integrated Moving Average Model with External Explanatory Variable (ARIMAX). In line with the World Bank’s WDI methodology for PPP extrapolations, the ratio between a country’s general CPI and the CPI for the base country (in this case the United States of America) is included in the model specification as a key predictor of PPP values. Furthermore, per capita GDP and per capita household consumption expenditure are also added as external covariates, and the Holt-Winter smoothing methodology is applied to both series to fill the gaps, if needed. The ARIMAX approach allows to estimate, for each country, several model specifications that include an autoregressive component, an integration component, a moving average, and a combination of the three. The best specification is selected when at least the estimated coefficient of the CPI ratio is statistically significant, followed by the statistical significance of the ARIMAX parameters. For countries showing abnormal PPP series over time, the CPI ratio is found to be the only statistically significant coefficient to affect the variability of the PPP values. On the contrary, for countries with a less volatile PPP series, the historical PPP trend plays also a role in predicting PPP values, as well as the coefficient estimates of per capita GDP and/or per capita expenditures. The ARIMAX computes the predicted values on the best specification selected for each country.
For one country with missing information on CPIs (Turks and Caicos Islands), cost imputations were applied using the average diet cost in the country’s subregion (s):
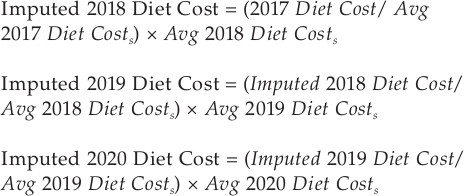
Subregional cost averages in 2017, 2018 and 2019 were computed excluding Turks and Caicos Islands.
A limitation of this method used to update the cost of a healthy diet in 2018–2020 is that changes in the cost depend on (food) CPIs and do not reflect item-specific changes in food prices, nor any differential changes in the price of different food groups, due to the lack of new item-level food price data for more nutritious food items. FAO is exploring how to expand reporting of item-level prices to allow more frequent and robust monitoring of the cost of a healthy diet.
Updating the affordability of a healthy diet
In this report, affordability was updated for years 2018–2020. Through continuous updates based on incoming national surveys and data imputations, the income distributions in the PIP database51 are now available and updated for the 2017, 2018 and 2019 reference years in all countries. Income distributions in year 2020 are not available at the time of writing. Thus, the percent of people who cannot afford a healthy diet in 2020 was computed using the 2020 CPI-inflated cost of the diet described above, as well as the corresponding 2019 income distributions available in PIP.51 These proportions were multiplied by each country’s population in 2020 using the WDI of the World Bank, to obtain the number of people who cannot afford a healthy diet in this year.
Income distributions in PIP51 are not available for all the countries. Thus, of the 169 countries with cost information in 2017, the affordability indicators were computed for 143 countries. This information was updated for all countries for years 2018–2020, except for Taiwan Province of China. For this country, the unavailability of food CPI did not allow to compute the cost and, therefore, affordability.
The latest estimates of the affordability indicators were performed on 24 May 2022. As the PIP database is currently undergoing continuous updates of income distributions, affordability estimations after this date may marginally change.

