


Data sources and coverage
The indicators of policy support to food and agriculture presented in Section 3.1 are compiled from the data assembled by the Consortium for Measuring the Policy Environment for Agriculture, or “Ag-Incentives Consortium”, whose partner institutions are FAO, IDB, IFPRI, OECD and the World Bank.
The NRP and NRA indicators presented in Section 3.1 are included in the Ag-Incentives database (available at http://ag-incentives.org)415 as the core indicators on public support provided to agricultural producers. These indicators cover the period of 2005–2018 for a total of about 63 countries (considering all European Union members as a single country) that together account for close to 90 percent of the global value of agricultural production in the years with the greatest coverage, such as in 2012. Table A4.1 reports countries covered in the dataset and their income group. Given that some countries changed income level and group over the period analysed in the report and for which Ag-Incentives data are available, the specific income group as specified in Table A4.1 was determined based on the predominant income status over the 2005–2018 period. The country coverage of the dataset varies every year and particularly at the beginning and end of the period due to data availability for some countries.ba Moreover, some countries for which agriculture and agricultural support are very relevant are not included in the dataset (e.g. Bangladesh, Egypt, Malaysia, Morocco and Thailand): this, together with the data gaps in the most recent years, must be taken into consideration in the analysis of the indicators.
TABLE A4.1COUNTRIES COVERED IN THE AG-INCENTIVES DATABASE BY THE COUNTRY INCOME GROUP CLASSIFICATION USED IN THE STOCKTAKING ANALYSISx2
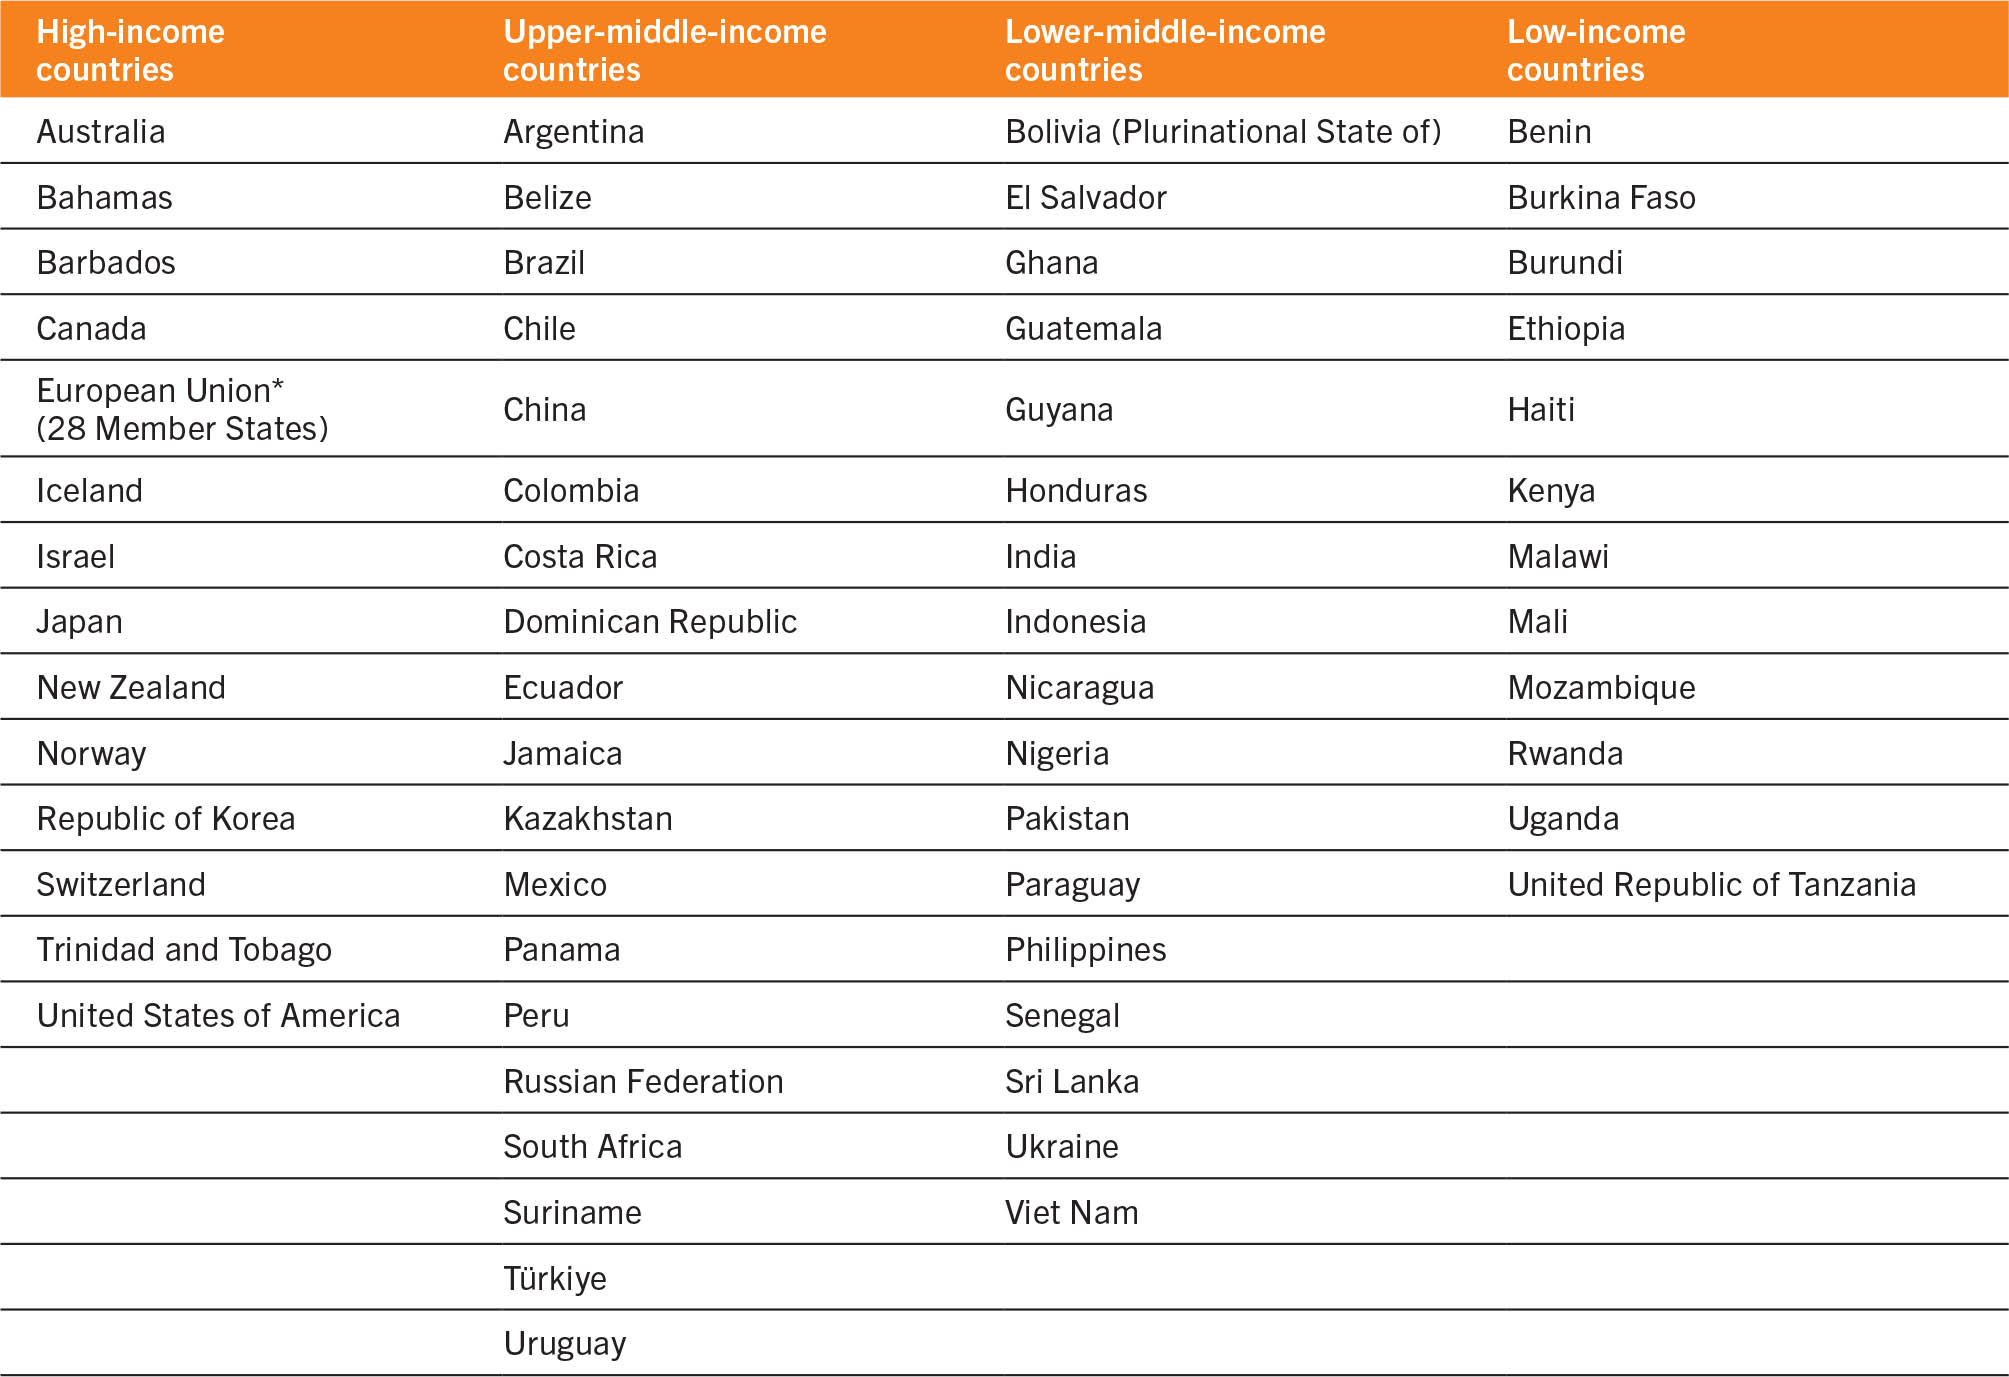
SOURCE: Ag-Incentives. (forthcoming). Ag-Incentives. Washington, DC. Cited 4 May 2022. http://ag-incentives.org
Within the Ag-Incentives Consortium, OECD produces policy support indicators for OECD countries, non-OECD EU Member States, and some emerging economies, namely, Argentina, Brazil, China, Colombia, Costa Rica, India, Indonesia, Kazakhstan, the Philippines, Russian Federation, South Africa, Ukraine and Viet Nam. IDB covers most of the remaining countries in Latin America and the Caribbean, FAO monitors selected sub-Saharan Africa countries, while the World Bank produced indicators for Sri Lanka and Pakistan, in the past. IFPRI harmonizes and aggregates data provided by the various partner organizations.
Indicators of support for general services and for consumers presented in Section 3.1 are calculated by IFPRI and analysed by FAO based on data made available by the member organizations of the Ag-Incentives Consortium. These indicators are not yet published in the Ag-Incentives website.
Methodology
The policy support indicators analysed in Section 3.1 refer to a set of policy instruments that form together the total support to food and agriculture. These policy instruments are listed with their related policy support indicator in Table A4.2. Key principles for their computation are herewith presented.
TABLE A4.2Policy instruments for supporting food and agriculture and related indicators
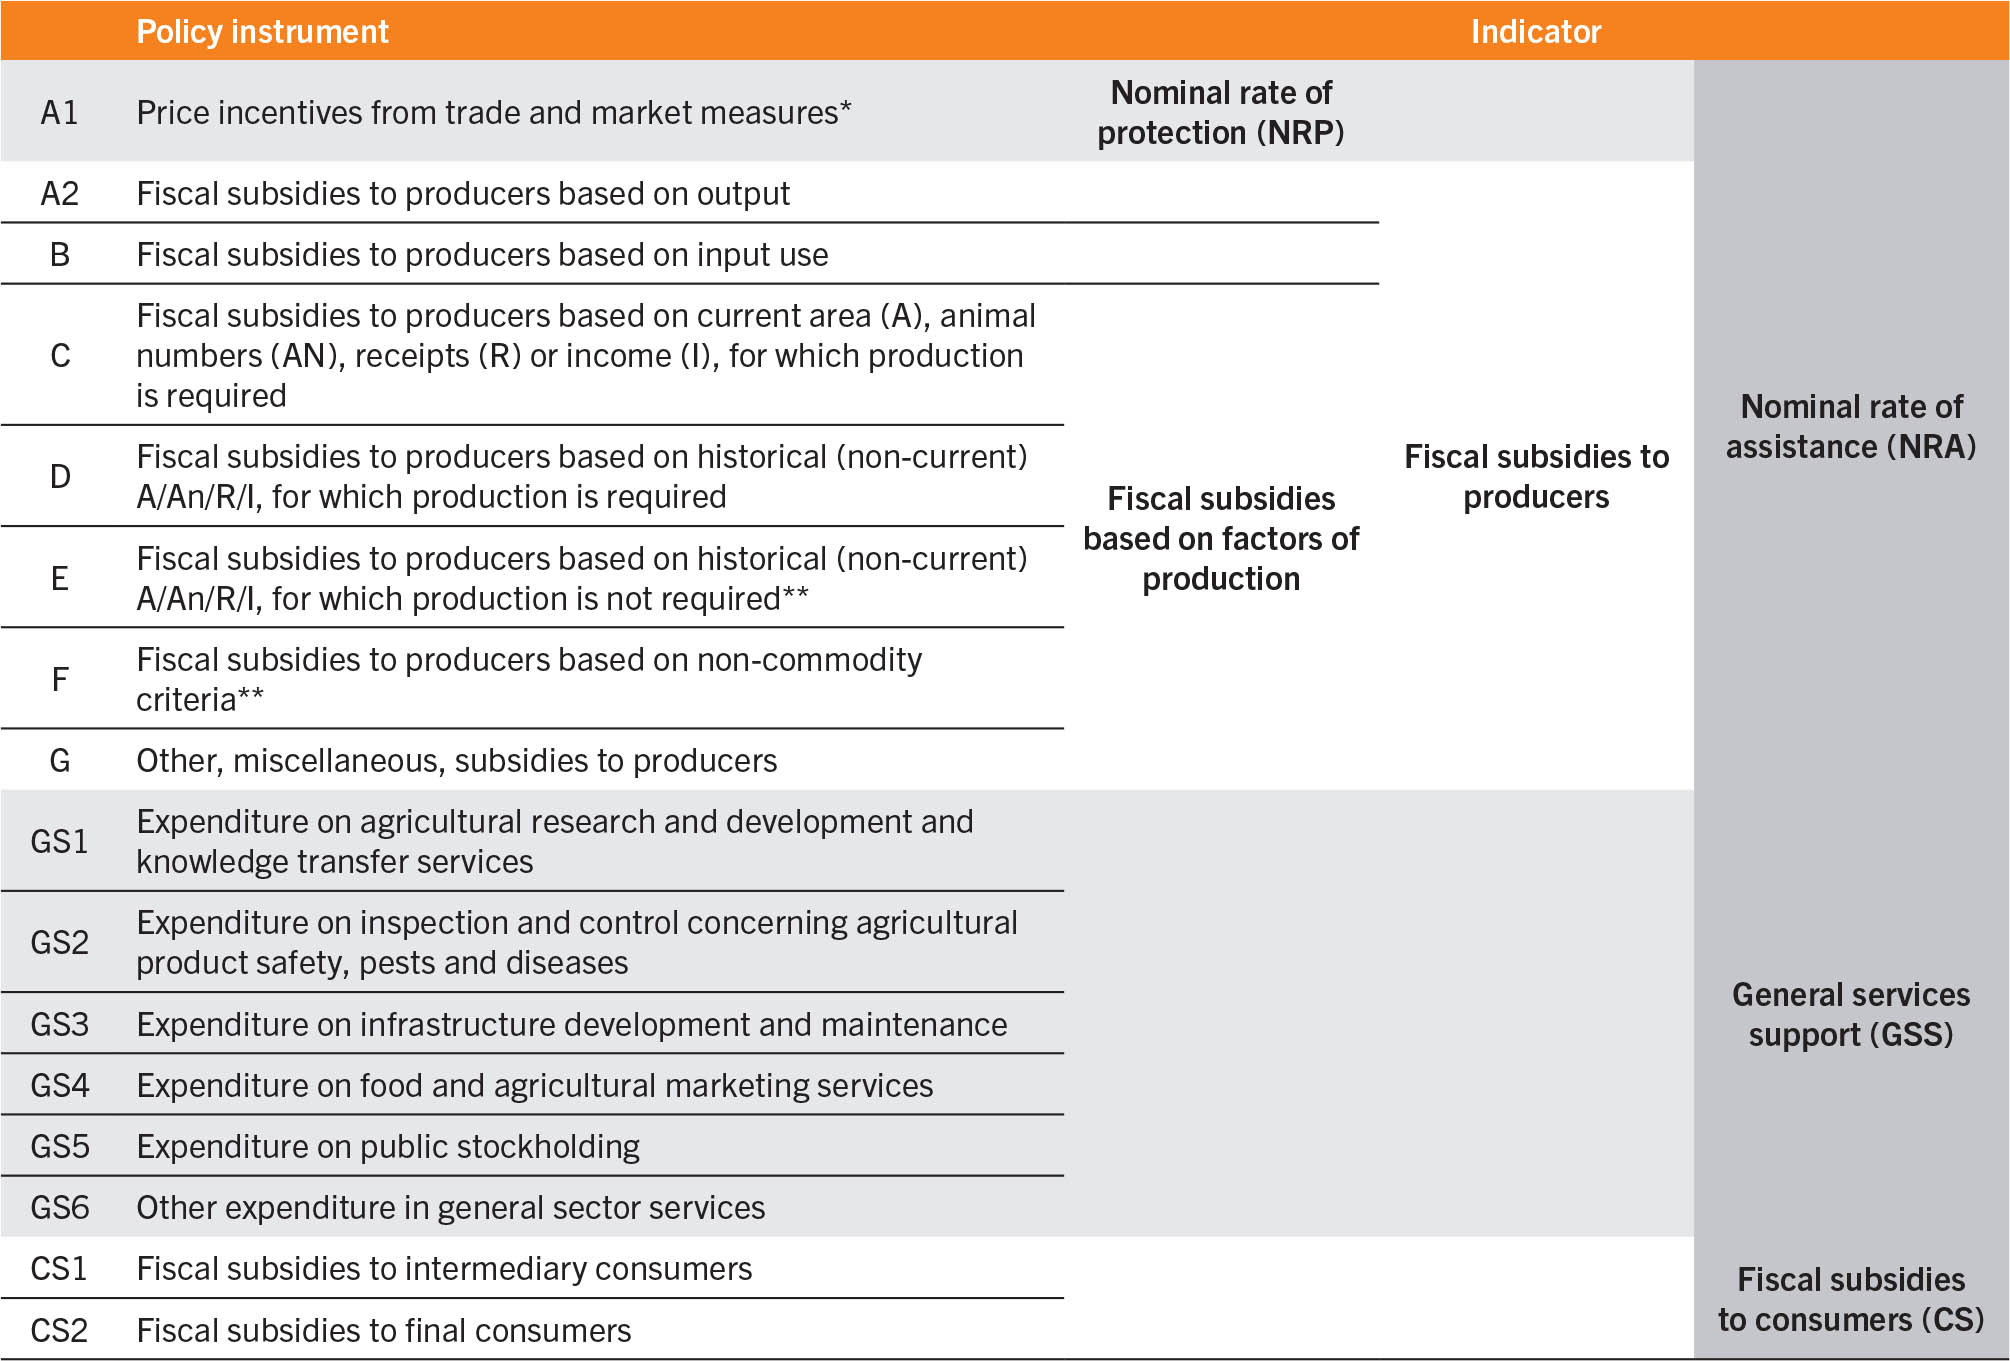
SOURCE: FAO adapted from OECD. 2016. OECD’s Producer Support Estimate and Related Indicators of Agricultural Support. Concepts, Calculations, Interpretation and Use (The PSE Manual). Paris.
Computation of the nominal rate of protection
The NRP (component A1 of the support in Table A4.2) measures the extent to which a set of food and agricultural policies affect the market price of a product relative to the price that would have prevailed had there been no interventions. It is computed as the price difference, expressed as a percentage, between the actual farm gate price and an undistorted reference price constructed from the border price of the commodity.
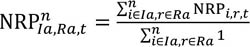
The NRP is therefore defined, for product i, in country r, and year t, as:

The NRP is computed and presented in the Ag-Incentives database using both simple average and weighted average formulas. In this report, we use aggregate simple average NRPs across country income group, defined over product (Ia) and country group (Ra) for year t as:
Computation of the nominal rate of assistance
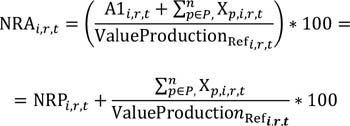
The NRA goes a step beyond the NRP and complements it by capturing, on top of price incentives, subsidies and income transfers provided to agricultural producers from taxpayers and corresponding to categories A2 to G in Table A4.2. The NRA for a country r, year t, and all products “total” is defined as:
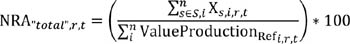
where X denotes the associated transfer from consumers or taxpayers to agricultural producers (i.e. price incentives, category A1, and fiscal subsidies to producers, category from A2 to G in Table A4.2) and the denominator is the sum of values of production valued at reference prices at farm gate.bb
Conceptually, the NRA can be disaggregated along two dimensions. First, along the product dimension, for each product i, the NRAi,r,t can be computed as:
Second, along the policy dimension, the NRA can be disaggregated by type of policy support, and therefore by support provided by trade and market measures (captured by the NRP), by fiscal subsidies linked to output (A2 category), to inputs (B category), and to other factors of production (C, D, E, F and G).bc
For computation of the NRA, the various datasets provided by Ag-Incentives Consortium partner institutions have been reconciled to the OECD methodological framework in order to ensure no omission of data and no double counting. To obtain the same “scope” for fiscal subsidies and price incentives, an NRA indicator was constructed also for “non-NRP commodities”, i.e. those not targeted by trade and market measures that generate price incentives and for which an NRP was not available in the dataset. For the NRP computed at the country level, this is equivalent to considering that non-NRP commodities have the same NRP as NRP commodities; across countries, the average for NRP commodities is used to compute support on non-NRP commodities.bd
The NRA by food group presented in Section 3.1 in Figure 21 was computed accounting also for non-product-specific subsidies, which are those that target a broader food group (e.g. crops or livestock products) or the agricultural sector as a whole. These are allocated at the food group level based on the share in value of production in the relevant aggregate (e.g. share of wheat in staple foods’ value of production for subsidies going to all cereals, or share of wheat in total value of production for subsidies going to all agricultural commodities).
Computation of general services support
The GSS indicator measures monetary transfers (i.e. public expenditure) provided through policies and programmes that target agricultural producers collectively, rather than individually. These policies create enabling conditions for the primary agricultural sector through the development of private and public services, institutions and infrastructure regardless of their objectives and impact on farm production and income, or consumption of food and agricultural products. As such, GSS does not directly alter producer receipts or costs, or consumption expenditures.55
As reported in Table A4.2, GSS is broadly categorized into six subcategories (GS1 to GS6), which add up in the final aggregate GSS estimate compiled for all years available based on the data provided by the various Ag-Incentives Consortium partners. GSS indicators are provided in monetary value (USD) and as a share of value of production by country and by income group.
Computation of subsidies to consumer
The indicator of subsidies to consumers (CS) measures annual budgetary transfers from taxpayers to consumers of agricultural commodities. These transfers (or public expenditure) are provided to: i) intermediary consumers of food (processors, millers, etc.) as a means of compensating them for the higher prices they pay for agricultural products that result from policies that support producer prices (category CS1 in Table A4.2), or ii) final consumers to improve access to food via increased income (e.g. cash transfers) or in-kind food transfers (category CS2 in Table A4.2).
Subsidies to consumers were compiled and harmonized from the data provided by the various Ag-Incentives Consortium partners. CS indicator is provided in monetary terms (USD) and as share of value of production by country and by income group.

