


- ➔ Given the setbacks in hunger, food security and nutrition, and given the economic, health and environmental challenges that the world is facing, making healthy diets more economically accessible for everyone is critical. To move towards this target, it is important to examine the current policy support to the food and agriculture sector in order to identify the most needed policy reforms.
- ➔ Governments support food and agriculture through various policies, including trade and market interventions (e.g. border measures and market price controls) that generate price incentives or disincentives, fiscal subsidies to producers and consumers, and general services support (GSS). These policies may impact every stakeholder within the food environment and, hence, can affect the availability and affordability of healthy diets.
- ➔ Worldwide support to food and agriculture accounted for almost USD 630 billion per year on average over 2013–2018. About 70 percent of this support targeted farmers individually through trade and market policies and fiscal subsidies largely tied (i.e. coupled) to production or unconstrained use of variable inputs.
- ➔ HICs and UMICs largely support agricultural producers both through border measures and fiscal subsidies increasingly decoupled from production. In contrast, in LMICs and LICs, fiscal space to provide subsidies is more limited; moreover, these countries commonly use trade policies to protect consumers rather than producers.
- ➔ Overall, support to agricultural production largely concentrates on staple foods, dairy and other protein-rich foods, especially in HICs and UMICs. Rice, sugar and meats of various types are the foods most incentivized worldwide, while producers of fruits and vegetables are less supported overall or are even penalized in some LICs.
- ➔ Border measures affect the availability, diversity and prices of foods in domestic markets. While some of these measures target important policy objectives (e.g. public revenue generation or ensuring food safety), they can sometimes act as trade barriers for nutritious foods undermining the availability and affordability of healthy diets.
- ➔ Market price controls (e.g. minimum or administered prices) mostly target staple foods like wheat, maize, rice, as well as sugar. While their key objective is to stabilize or raise farm income and ensure enough supplies of staple foods, they may also implicitly discourage the production of other foods that are necessary for healthy diets.
- ➔ In many countries, fiscal subsidies to agricultural producers have increased the availability and reduced the price of staple foods and their derivates (e.g. low-cost foods of minimal or no nutritional value). As a result, the consumption and diversity of unsubsidized or less subsidized commodities such as fruits, vegetables and pulses, have been discouraged as they are relatively more expensive.
- ➔ General services are public goods that can boost productivity in the long term and could contribute to food safety and food availability, and to lower food prices, including for nutritious foods. Unfortunately, expenditures on general services are just a small share of the total support to food and agriculture. These are still lagging behind the actual needs of the sector, especially in LICs and LMICs and are often biased towards staple foods.
- ➔ While subsidies to consumers take a very small share of public support to food and agriculture, nutrition-sensitive policies and programmes supporting consumers have the potential to contribute to increasing consumption of nutritious foods, especially when they target the poorest or the most nutritionally vulnerable people and are accompanied by food and nutrition education.
As shown in the previous chapter, the world is facing major setbacks, with growing numbers of people facing hunger and food insecurity and increasing challenges to malnutrition in all its forms. Many countries are not on track or are even moving further away from reaching their SDG 2 targets. Governments must take actions to reverse this situation. There are many policy options available to this end, but the current recessionary context makes it even more challenging for many governments to increase their budgets and support to the sector. Even under such a tough economic context, however, much can and needs to be done.
Governments will need to be ingenious and start by looking at the current food and agricultural support they provide to evaluate whether this money can be reallocated more cost-effectively and efficiently to achieve development objectives. For governments all over the world, the starting point is to take stock of their support and then assess its cost-effectiveness. In the specific case of SDG 2, it is important that public support to food and agriculture starts showing increasing marginal returns, including in reducing the cost of nutritious foods and increasing the availability and affordability of healthy diets, sustainably and inclusively.
3.1 Stocktaking: What policy support is currently provided to food and agriculture?
How do governments support food and agriculture?
Governments support food and agriculture in different forms and using different types of instruments that affect agrifood systems, as presented in Figure 1 in Chapter 1. This third chapter takes stock of this support, using indicators available for some of the most common policies, which are summarized in Figure 17. These indicators reflect whether the support provided is influencing domestic prices or actors of agrifood systems are benefiting from a direct public budgetary transfer. Other policies explored further below (Section 4.2), including land regulations, food standards and labelling policies, can be part of a government’s policy toolkit for repurposing food and agricultural support to deliver affordable healthy diets.
FIGURE 17Food and agricultural policy support instruments and indicators
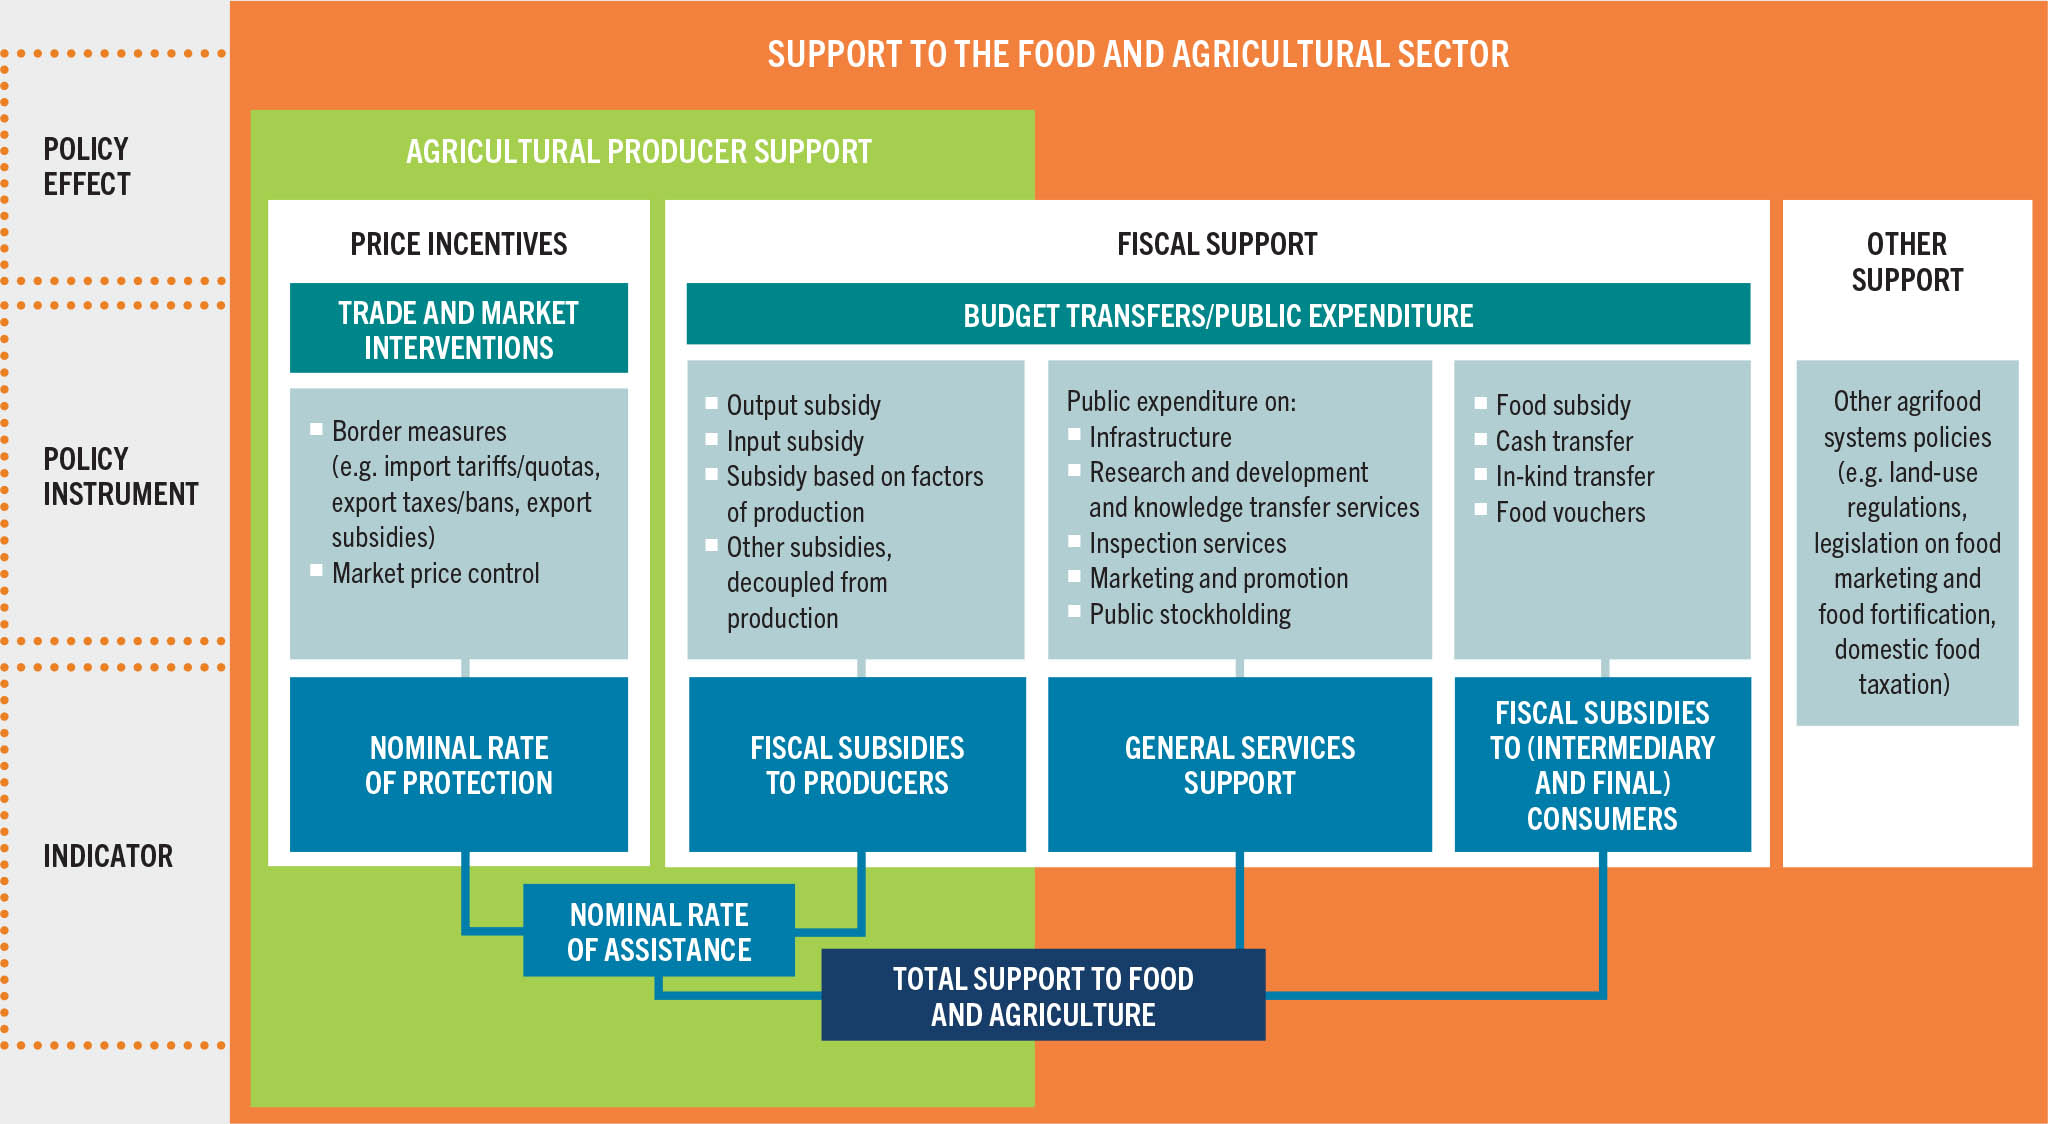
SOURCE: Adapted from FAO, UNDP & UNEP. 2021. A multi-billion-dollar opportunity – Repurposing agricultural support to transform food systems. Rome, FAO.
Trade and market interventions in this chapter include mainly: i) border measures on imports (e.g. tariffs, tariff-rate quotas and non-tariff measures [NTMs]) and exports (e.g. export taxes, bans or licensing, or export subsidies or credits) and ii) market price control measures, such as administered prices (at which governments procure food from farmers) and minimum producer price policies. These interventions increase or depress domestic prices relative to the border price; as such, they can generate price incentives (or disincentives) for farmers. In this report, price incentives are quantified through the nominal rate of protection (NRP) indicator (Box 7).
BOX 7Standard indicators of support to food and agriculture
The nominal rate of protection (NRP) and the nominal rate of assistance (NRA) are the indicators most widely adopted to estimate agricultural support. Their building follows a consistent and consolidated methodology for policy measurement originally developed by OECD,55 that is broadly used by FAO and other international organizations for food and agricultural policy monitoring around the world.56
The NRP quantifies the extent to which trade and market policies raise or lower the producer price of a commodity above or below the international reference price. As such, it measures how these policies incentivize (i.e. protect) or disincentivize (i.e. penalize) producers and provides an estimate of price incentives for a single commodity, a group of products or for the whole agricultural sector.
Fiscal subsidies are budget transfers made by governments in the context of policy measures, projects and programmes to individual actors of the food and agriculture sector, such as farmers (fiscal subsidies to producers) or consumers (fiscal subsidies to consumers).
The NRA measures transfers exclusively made to farmers arising from price incentives generated by trade and market policies (measured by the NRP) and fiscal subsidies. In other words, the price gap at the farm gate (i.e. the difference between the producer price and the undistorted international reference price) and fiscal subsidies to producers (usually commodity specific) are summed up.
The NRP and NRA indicators do not capture policies affecting the price of intermediate inputs. The effective rate of protection or of assistance (ERP/ERA) would be a more comprehensive measure of policy support to farmers, as it also considers the impact of policies that affect the cost of intermediate inputs, and thus quantifies the net or “effective” level of support to farmers in terms of returns.56 The ERP/ERA are not presented here: their computation is a very data-intensive exercise, and the indicator is not available at large scale but rather used to assess commodity specific policies and recommendations.
The main source of data for the NRP and NRA indicators is the Ag-Incentives Consortium database for the 2005–2018 period, which aggregates estimates of agricultural support indicators produced by OECD, Inter-American Development Bank (IDB), World Bank and FAO for 63 countries (considering European Union as a single “country”).
On the other hand, for the GSS indicator – which measures public expenditures to fund the provision of public goods to agriculture – and fiscal subsidies to consumers, which are also analysed in this chapter, data are not present in the Ag-Incentives database. However, the data are derived from the indicators produced by member organizations of the Ag-Incentives Consortium, for the countries they monitor.
Annex 4 provides the detailed list of countries covered in the stocktaking of support presented in this chapter and the methodological details on the computation of the indicators analysed.
Fiscal subsidies to producers are budgetary transfers essentially from taxpayers to individual farmers and can be granted depending on i) output (i.e. transfers made according to the level of the production quantity of a specific agricultural commodity), ii) input use (i.e. transfers made to lower the cost of variable inputs, such as seeds and fertilizers), iii) the use of other factors of production (e.g. capital, labour or land), or iv) non-commodity criteria for which production is not required (e.g. subsidies tied to environmental or landscape outcomes or lump-sum payments to all farmers subject to cross-compliance conditions). When tied to the volume or type of production or to the use of certain inputs, these subsidies are defined as coupled subsidies. On the contrary, subsidies are decoupled when farmers are not required to produce a specific commodity (or amount of it) or use certain inputs to become eligible for the subsidy. The nominal rate of assistance (NRA) indicator captures the effects of these producer subsidies by adding them to the price incentives provided by trade and market measures (Box 7).
General services support (GSS) refers to public expenditure (or budget transfers) for the provision of public or collective goods. As such, these expenditures are not directed to individual agents, such as producers, processors, traders or consumers, but they may benefit production, processing, trade and consumption of agricultural commodities in the longer term. This form of fiscal support can target:
- agricultural research and development (R&D) and knowledge transfer services (e.g. training, technical assistance and other extension services);
- inspection and control concerning agricultural product safety, pests and diseases to ensure that food products conform to regulations and product safety norms;
- infrastructure development and maintenance, such as roads, irrigation and storage facilities;
- public stockholding, including the costs of maintaining and managing reserves through market purchase interventions, such as government procurement from farmers, as well as strategic reserves built for food security purposes;i and
- food and agricultural marketing services and promotion, including collective schemes for post-production facilities and other services designed to improve the marketing environment for agriculture, promote as well as reduce post-harvest losses and to promote market exchange and trade (e.g. promotional campaigns, participation in international fairs). The food and agricultural marketing discussed in this chapter is different from “marketing” that promotes branded products to consumers as defined by the WHA; the latter is part of what is referred to in this chapter as “promotion”.j
The GSS indicator accounts for all the public expenditures funding public goods in the food and agricultural sector (Box 7).
Fiscal subsidies to consumers are budgetary transfers from the government (and more specifically taxpayers) to intermediary (e.g. processors, traders, etc.) or final consumers of food. These transfers are meant to lower the cost of acquiring food (food subsidies), to increase consumer income (e.g. cash transfers) or to provide direct access to food (e.g. in-kind food transfers and school feeding programmes).
Some of the policy instruments described above, particularly border measures and subsidies on output and inputs, have the potential to distort trade. For this reason, multilateral trade rules play a crucial role in setting the global framework that determines the policy space for national agricultural policies. The World Trade Organization (WTO) Agreement on Agriculture (AoA), which resulted from the Uruguay Round of multilateral trade negotiations, produced a comprehensive set of disciplines on member countries’ trade and agricultural policies, seeking to reduce distortions in agricultural markets. The AoA contains binding commitments that place limits on the use of tariffs and subsidies to agricultural producers (Box 8).
BOX 8WTO rules that apply to price incentives and fiscal support
With the conclusion of the Uruguay Round of trade negotiations in 1995, the WTO was established, and the AoA entered into force. The primary objective of the AoA is to discipline agricultural policies that create distortions to production and trade, including tariffs and certain types of subsidies. The AoA constitutes the only legally binding multilateral treaty regulating agricultural trade.
One hundred sixty-four members of the WTO commit to not restricting imports of agricultural products by any means other than tariffs and to keeping their rates within set thresholds determined for each country. These rates are known as bound tariffs. The WTO also sets rules for the application of NTMs that affect imports, such as sanitary and phytosanitary measures (SPS) and technical barriers to trade (TBT).
WTO rules also concern export competition. Adopted in 2015 in Nairobi, the Ministerial Decision on export competition essentially foresees the elimination of export subsidies by all members by 2018, with some exceptions remaining in place until the end of 2022. An extended deadline to 2023 (for members holding a “developing country” status at the WTO) and 2030 (for LDCs and the Net Food-Importing Developing Countries) was provided to phase out subsidies for marketing and transport costs for agriculture exports.
Agricultural subsidies are also regulated by WTO rules. The AoA classifies “domestic support”* that includes subsidies and other types of transfers to producers into two broad categories: those that can be provided without any limit, and those that are subject to limits.
- Transfers that are not subject to any limits are outlined in Annex 2 of the AoA and cover types of support known as “Green Box” measures. Such measures must meet the fundamental requirement that they have no, or at most minimal, trade-distorting effects or effects on production, and must also conform to general and measure-specific criteria as stipulated in the Annex. These include public expenditures on general services (such as research, pest and disease control, marketing and promotion services), government spending on public stockholding for food security purposes and on domestic food aid, and direct payments to producers (for instance, income support that is decoupled from production, payments under environmental programmes and regional assistance programmes).
- In addition, there are no limits on direct payments under production-limiting programmes (the so-called “Blue Box”, used by very few countries).**
- Finally, some specific instruments can be used without limits by developing countries only (outlined in Article 6.2 of the AoA, the so-called “Development Box”), for example, agricultural input subsidies generally available to low-income or resource-poor producers.
Measures that do not meet the criteria for these three “Boxes” (referred to as “Amber Box” measures) are subject to limits that apply to the calculated Total Aggregate Measurements of Support (AMS). “Amber Box” measures are largely considered to distort production and trade.
It should also be noted that apart from input and output subsidies, market price controls implemented through government programmes that purchase from farmers at administered prices may form part of domestic support commitments and would therefore be included in the calculations of the AMS.
- * In agriculture, this is any domestic subsidy or other measure which acts to maintain producer prices at levels above those prevailing in international trade; direct payments to producers, including deficiency payments, and input and marketing cost reduction measures available only for agricultural production.57
- ** Only the European Union (2018/19), Iceland (2020) and Norway (2020) have notified the use of this box in their most recent submissions.
How does support to food and agriculture affect agrifood systems?
Governments may support food and agriculture through the policy instruments introduced above to pursue multifaceted objectives of agrifood systems in the economic, social and health realms. Among these, food and agricultural support has the potential to affect the cost and affordability of healthy diets, by shaping production and consumption choices as well as affecting food supply chain dynamics and food environments, as summarized in Figure 1 in Chapter 1. Both its objectives and the ultimate impact of this policy support will largely depend on the country-specific context, i.e. income and development level, production structure and volume, agricultural sector performance and relevance for the economy, consumption patterns, political economy considerations, impact of climate change on agriculture, and the occurrence of emergencies (e.g. humanitarian crises, conflicts) that can affect safety and livelihood of the population.
Trade and market interventions, for instance, are usually adopted in a bid to support producer prices and thus farm income (e.g. import tariffs), or to keep prices low for consumers (e.g. export bans). LICs and MICs often use some of these measures to protect their farming sector against import competition, or to influence domestic prices for ensuring adequate supplies and access to foods for consumers. However, border measures, beyond affecting trade flows, also influence domestic food production practices and diversity of available foods (or lack thereof) and can therefore imply important trade-offs. By generating a gap between the domestic producer price and the border price of a specific agricultural commodity, these measures can, for example, favour producers of certain crops and potentially discourage production of others. Measures such as tariffs also affect consumption decisions as they raise the price of imported foods, as well as their domestic substitutes to consumers.
Fiscal subsidies to producers are generally provided to boost agricultural production and productivity and support farm income by reducing production costs. In MICs and LICs, these transfers are often used to correct for certain market failures, such as the limited availability of inputs, capital, or credit. However, when these subsidies are coupled to the use of inputs or to the volume of production, like border measures, they can greatly influence which commodities are produced and marketed and/or the type and use of inputs with important implications beyond the farm sector for the climate, food security and nutrition, equity and efficiency.
If provided without any condition, input subsidies may, for example, lead to overuse of agrochemicals and natural resources, and promote monoculture, with negative consequences on the environment and the sustainability of agrifood systems.58,59 As discussed in more detail in Section 3.2, such subsidies can also hinder positive nutritional outcomes, in some cases by disproportionately fostering the production of cereals in the long term at the expense of other foods that contribute to healthy diets, such as fruits and vegetables.3 Moreover, these subsidies can be regressive if larger farms are more capable than smallholders of meeting requirements necessary to accessing them. These potentially negative implications are aggravated by the fact that, since these policies bring about immediate and often very tangible effects, they are politically difficult to remove, once in place.
Contrary to most types of border measures, fiscal subsidies can also drain public resources that could instead be invested in areas where returns may be higher and benefits are longer lasting, for example, in general services such as R&D, infrastructure, or marketing facilities – thus hindering efficient and more sustainable use of often-limited public funds.60,61 However, it should be recognized that if designed with sustainability objectives in mind, fiscal subsidies may contribute to better production and livelihoods.62
Subsidies decoupled from production and public expenditure on general services, especially in countries where they are low and significant productivity gaps persist, are less likely to hinder sustainability and can even promote it. These forms of support can promote production and productivity enhancements, food safety, connectivity between farmers, markets and consumers and can contribute to food security and improved nutrition in the longer term. They may also affect farm revenues or consumption expenditure indirectly. Though the positive impacts of many general services take longer to materialize compared to, for example, border measures, price control policies or input subsidies, returns of general services investments on agricultural growth and poverty reduction are recognized to be higher.63,64,65 Properly designed, inclusive and sustainable investments in R&D, marketing services and infrastructure can also be effective in lowering the cost of nutritious foods and improving access to healthy diets, as discussed in detail in Section 3.2.66
Subsidies to consumers, including food subsidies to processors or traders, and those provided through social protection programmes that include cash transfers, food vouchers and in-kind food transfers including school feeding programmes, can have positive effects on different outcomes.k These subsidies, if carefully designed, can increase total household food consumption, improve dietary diversity and nutritional outcomes, as well as decrease poverty rates (see Section 3.2 for more analysis).67 They can also affect agricultural performance, since they have the potential to alleviate liquidity and credit constraints affecting investment and production decisions.67,68
Policy support to food and agriculture is significant but differs by policy instrument
Worldwide support for the food and agricultural sector accounted for almost USD 630 billion a year on average over 2013–2018.l Support targeting agricultural producers individually averaged almost USD 446 billion a year in net terms (i.e. accounting for both price incentives and disincentives for farmers), which corresponds to about 70 percent of the total sector support and about 13 percent of the global value of production, on average.m About USD 111 billion were spent yearly by governments for the provision of general services to the sector, while food consumers received USD 72 billion on average every year (Figure 18).
FIGURE 18Level and composition of global support to food and agriculture (USD billion, average 2013–2018)
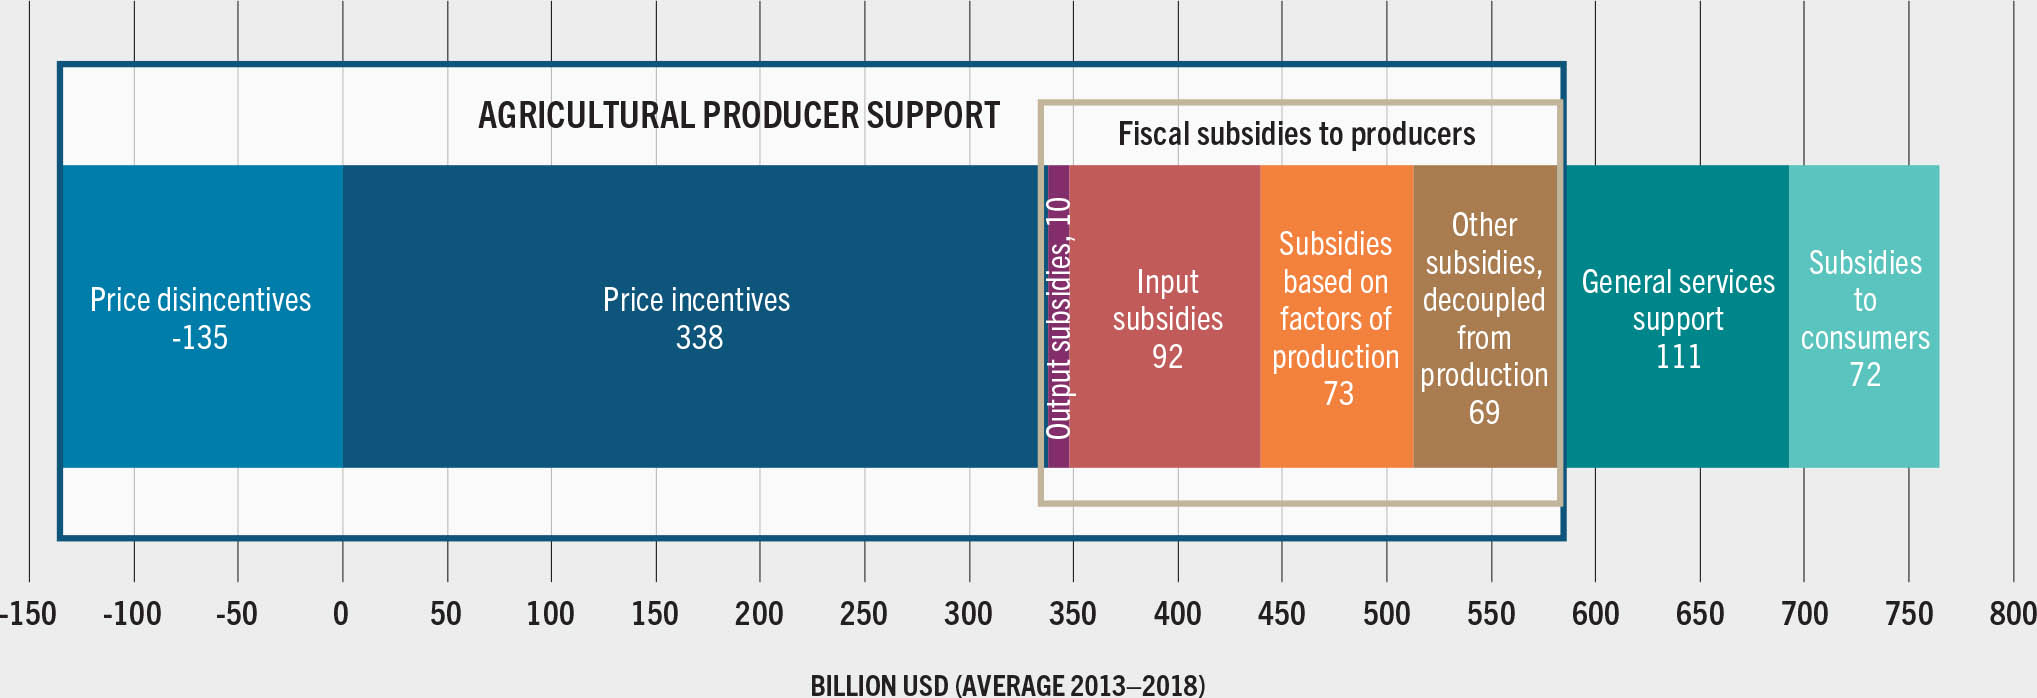
Half of the support provided to farmers individually were price incentives (USD 202 billion net), while the rest (USD 245 billion) was in the form of fiscal subsidies, the majority (USD 175 billion) being linked to production or unconstrained use of variable inputs. Less than one-third of fiscal subsidies to producers (USD 69 billion) were decoupled from production (Figure 18).
Policy support to food and agriculture differs across country income groups and across time
The analysis of support by policy instrument indicates that, overall, price incentive measures and fiscal subsidies have been most widely used in HICs and are becoming increasingly popular across some MICs, in particular those at the upper level of income. LICs have historically implemented policies that generate price disincentives for farmers to facilitate consumers’ access to food at a lower price. These countries have limited resources to provide fiscal subsidies to producers and consumers as well as to fund general services that benefit the whole of the food and agricultural sector.
Producer support
Despite wide variations within this group, HICs have always accounted for the bulk of support to agricultural producers around the world. Seen through the NRA, in 2005 this support accounted for about 40 percent of these countries’ total production value, but the rate has significantly decreased since then, to 24 percent in 2018 (Figure 19). The level of producer support in HICs has mainly been driven by decreasing price incentives (i.e. as captured through the NRP) as part of a long-term trend that started in the 1990s and in particular, since the conclusion of the Uruguay Round of multilateral trade negotiations that led to a reduction in tariffs applied by WTO members. Moreover, from a political economy perspective, technology improvements with reduction in production and labour costs in agriculture may have also contributed to making public support less necessary in these countries. Despite the declining rate of assistance and despite providing a not negligible share (6 percent) of subsidies decoupled from production, most support to farmers in HICs still consists of trade measures that distort prices and subsidies coupled to production.
FIGURE 19Nominal rate of assistance as a share of production value, by instrument and income group
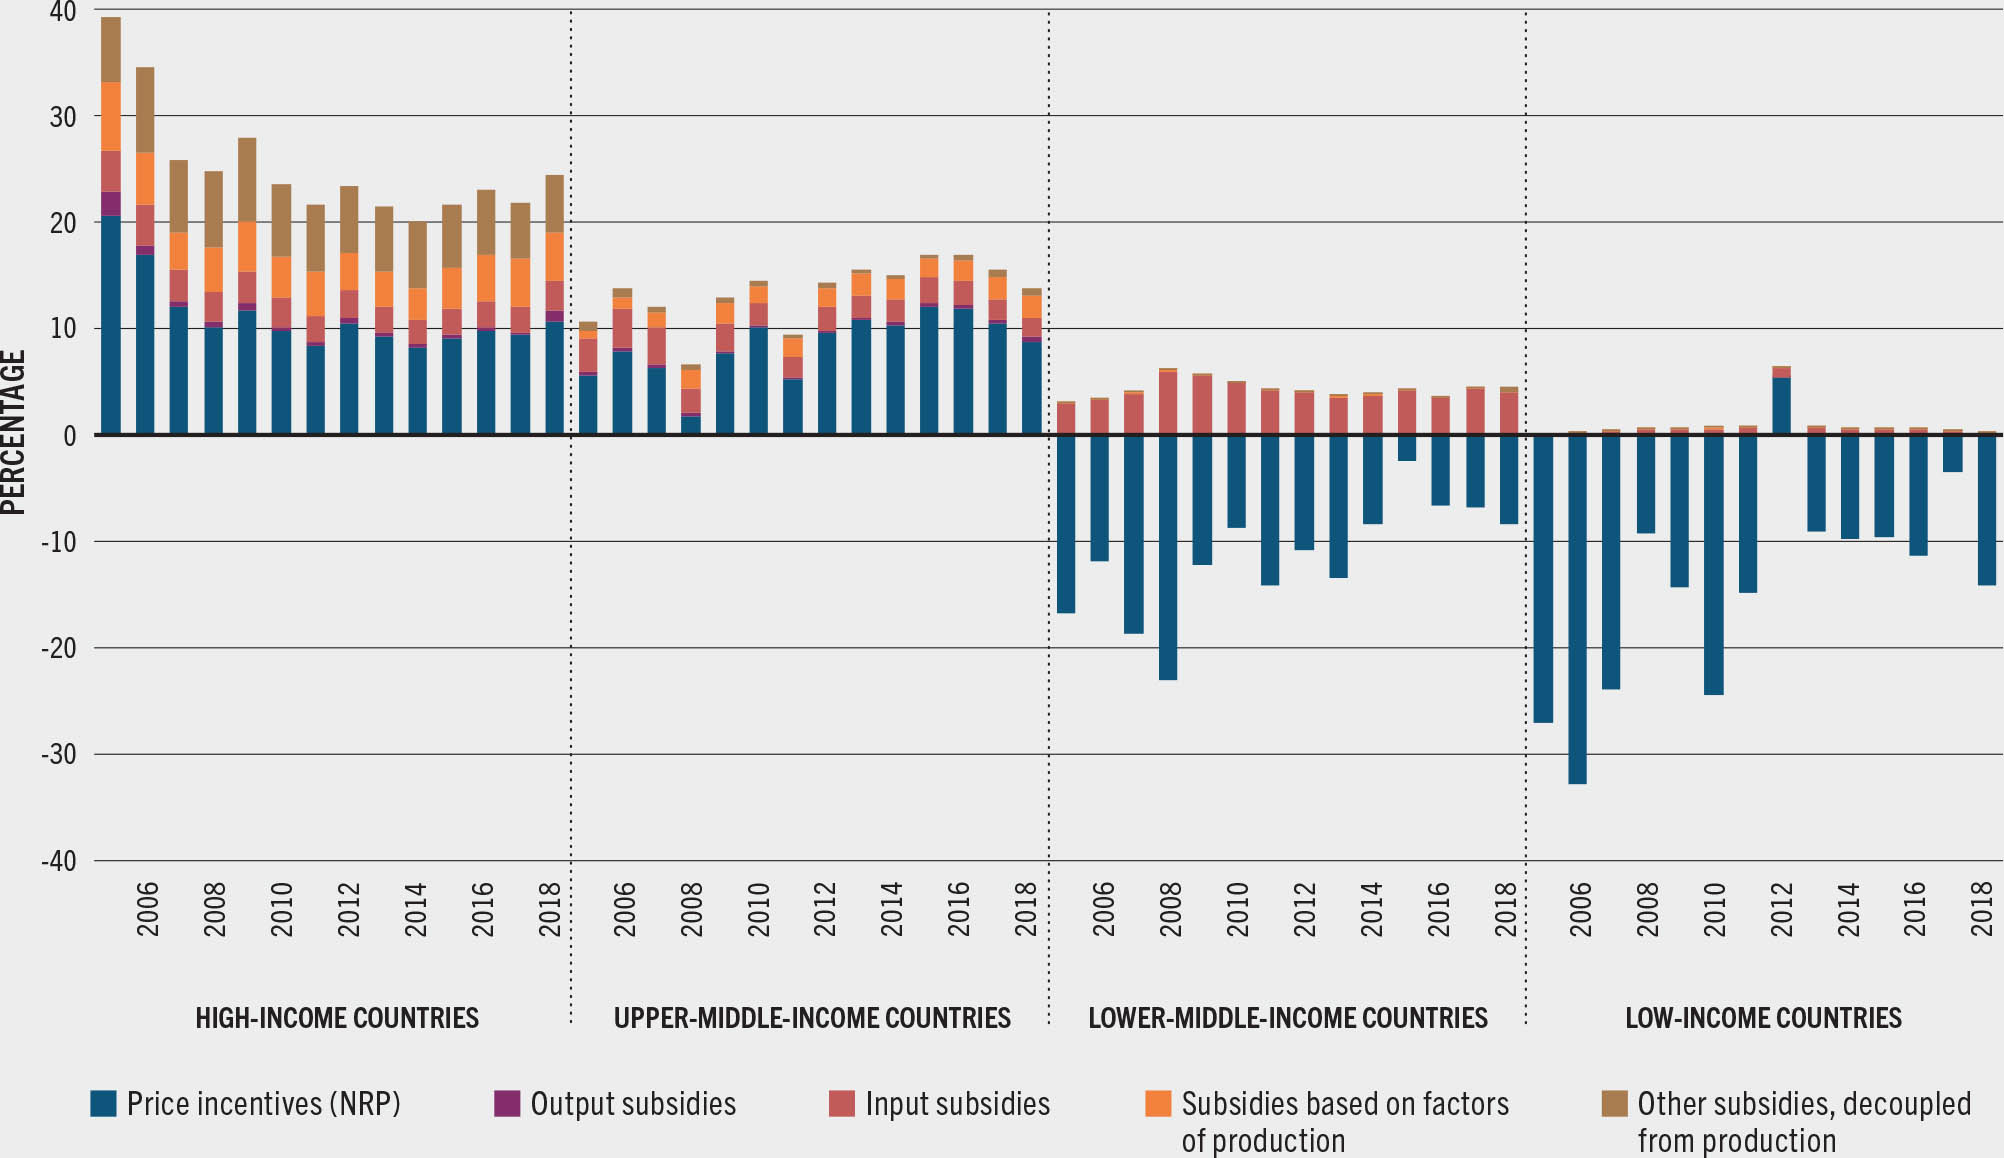
In MICs, the profile of producer support is quite different between the UMICs and LMICs subgroups. In the former group, especially since the late 1990s, agricultural support has increased significantly, particularly in the form of price incentives generated mainly by import tariffs or other trade restrictions. In the most recent years, this support, measured by the NRA, accounted for about 16 percent of agricultural production value (Figure 19). Out of this, fiscal subsidies to agricultural producers accounted for just 5 percent of total value of production – versus almost 13 percent in high-income countries (Table 6).
TABLE 6Support to the food and agricultural sector as a share of value of production, by country income group, average 2013–2018
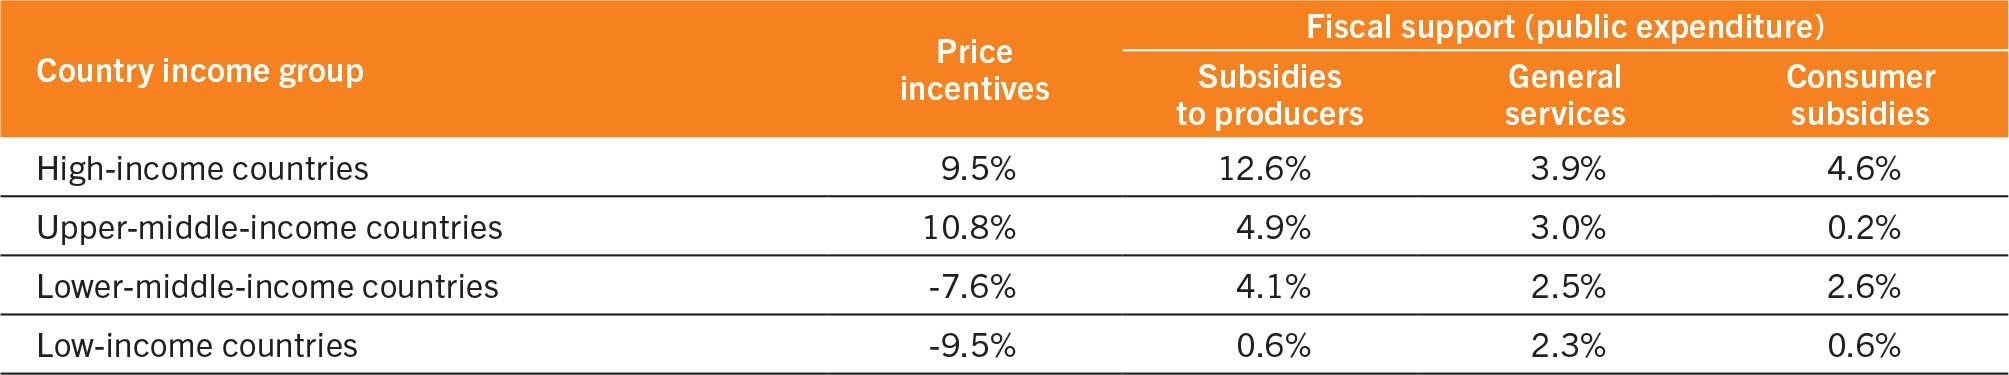
China largely influences the aggregate support estimates in this subgroup, given that seen as a share of value of production, the country’s support is not only rather high in its own right but also relative to the other countries. China’s rate of assistance turned positive in the early 1990s and has followed an upward trend since then, driven by increasing price incentives, especially for cereals, to attain the country’s self-sufficiency and food security goals.1 Historically, fiscal subsidies to farmers have been small relative to price incentives, but these have expanded since 2005 and now account for about 5 percent of the country’s total value of production.
LMICs and LICs have historically protected poor consumers using trade and market policies that keep domestic prices low, implicitly penalizing the farming sector. Farmers in LMICs have consistently faced price disincentives (as reflected in a negative NRP) but have been in some cases supported through input subsidies. Other fiscal subsidies are barely used in these countries (Figure 19). The magnitude of the negative rate of assistance in LMICs has diminished recently, averaging -4 percent in the latest 2013–2018 period, up from the -10 percent in 2005–2012.
The most prominent example of a LMIC is India, where the food and agricultural policy has historically focused on protecting consumers by ensuring affordable food prices, through export restrictions (on wheat, non-basmati rice, and milk, among others) and through marketing regulations around pricing and public procurement, public food stockholding and distribution of a vast range of agricultural commodities.69 As such, farmers have constantly faced price disincentives in aggregate terms (i.e. negative NRPs). Input subsidies and expenditure on general services such as in R&D and infrastructure have been widely used as a means of compensating them for the price disincentives generated by trade and market measures, and for boosting production and self-sufficiency in the country.
A similar policy support pattern is seen in most LICs. Price disincentives have been narrowing also in these countries, from -17 percent on average in 2005–2012 to -9 percent in 2013–2018 (Figure 19). Policies supporting prices and production of cereals, as a staple food, largely drove this trend, in a bid to ensure food security in the framework of self-sufficiency strategies launched in the aftermath of the 2007/08 food price crisis. Staple food production is also the target of the few fiscal subsidies, usually on inputs, provided to farmers in these countries.
LICs overall devote small shares of their total public budgets to food and agriculture, compared with the other country income groups, even though agriculture remains an essential sector for economic growth and job creation. Fiscal support accounts for a small share of total support to the sector: on average, subsidies to agricultural producers accounted for just 0.6 percent of the total value of production against 4 to 5 percent in MICs and 12.6 percent in HICs (Table 6). A similar trend is also evident in the expenditure for general services, as analysed below, despite commitments by African countries, for example, to allocate at least 10 percent of their total public expenditure to agriculture under the Comprehensive Africa Agriculture Development Programme.70 Reasons for the limited fiscal support to farmers in LICs are: i) their very narrow fiscal space – which is largely determined by limited revenue growth, substantial debt burden and multiple sectors competing for scarce resources, but also ii) the low budget execution rates (one fifth of budgets on food and agriculture are left unspent), especially for donor-funded expenditures, where the share of unspent funds is substantially high (around 40 percent).n 70 As such, policy repurposing might not be a viable or effective solution in LICs. However, future research could identify additional measures (e.g. international transfers financed by fiscal measures in high-income countries) to support LICs in addressing challenges related to public investments in food and agriculture.
General services support
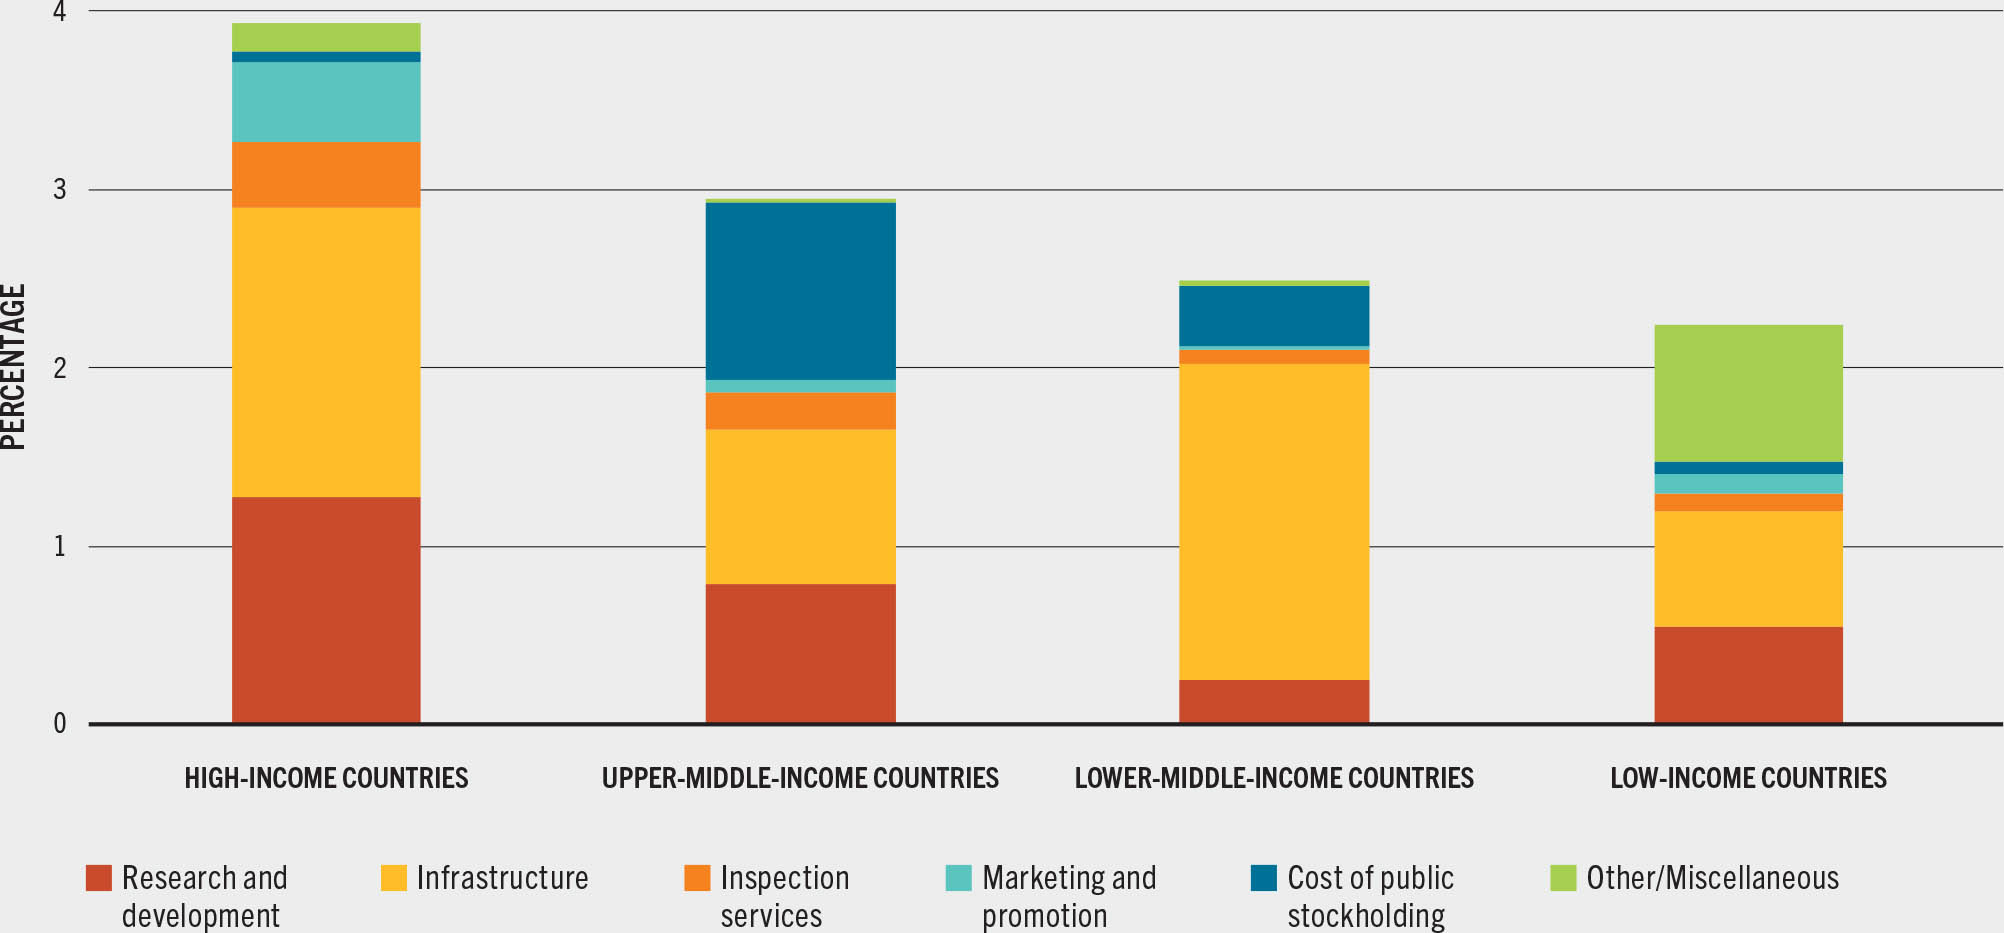
Aligned with the trend described so far, also GSS support, expressed as a share of value of production, is lower in LICs (2 percent) compared to HICs (4 percent) (Table 6). The composition of expenditure on general services is also quite diversified across income groups (Figure 20). Services mostly funded by governments in HICs are infrastructure, R&D and knowledge transfer services; yet, inspection and marketing promotion activities are also important areas targeted by public investments. In MICs, a sizeable amount of public spending covers costs of public stockholding programmes. These are very common in Asia and the Pacific (e.g. China, India, Indonesia, Pakistan and the Philippines) and, though their implementation mechanisms may differ, they are overall aimed at providing remunerative prices to farmers, stabilizing markets, and ensuring food security for consumers.71 Amounts spent in GSS are relatively lower in LICs; support is concentrated on funding agricultural infrastructure construction and maintenance (with a special focus on irrigation), on R&D services, as well as on expenditures earmarked for forestry, land management and environmental protection (mapped in the miscellaneous category) (Figure 20).70
FIGURE 20Composition of general services support as a share of value of production, by income group and type of service, average 2015–2018
Consumer support
In line with the fiscal support described above, two-thirds of the world’s fiscal subsidies to consumers (either final or intermediary, such as that of processors) were disbursed in HICs. On average in 2013–2018, these accounted for 4.6 percent of the value of production in HICs, while in LICs they were less than 1 percent of the total value of production (Table 6). Again, this is an indication that HICs have more means and resources to financially support agrifood systems actors than LICs do. On the contrary, LICs tend to opt more for trade and market interventions to keep domestic prices low in favour of consumers, as discussed above. Subsidies to intermediary consumers are usually provided only in HICs and UMICs, notably in Norway, Iceland, the United States of America and Kazakhstan.
Subsidies to consumers provided in LICs and MICs most often take the form of in-kind or cash transfers under social protection programmes. India and Indonesia, for example, provide substantial subsidies to final consumers under the Targeted Public Distribution System for grains in India, and the food assistance programme (BPNT) based on electronic vouchers for rice, in Indonesia. In some sub-Saharan Africa countries, subsidies to consumers have recently increased, in some cases to the detriment of producers, who have received less financial support under existing budget constraints; cash transfers, in-kind transfers and school meal programmes have instead been expanded.70
Policy support differs across food groups and commodities
In line with the discussion above, countries with higher levels of income provide support to all food groups, and particularly to staple foods, including cereals, roots and tubers, followed by dairy and other protein-rich foods.o In HICs, support within these three food groups is equally provided in the form of price incentives and fiscal subsidies to producers. On the contrary, for fruits and vegetables and fats and oils, fiscal subsidies (accounting for about 11 percent of the value of production) were substantially larger than price incentives, on average, during 2013–2018 (Figure 21).p
FIGURE 21Nominal rate of assistance as a share of the value of production by income and food group, average 2013–2018
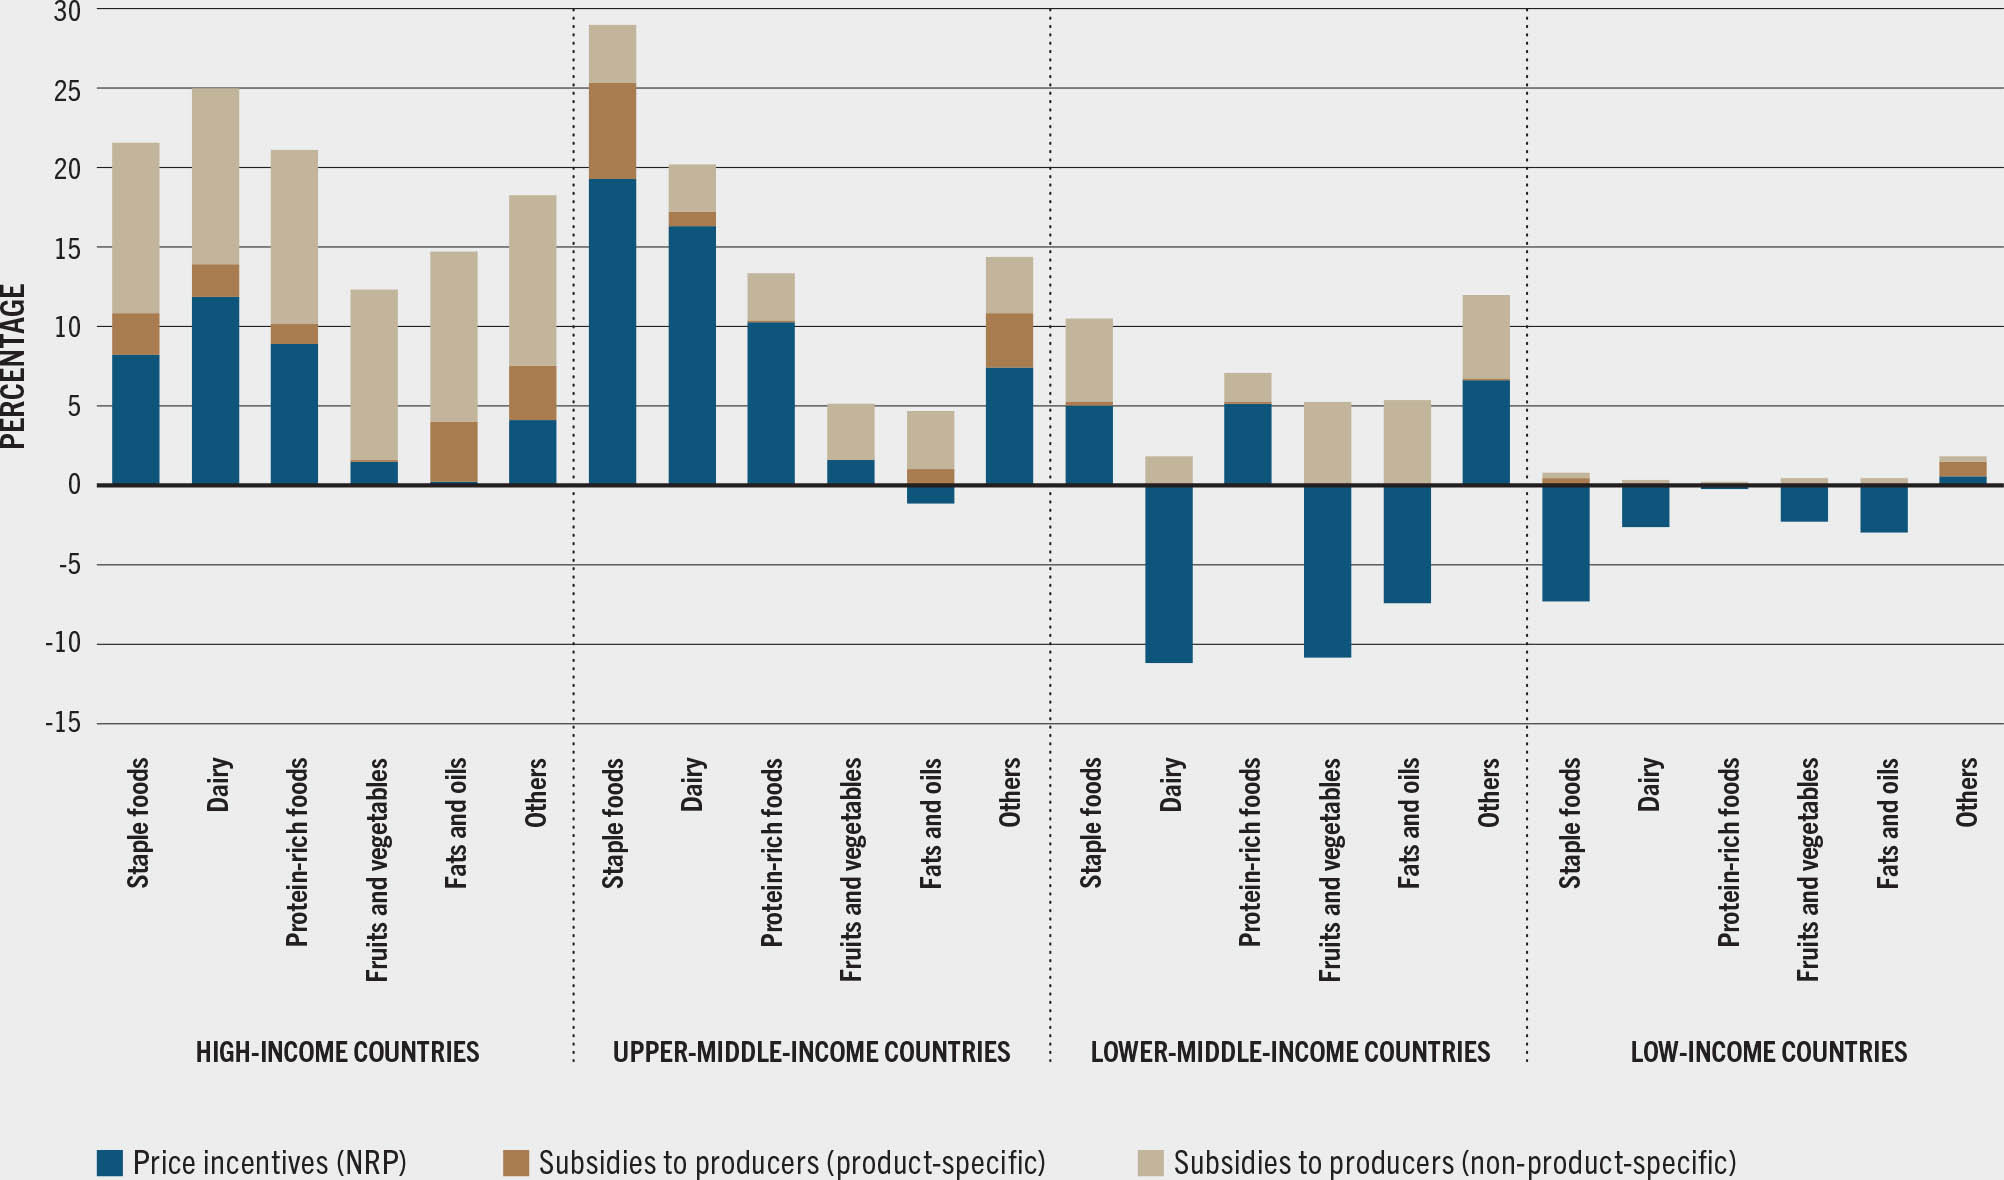
SOURCE: FAO based on data from OECD, FAO, IDB and World Bank compiled by IFPRI.
The persistence of the staple cereals focus in the food and agricultural policy in most countries around the world is not a new trend. Policies that promoted staple crop productivity, including price incentives, crop specific input subsidies, and grain procurement for food security stocks, have been common since the Green Revolution period.72 Historically, these measures have contributed to hampering farmer incentives for the diversification of their production systems, as analysed more in detail in Section 3.2.73,74
LMICs consistently penalize production of most products through policies that depress farm gate prices, but these countries provide fiscal subsidies to farmers, especially for staple foods, fruits and vegetables as well as fats and oils. Price incentives are negative for most food groups in LICs, ranging from minus 7 percent on staple foods (mainly cereals) to 1 percent for other crops (e.g. sugar, tea, coffee) (Figure 21). These countries have little space to support farmers through fiscal subsidies, as discussed above.
A deeper scrutiny can be done by looking at support that targets single food products.q
Rice, sugar and meats of different types are among the most supported commodities worldwide (Figure 22). The main measures used to support these products are trade and market policies that alter prices and generate price incentives for farmers. As already anticipated, these measures are not always aligned with healthy diets and can potentially generate (relative) disincentives towards producing more fruits and vegetables, for example, as farmers are prompted to produce crops that face lower competition and fetch higher prices. Moreover, in LICs and LMICs, some fruits and vegetables, such as bananas, mango and onions fetched price disincentives on average over the 2013–2018 period (Figure 22). While this may raise a concern on the supply side, it should be recognized that in a scenario of relatively low domestic prices (i.e. lower than the international reference, as defined by the NRP), these products may result more affordable for consumers.
FIGURE 22Nominal rate of assistance as a share of THE value of production for selected most targeted food products by income group, average 2013–2018
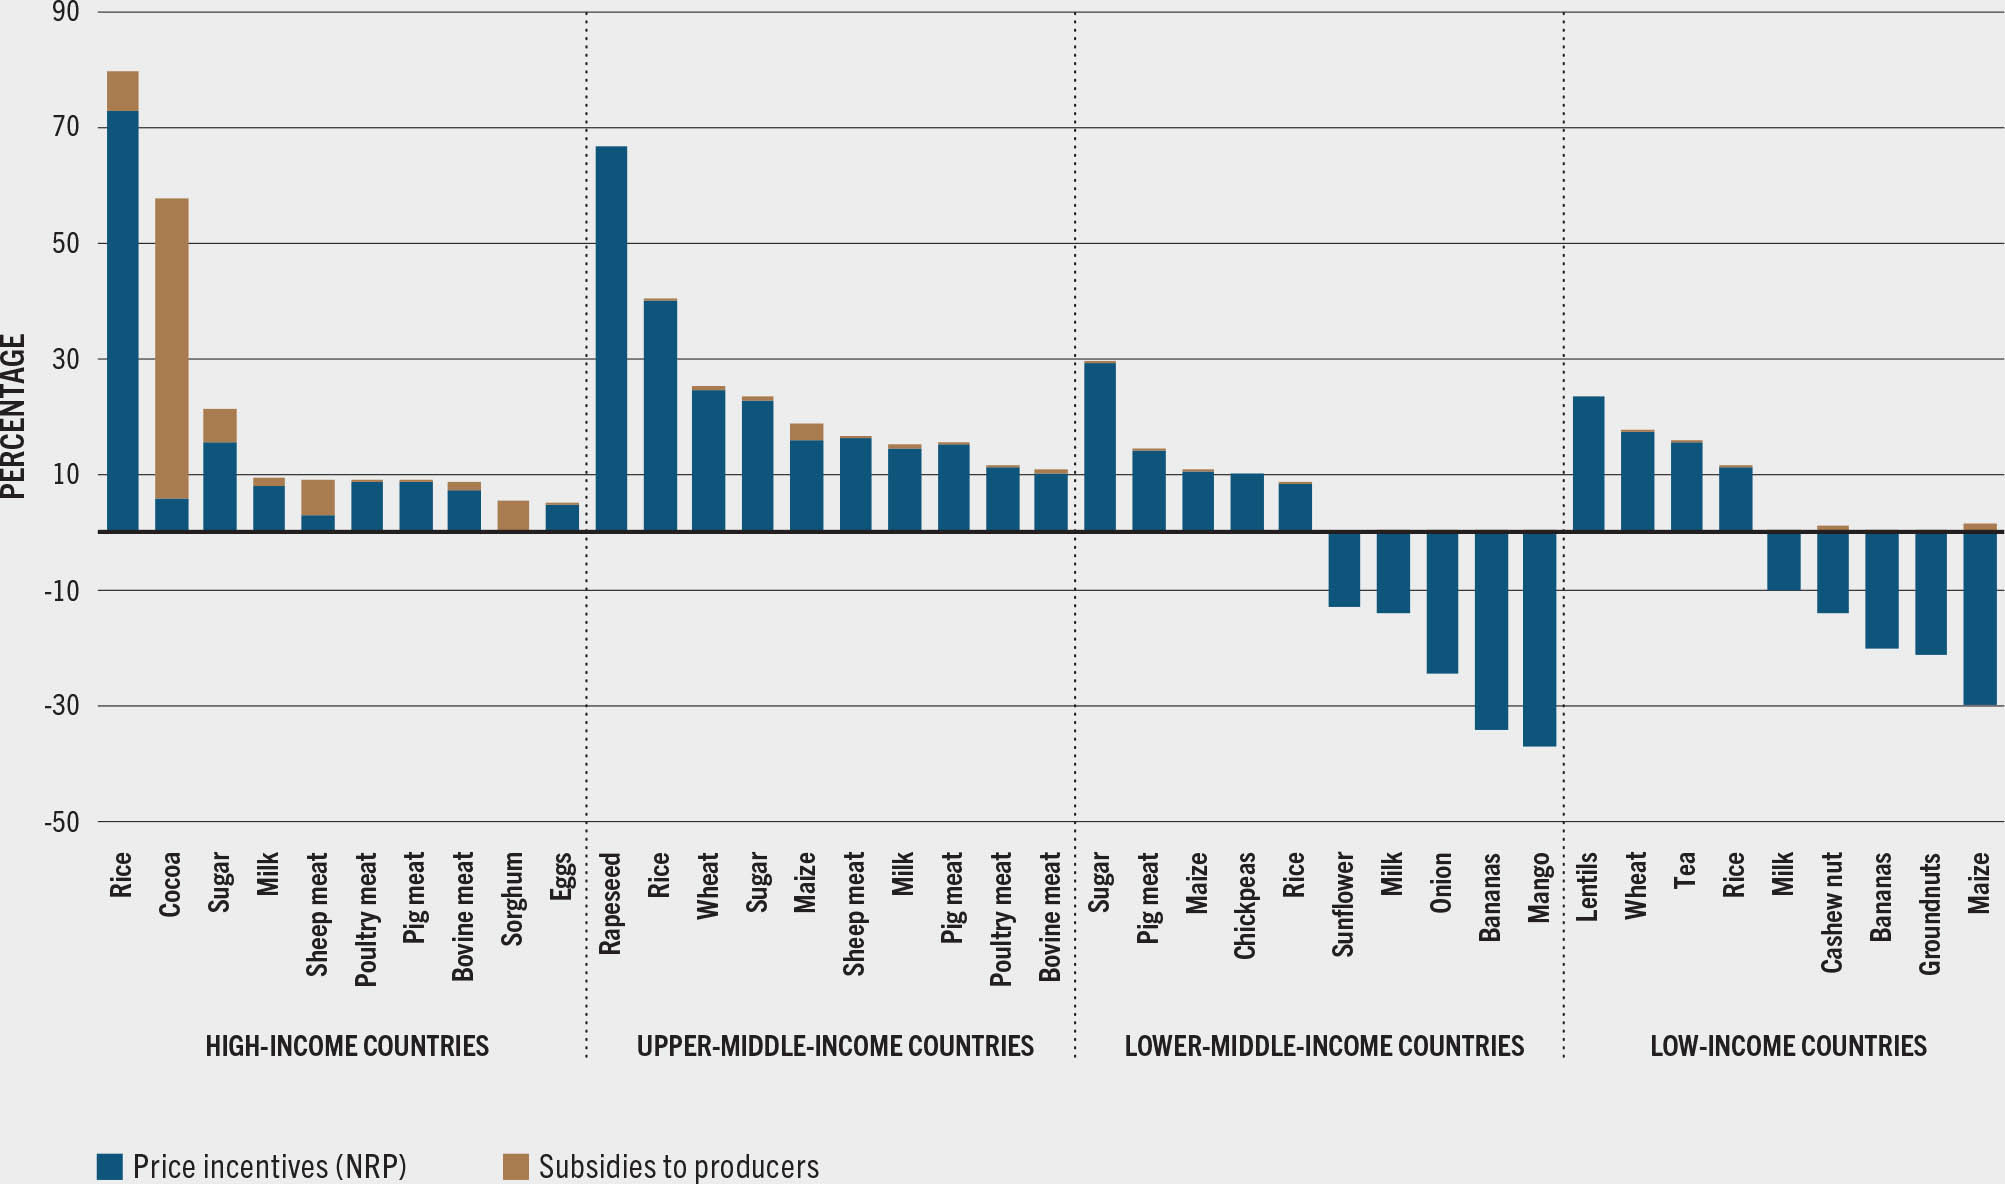
Rice production receives significant support worldwide: farmers enjoy relatively high price incentives across all the income groups (Figure 22). These incentives represent over 70 percent of value of production in HICs, mainly driven by some Asian countries (e.g. Japan and South Korea) that largely support production of this key commodity through border and domestic price control measures. Rice tends to be a high emission-intensive commodity, which provides calories but few micronutrients. However, being a staple food for more than 3 billion people in the world, it requires careful and special consideration when policymakers assess the most appropriate policy reform and repurposing options, in order to avert trade-offs with food security. The same consideration applies to animal source foods products like milk and beef, which can contribute to improving the diet quality and nutrition in some LICs and LMICs contexts but are often overconsumed in HICs with negative health implications. It is precisely in HICs and UMICs that production of these livestock-derived products is relatively more supported, as indicated by an average NRA of about 11 percent across these two income groups during 2013–2018.
Some LICs have provided price incentives to selected staple foods, i.e. wheat and rice but disincentives for others, like maize (Figure 22). In some cases, input subsidies schemes were also implemented, notably for maize (mostly in Malawi) and wheat (in Rwanda) production. Price incentives for rice were particularly high in Eastern African countries (e.g. Burundi, Rwanda and Uganda) in the 2013–2018 period. Milk, cashew nut and bananas were instead among the most penalized products (Figure 22).
Other commodities of critical importance for the livelihoods, food security and nutrition of billions of people around the world are fishery and aquaculture products, for which, unfortunately, there are no consistent policy support indicators. Fish and other aquatic foods play a pivotal role in healthy diets; in many countries, indeed, they provide the animal protein required to consume the least costly healthy diet. Small-scale artisanal fishers and fish workers produce a large portion of these foods and represent a large proportion of the workforce in many countries (Box 9). Overfishing is a pressing challenge for agrifood systems and the environment. Fishery subsidies could exacerbate overfishing as well as illegal and unequal practices. There is an urgent need for gathering and developing data to understand the level and type of public support directed to these products important for healthy diets, as repurposing strategies in many countries must account for these considerations (Box 9).
BOX 9The importance of fish and fishery products for healthy diets and the role of fisheries subsidies in policy repurposing efforts
Fish and other aquatic foods are a unique source of essential omega-3 fatty acids, as well as being rich in vitamins, minerals and animal high-quality proteins. Moreover, consumption of aquatic animals with plant-source foods increases the absorption of nutrients such as zinc and iron.75,76 Despite reductions in the use of small fish in animal feeds, there is still competing use of these fish for fishmeal and fish oil, which may in some regions impact nutritionally vulnerable populations. In many areas of the world, small indigenous fish species are consumed entirely (including head, eyes, bones and viscera) and are an essential source of micronutrients. In comparison, species such as tilapia, tuna or salmon, are often consumed only for their fillets, which represent from 30–70 percent of the fish, with the remainder being discarded.77,78 Simple processing technologies can convert heads and bones into nutritious and delicious products, for example, tuna frame powder, which was found to be highly acceptable to schoolchildren in Ghana when added to traditional recipes in school meals.79
SMALL IN SCALE, BUT BIG IN VALUE: SMALL-SCALE FISHERIES CONTRIBUTION TO HEALTHY AGRIFOOD SYSTEMS
At least 40 percent of global fisheries catch is estimated to originate from small-scale fisheries, and about one-third of this comes from inland fisheries.80 Small pelagics, such as sardines, herrings and anchovies, and other pelagic fish such as mackerels, scads and tunas account for almost 50 percent of the total marine small-scale fisheries catch. Small-scale fisheries play a critical role in the realization of the right to adequate food: over 95 percent of all small-scale landings are destined for local consumption.81 Consumption of fish from small-scale fisheries landings could provide 50 percent of the recommended daily intake of omega-3 fatty acids to 150 million women in Africa and 773 million women in Asia.*80
The livelihood of about 492 million people in the world depends – at least partially – on small-scale fisheries. Small-scale fisheries account for 90 percent of all of those employed in capture fisheries along the value chain, and 53 million people engage in subsistence fishing with a significant share being women. As such, small-scale fishers and fish workers hold enormous potential to promote transformative changes in how, by whom and for whom fish and fishery products are produced, processed and distributed – with positive ripple effects felt throughout the global food system. The International Year of Artisanal Fisheries and Aquaculture 2022 will be a unique opportunity to showcase the implementation of the Voluntary Guidelines for Securing Sustainable Small-Scale Fisheries in the context of Food and Poverty Eradication.81
FISHERIES SUBSIDIES NEGOTIATIONS AT THE WORLD TRADE ORGANIZATION (WTO)
Overfishing is a pressing challenge for sustainable development, as it can harm the aquatic environment through, for example, species’ extinctions and variations in oceans’ biomass levels and can prejudice vulnerable communities who depend on fish and fish products for nutrition, food security and livelihoods. Fisheries’ subsidies that increase fishing capacity and potentially incentivize overfishing contribute significantly to this problem. These may also fuel unfair competition between large fleets and individual artisanal fishermen, fostering inequality.
Fisheries’ subsidies discipline has been the subject of the WTO Negotiating Group on Rules since the Doha Development Agenda in 2001, with an agreed negotiating mandate in 2005, during the WTO Hong Kong Ministerial Conference. This mandate calls to eliminate subsidies for illegal, unreported and unregulated (IUU) fishing and prohibit certain forms of fisheries’ subsidies that contribute to overcapacity and overfishing, stating that special and differential treatment for developing and LDCs is an integral part of the negotiations. After the WTO mandate was established, the global call on the 2030 Agenda set the SDGs, with SDG 14.6 targeting prohibition and elimination of fisheries’ subsidies, based on the same pillars negotiated at the WTO and even reinforcing its mandate.
The associated benefits of having multilateral rules on fisheries’ subsidies dealing with IUU fishing, overcapacity and overfishing go beyond trade and the environment. Repurposing fisheries’ subsidies through a holistic approach based on scientific evidence can increase the availability of sustainable and nutritious food, as well as reduce the unfair competition that some small-scale fisheries often face.

