


The cost and affordability of a healthy diet, and the change of these indicators from 2019 to 2020, are reported in Table 5 by region, subregion and country income groups, following the World Bank classification of countries by income level for 2021,33 based on per capita gross national income (GNI) in 2020. Income classification is provided for all countries except Anguilla and Montserrat. In FAO, IFAD, UNICEF, WFP and WHO (2021),15 results were presented using the 2019 income classification. Therefore, the composition of countries by income groups may have changed between 2019 and 2020.
Cost and affordability are also reported at the country level in Table A3.1 for the reference year 2017 when the ICP data were released, as well as for 2018, 2019 and 2020 when the two indicators are updated using the methodology described in Annex 2E. In 2018–2020, the cost indicator was updated for 166 of the 169 countries with information available in 2017, while affordability was updated for 142 of the 143 countries. For two countries, Argentina and Zimbabwe, cost and affordability in 2018–2020 are used to estimate aggregate indicators shown in Table 5 but are not reported in Table A3.1. To update the costs in 2018–2020, PPP exchange rates for both countries are imputed, but they may not thoroughly reflect the severe currency devaluation and economic instability that the countries have experienced.
TABLE A3.1The cost and affordability of a healthy diet by region, subregion, country and country income group, 2017–2020

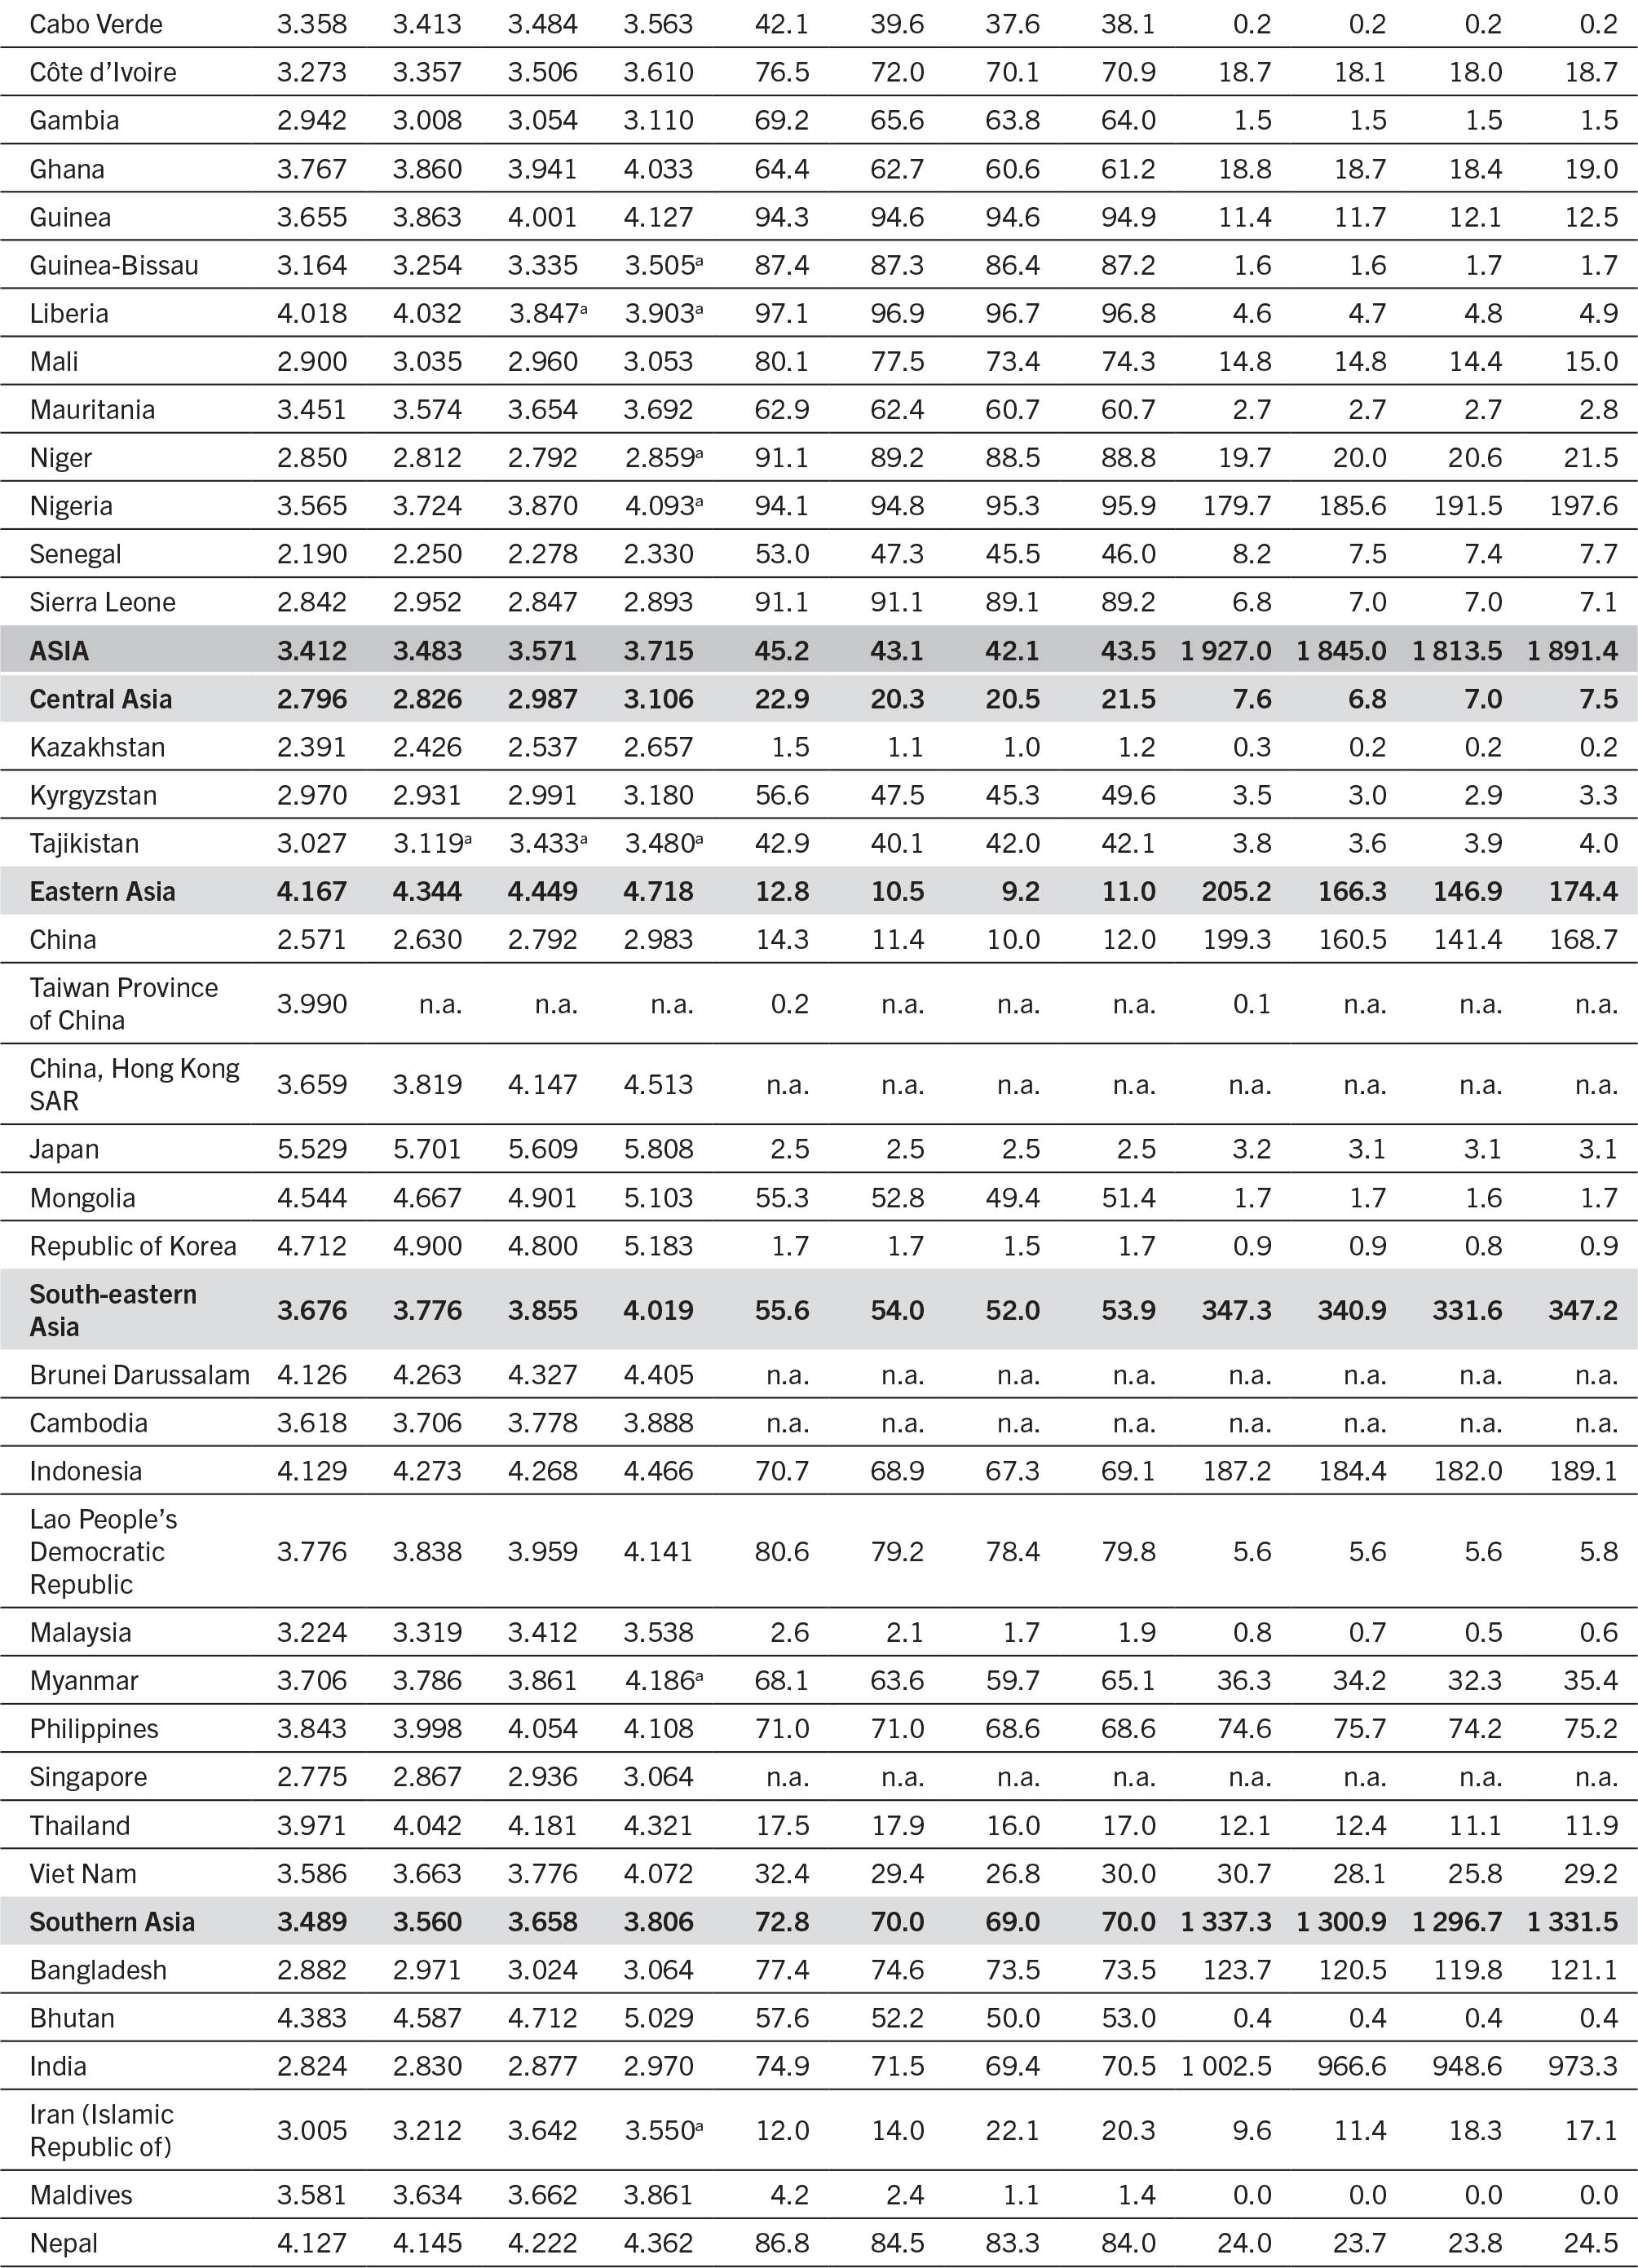
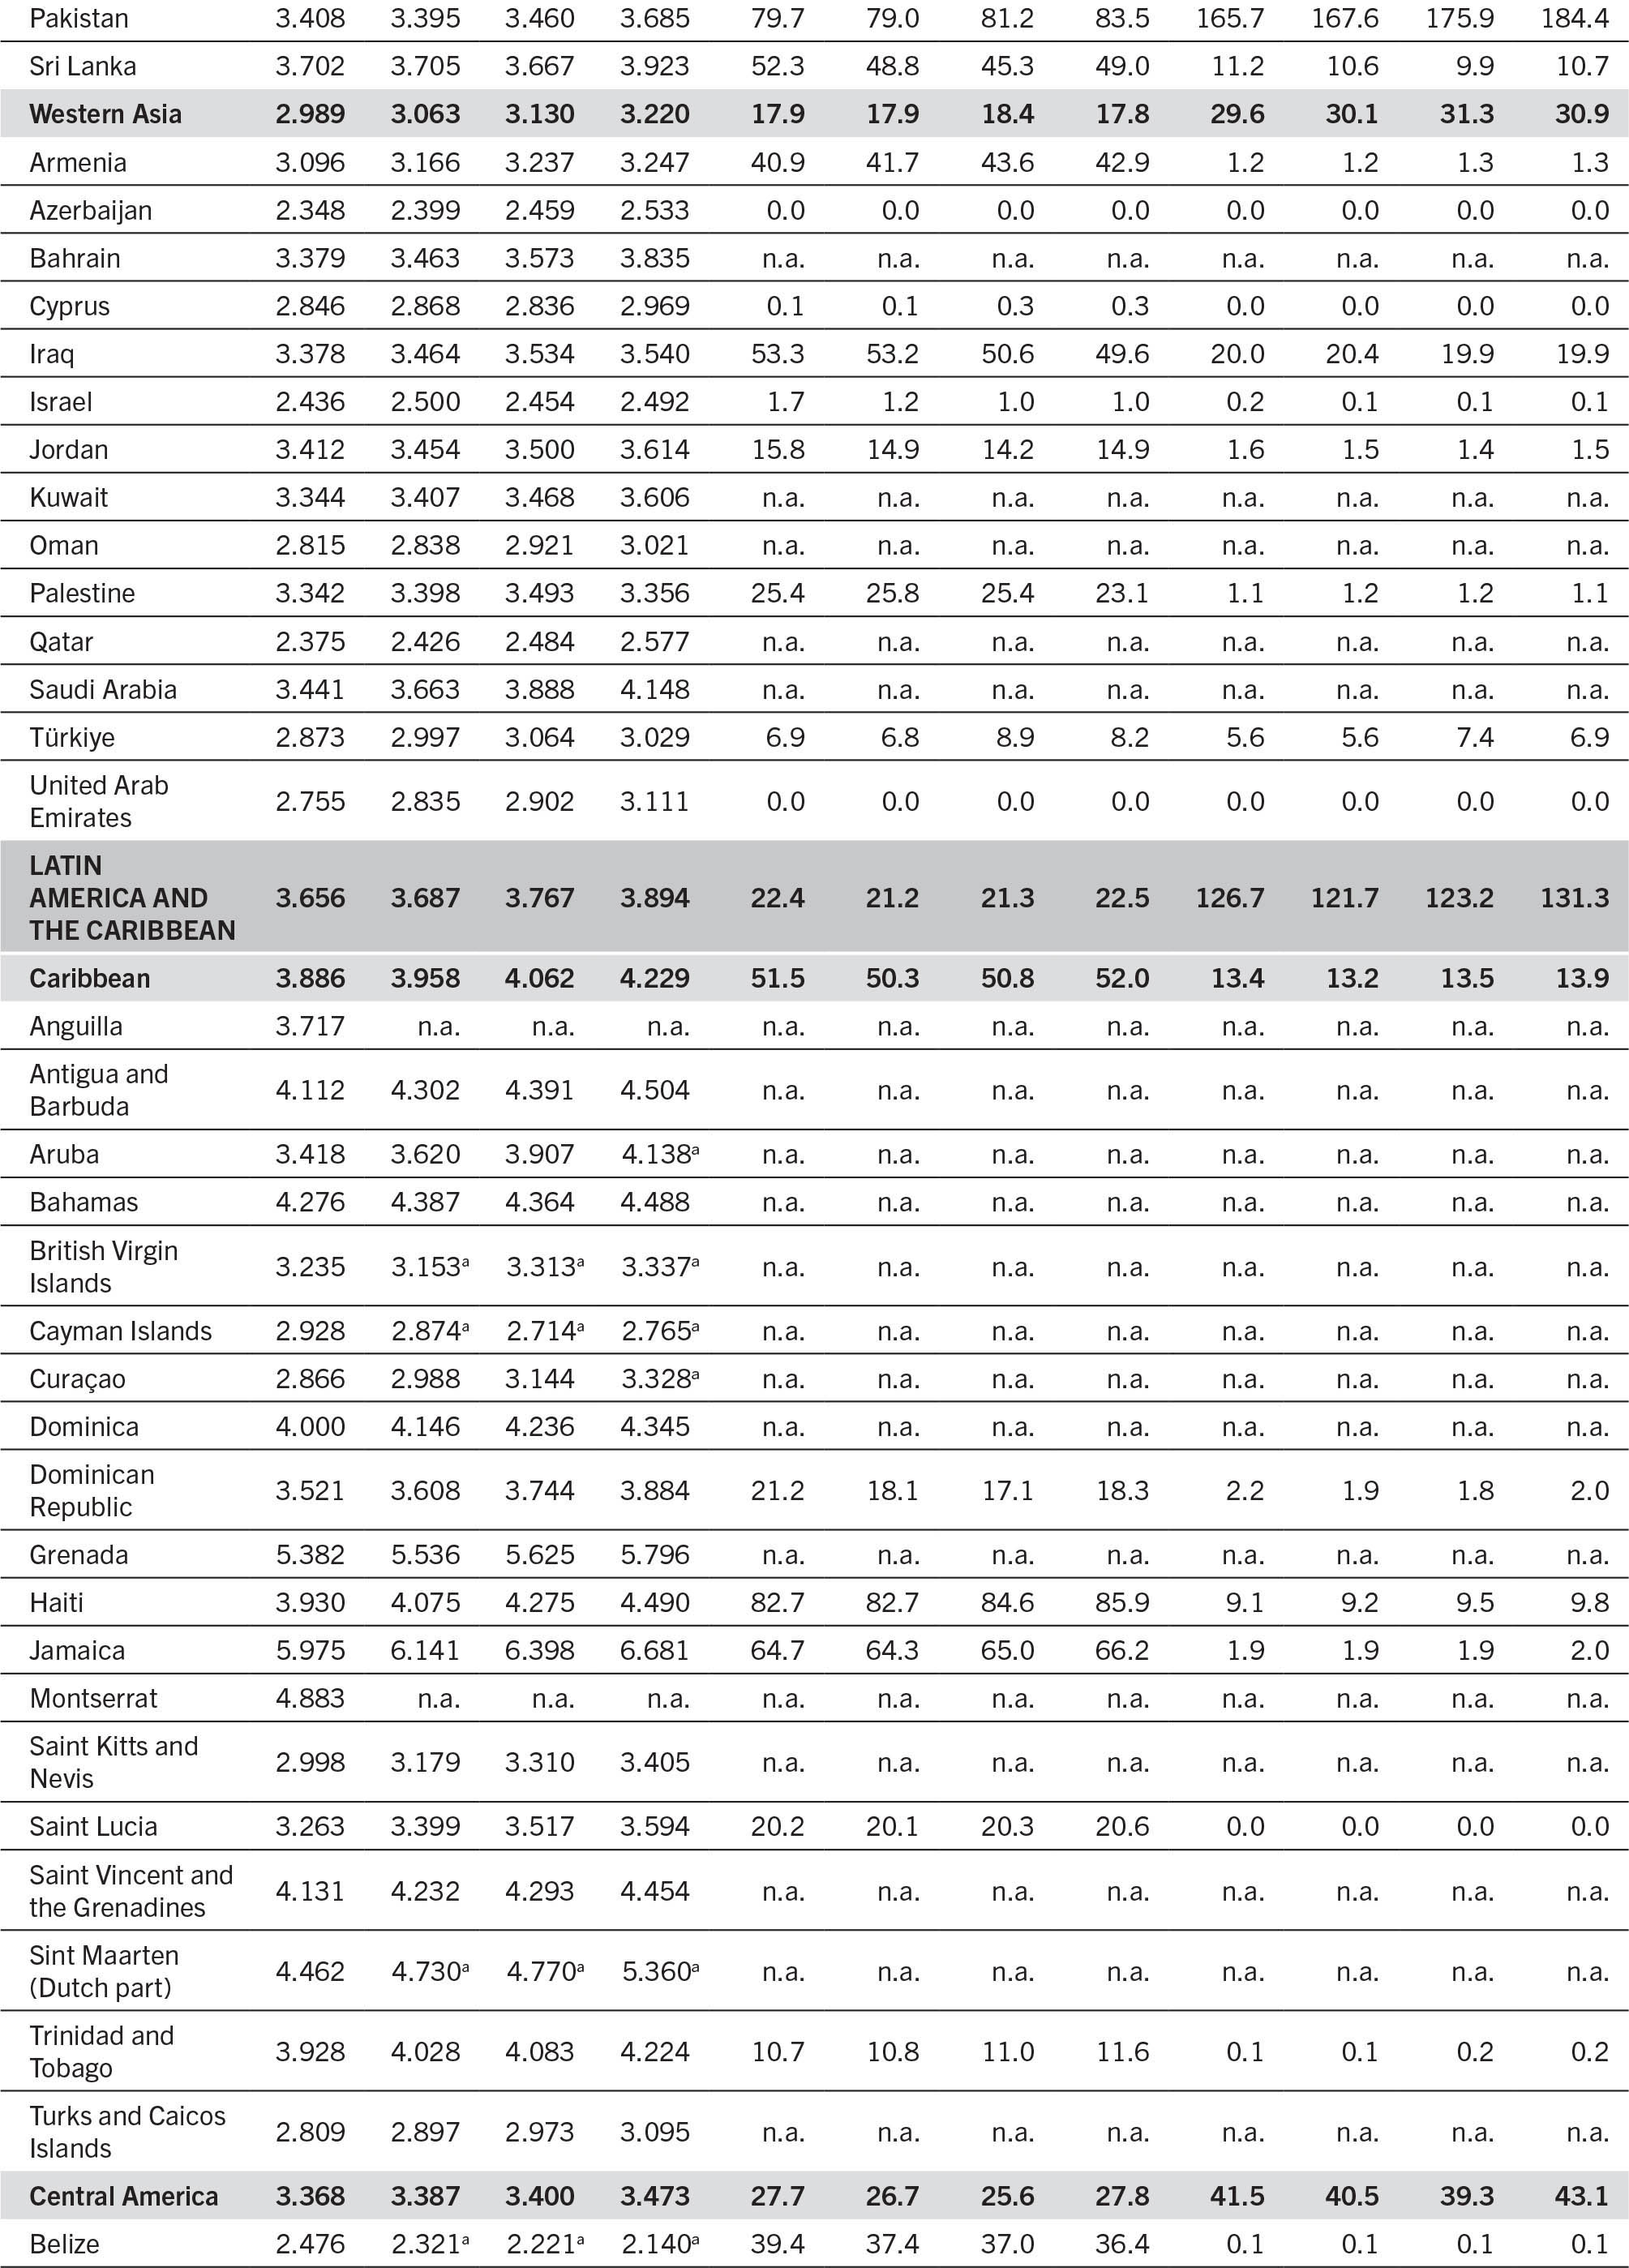
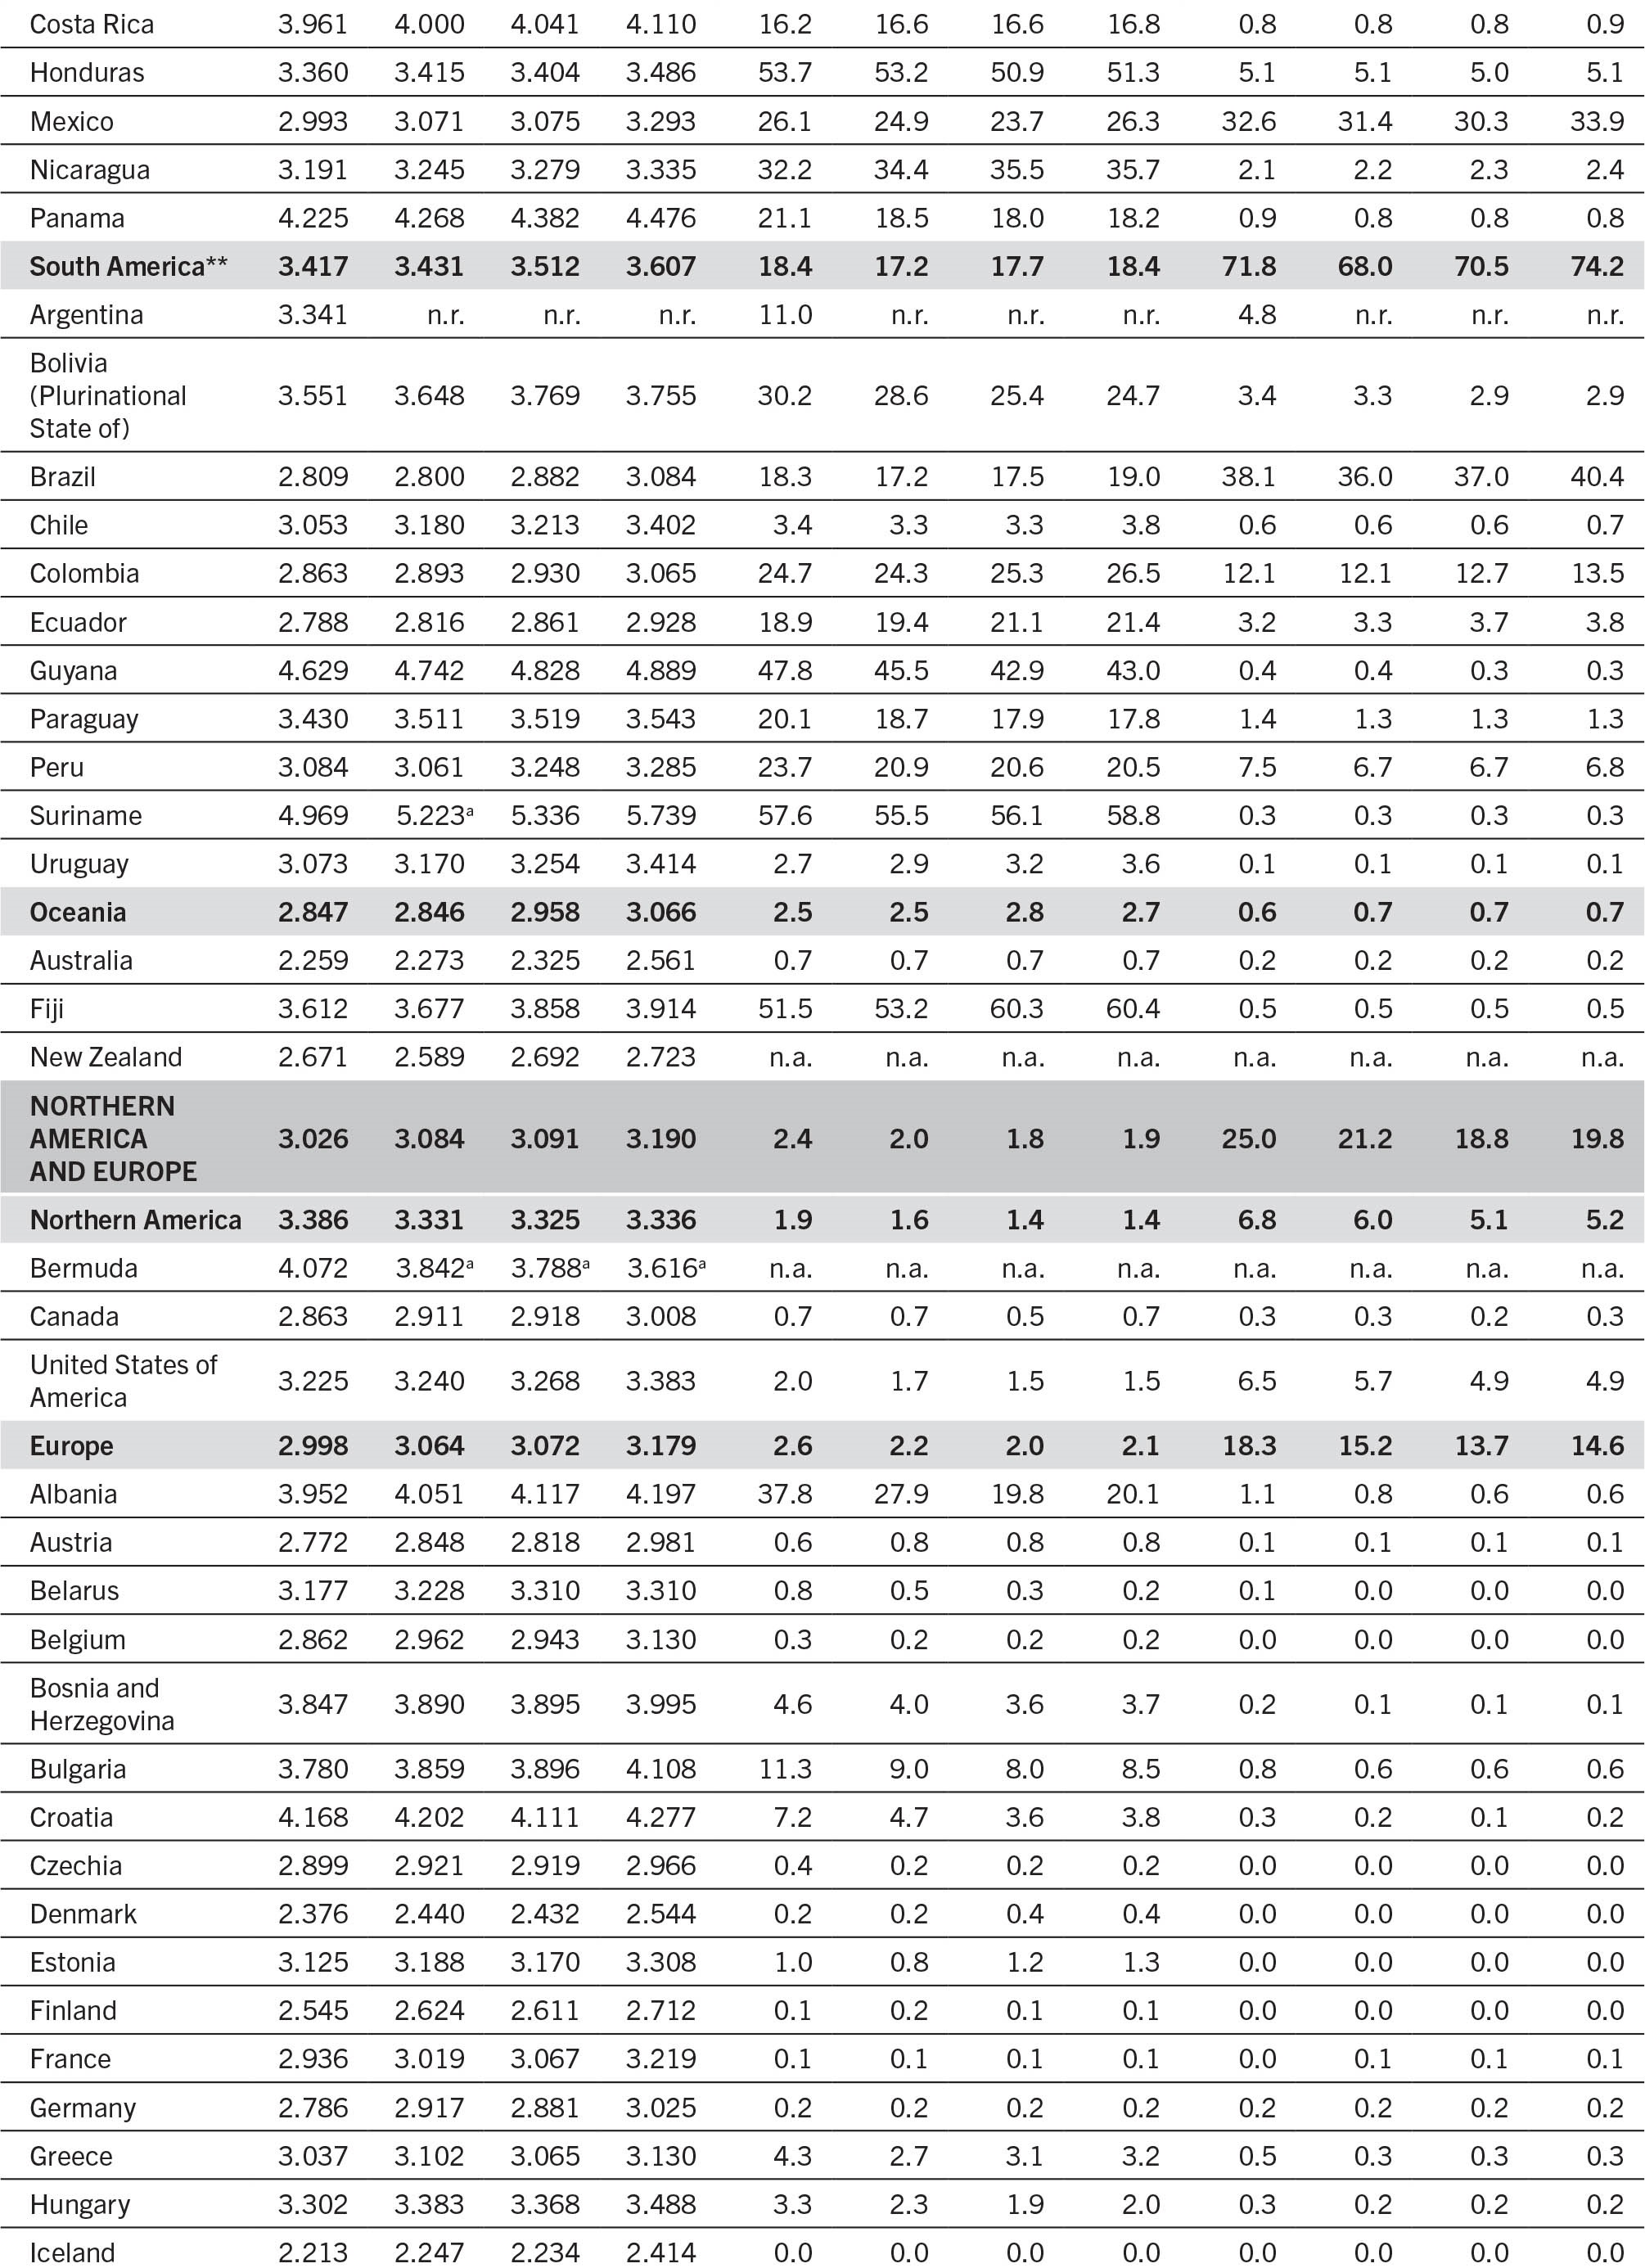
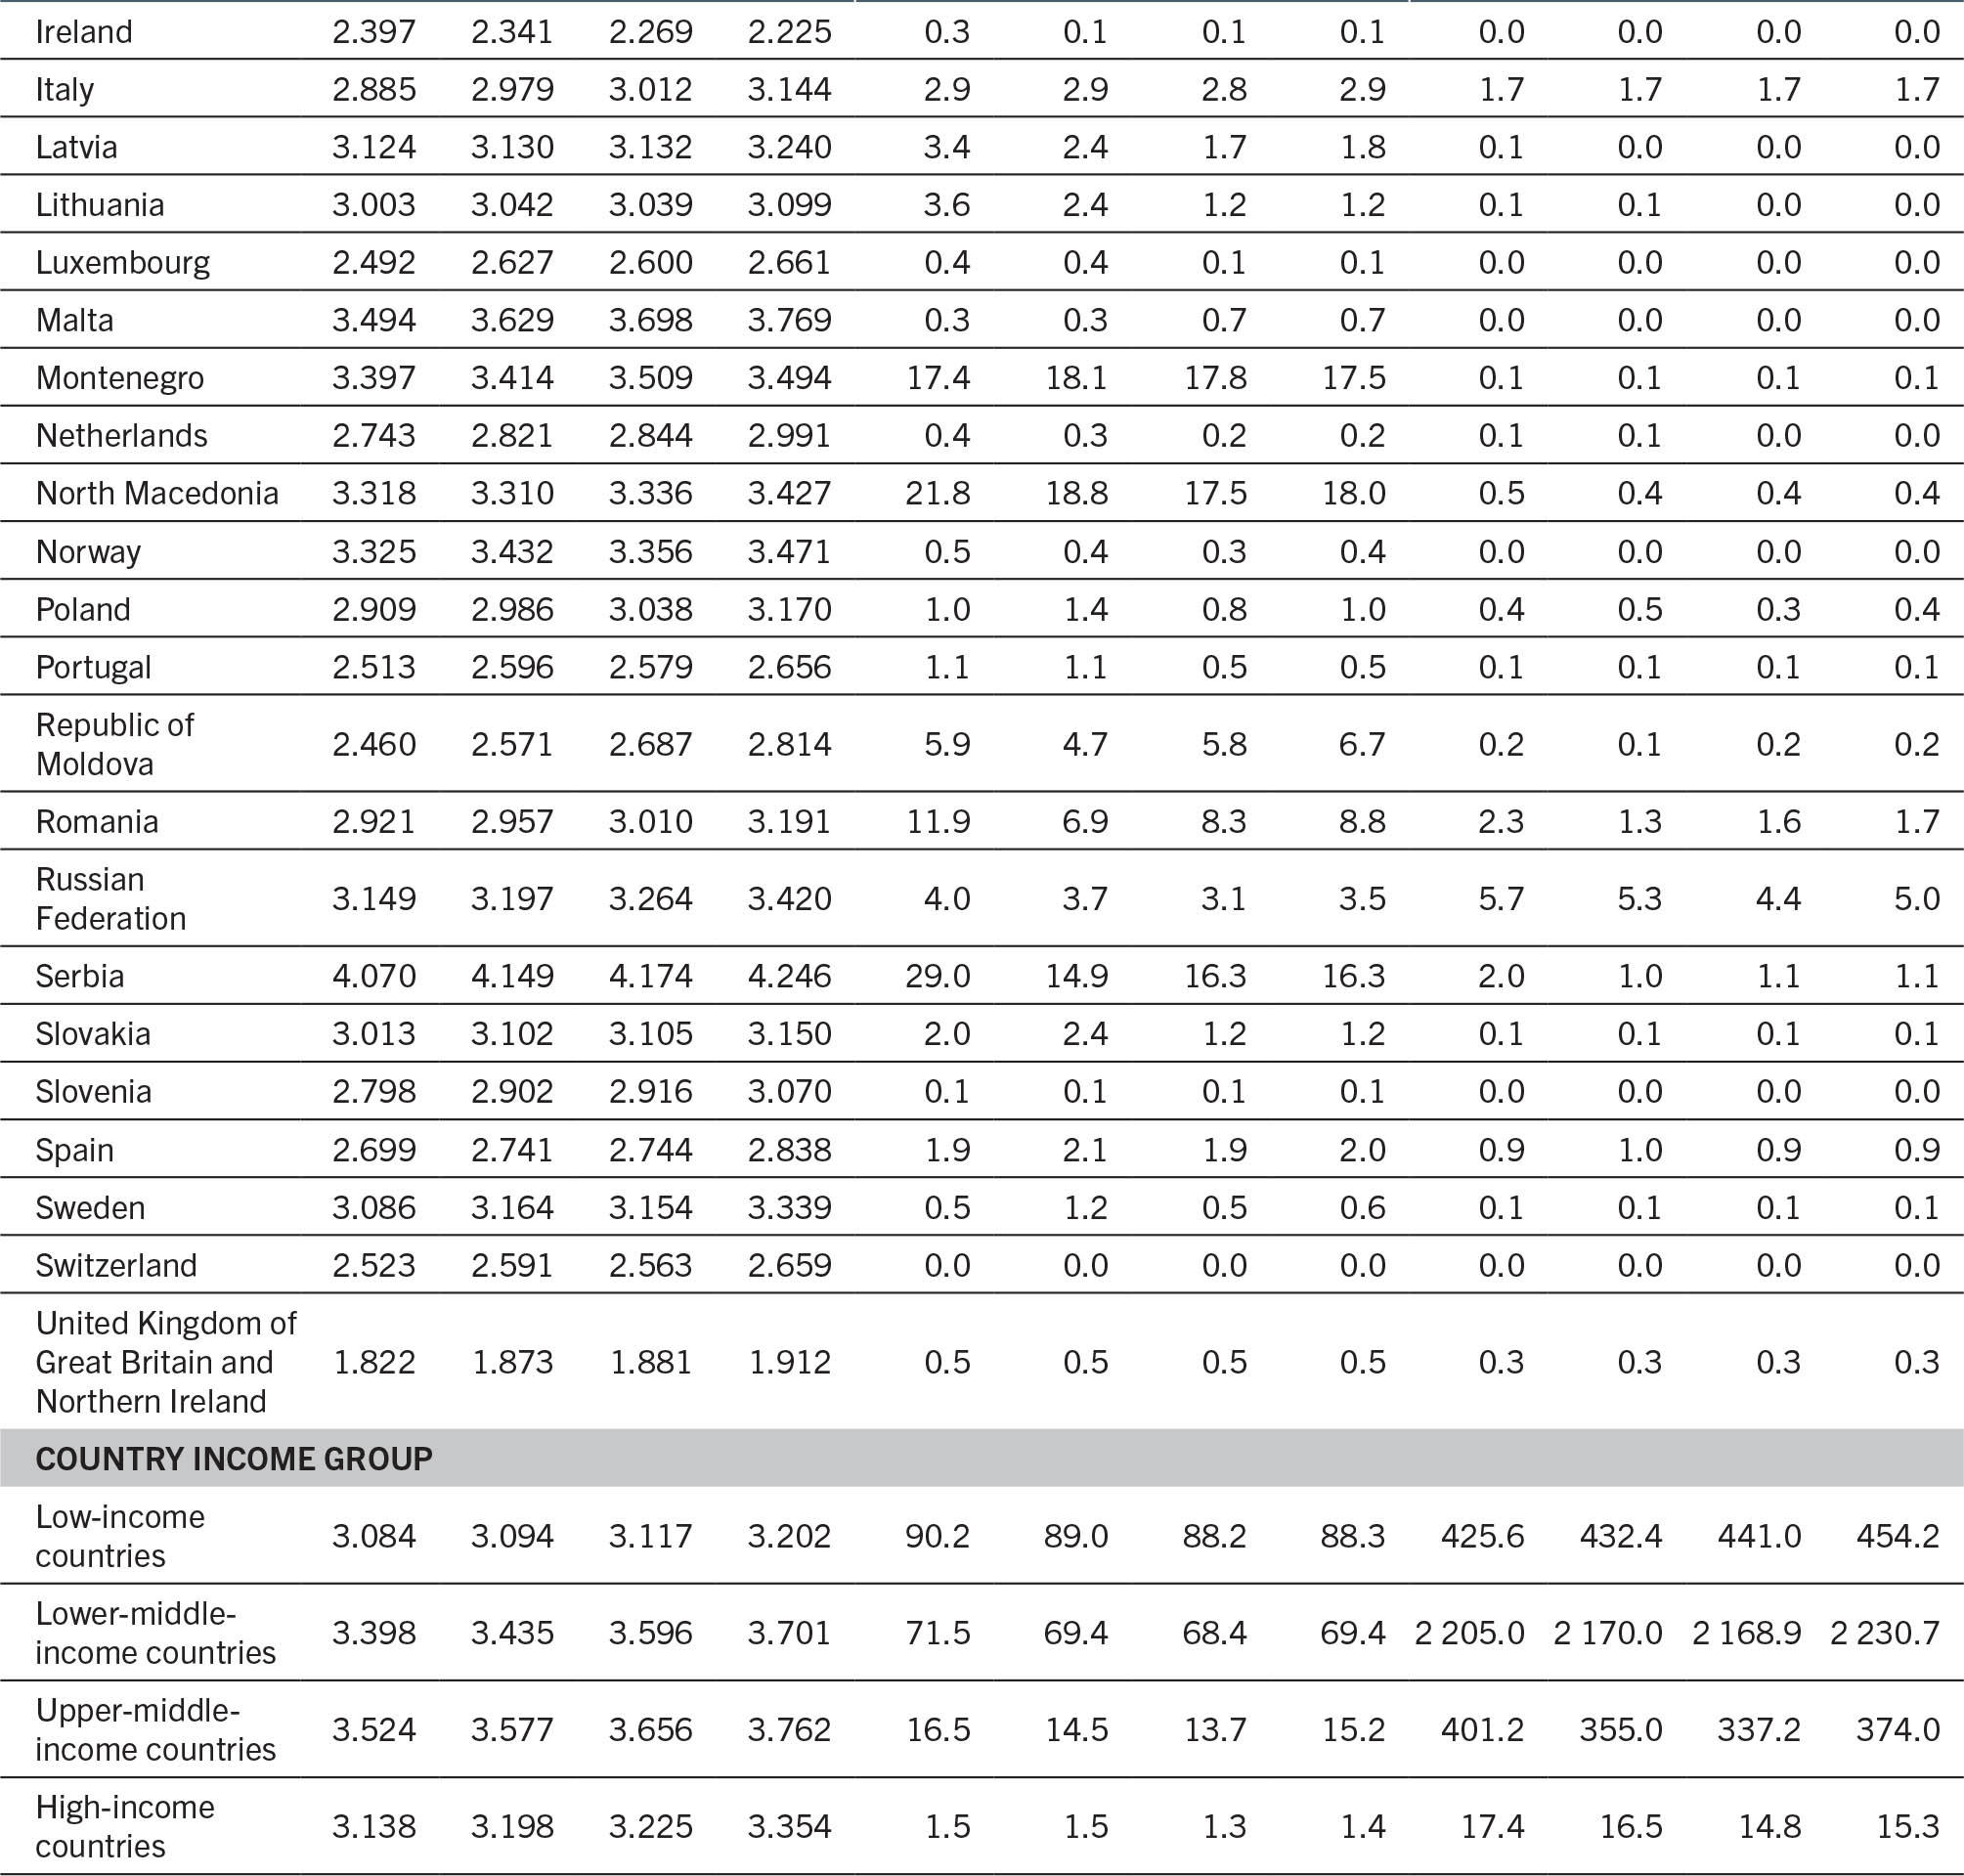
n.a. = data not available. n.r. = data not reported because of insufficient or unreliable data to update cost and affordability. * Cost and affordability of a healthy diet include Zimbabwe. ** Cost and affordability of a healthy diet include Argentina. a PPP was imputed in this year.
SOURCE: FAO.
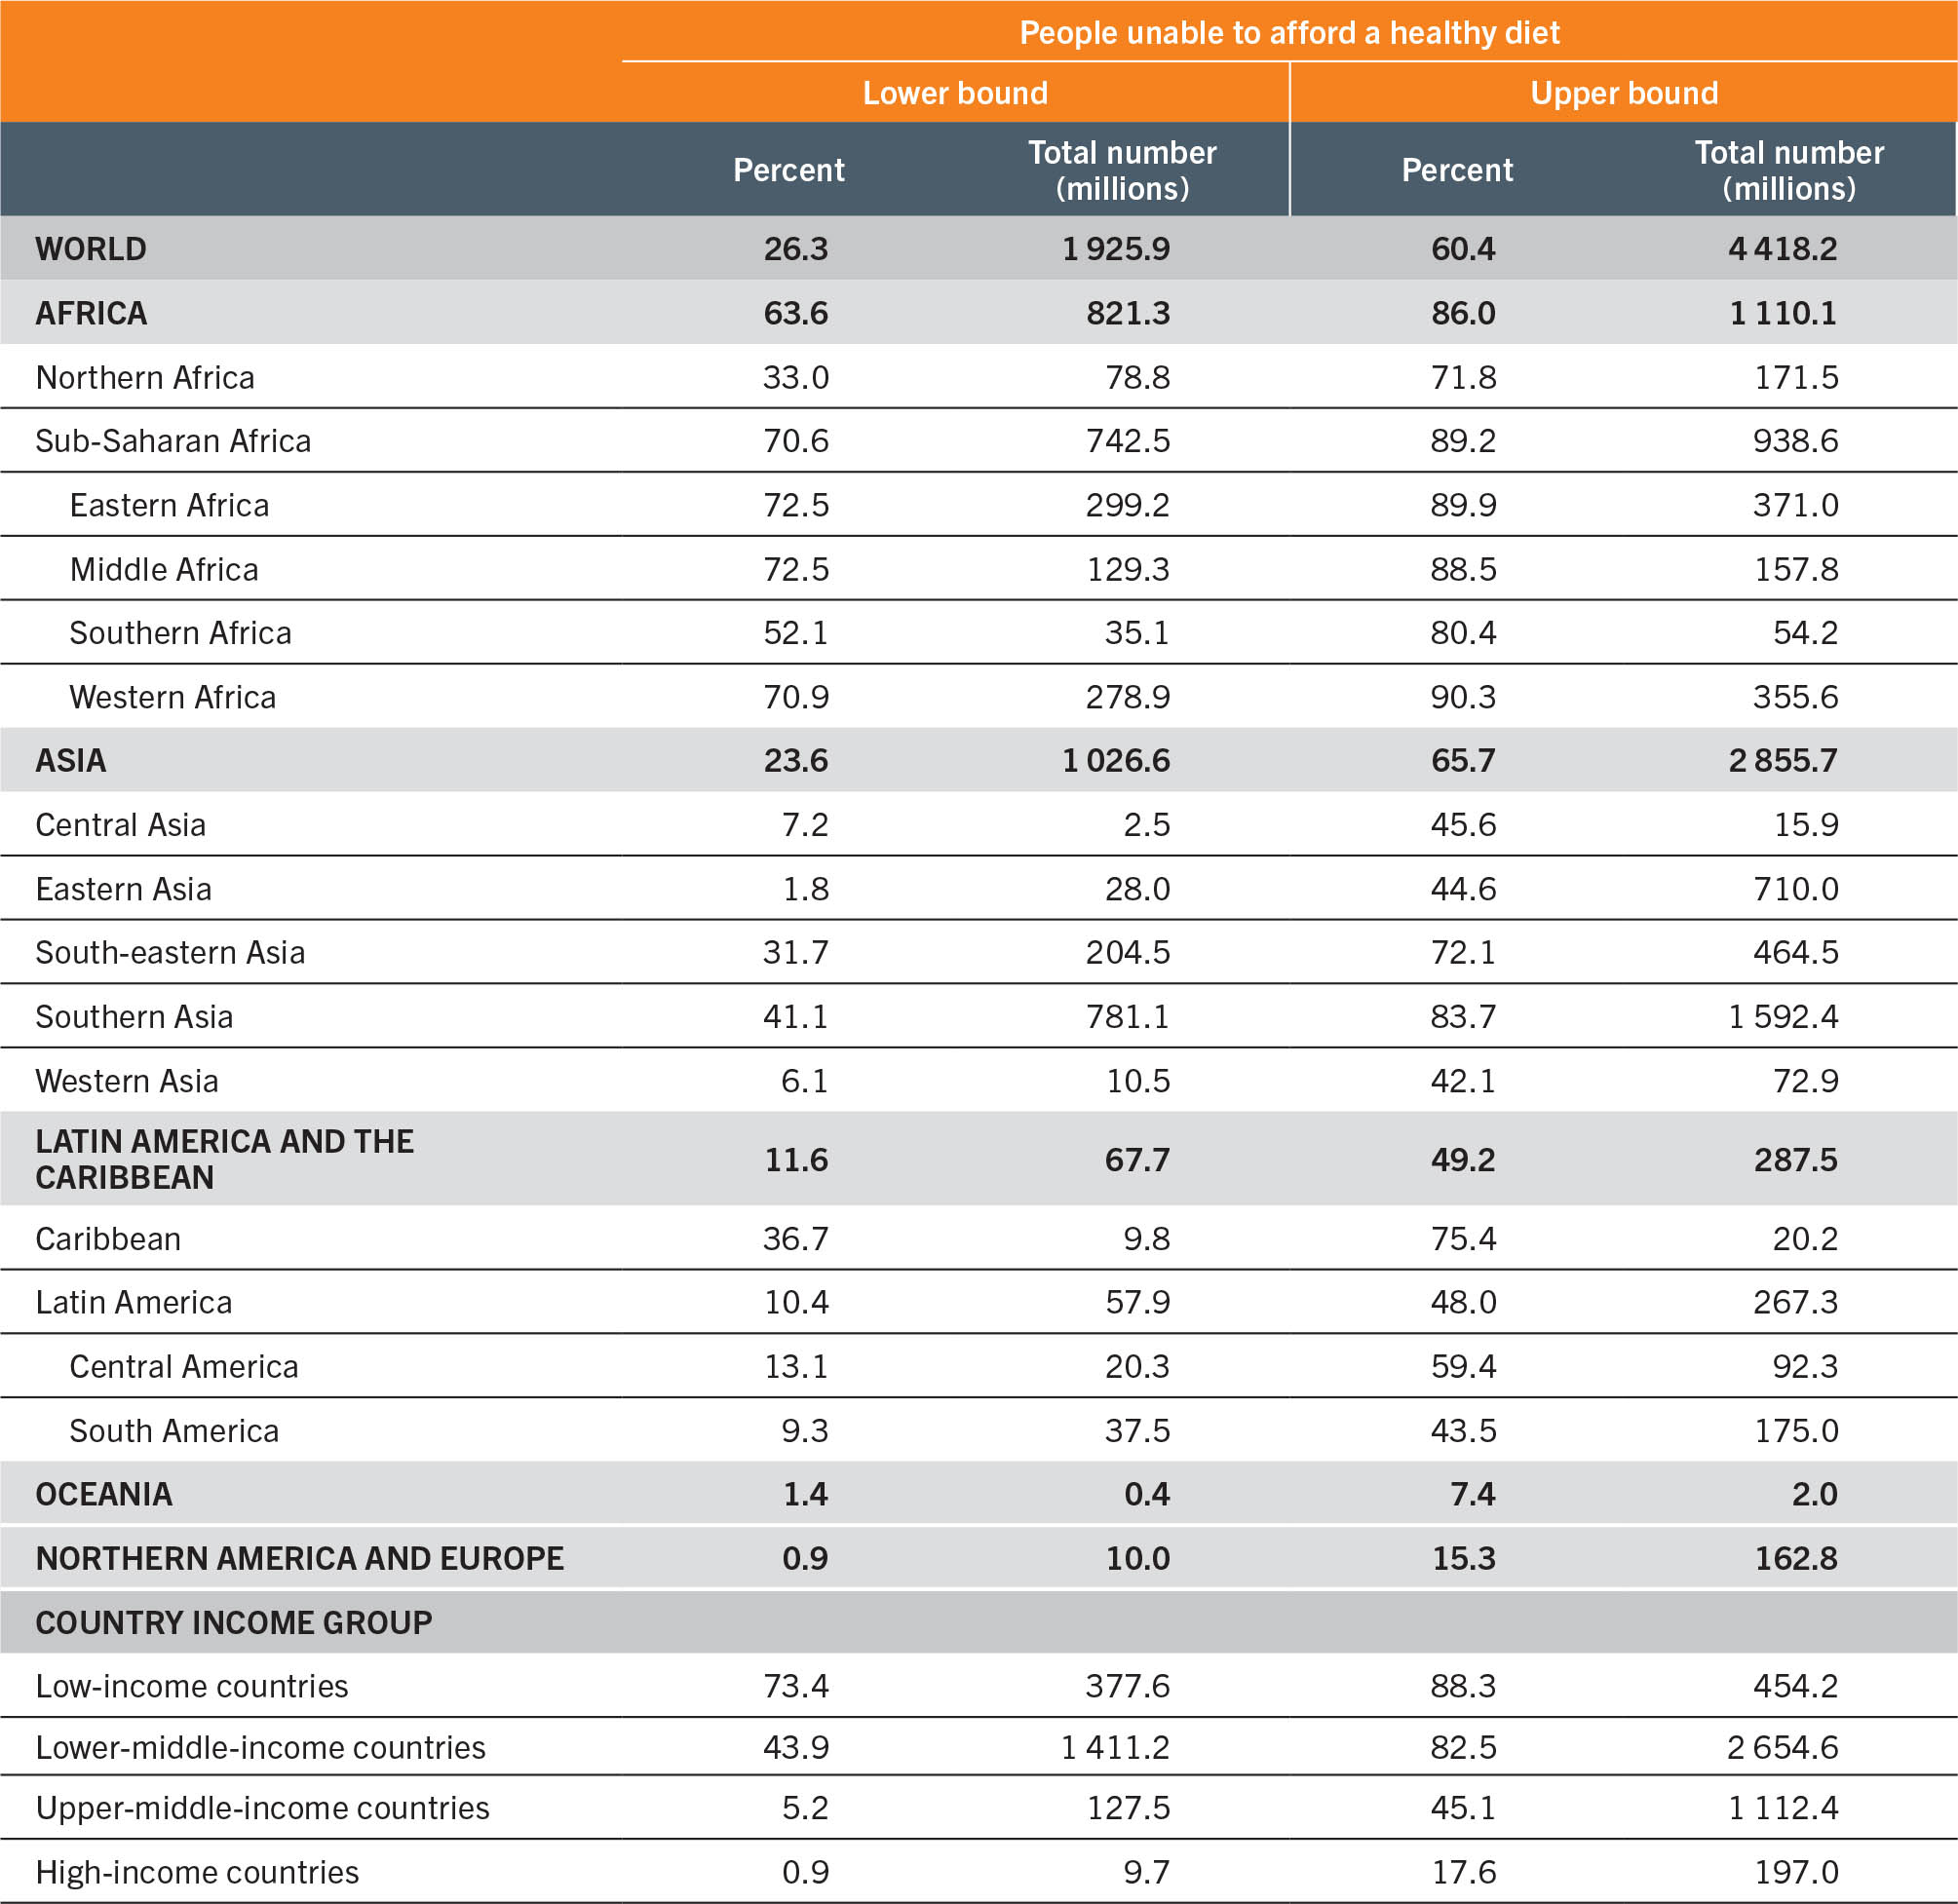
Ranges of the affordability indicators, showing the percentage and number of people unable to afford a healthy diet in 2020, are presented in Table A3.2 by region and development status. Lower-bound estimates assume that 80 percent of income available is spent on food, where 80 percent represents the largest expenditure share on food observed in the ICP 2017 data (for Guinea-Bissau). Upper-bound estimates assume that the share of income reserved for food varies by country income group. Following ICP 2017 national accounts data, food expenditures represent, on average, 14 percent, 27 percent, 38 percent and 52 percent of total expenditures in HICs, UMICs, LMICs and LICs, respectively. For example, if the cost of a healthy diet is USD 3.00 in a LIC with an average food expenditure share of 52 percent, income would need to be USD 5.77 for a person to afford a healthy diet as well as non-food needs. For a full description of the methodology for determining the ranges, see Herforth et al. (2020).86
TABLE A3.2Lower- and upper-bound estimates of the percentage and number of people (in millions) who cannot afford the cost of a healthy diet, by region and country income group in 2020
SOURCE: FAO.

