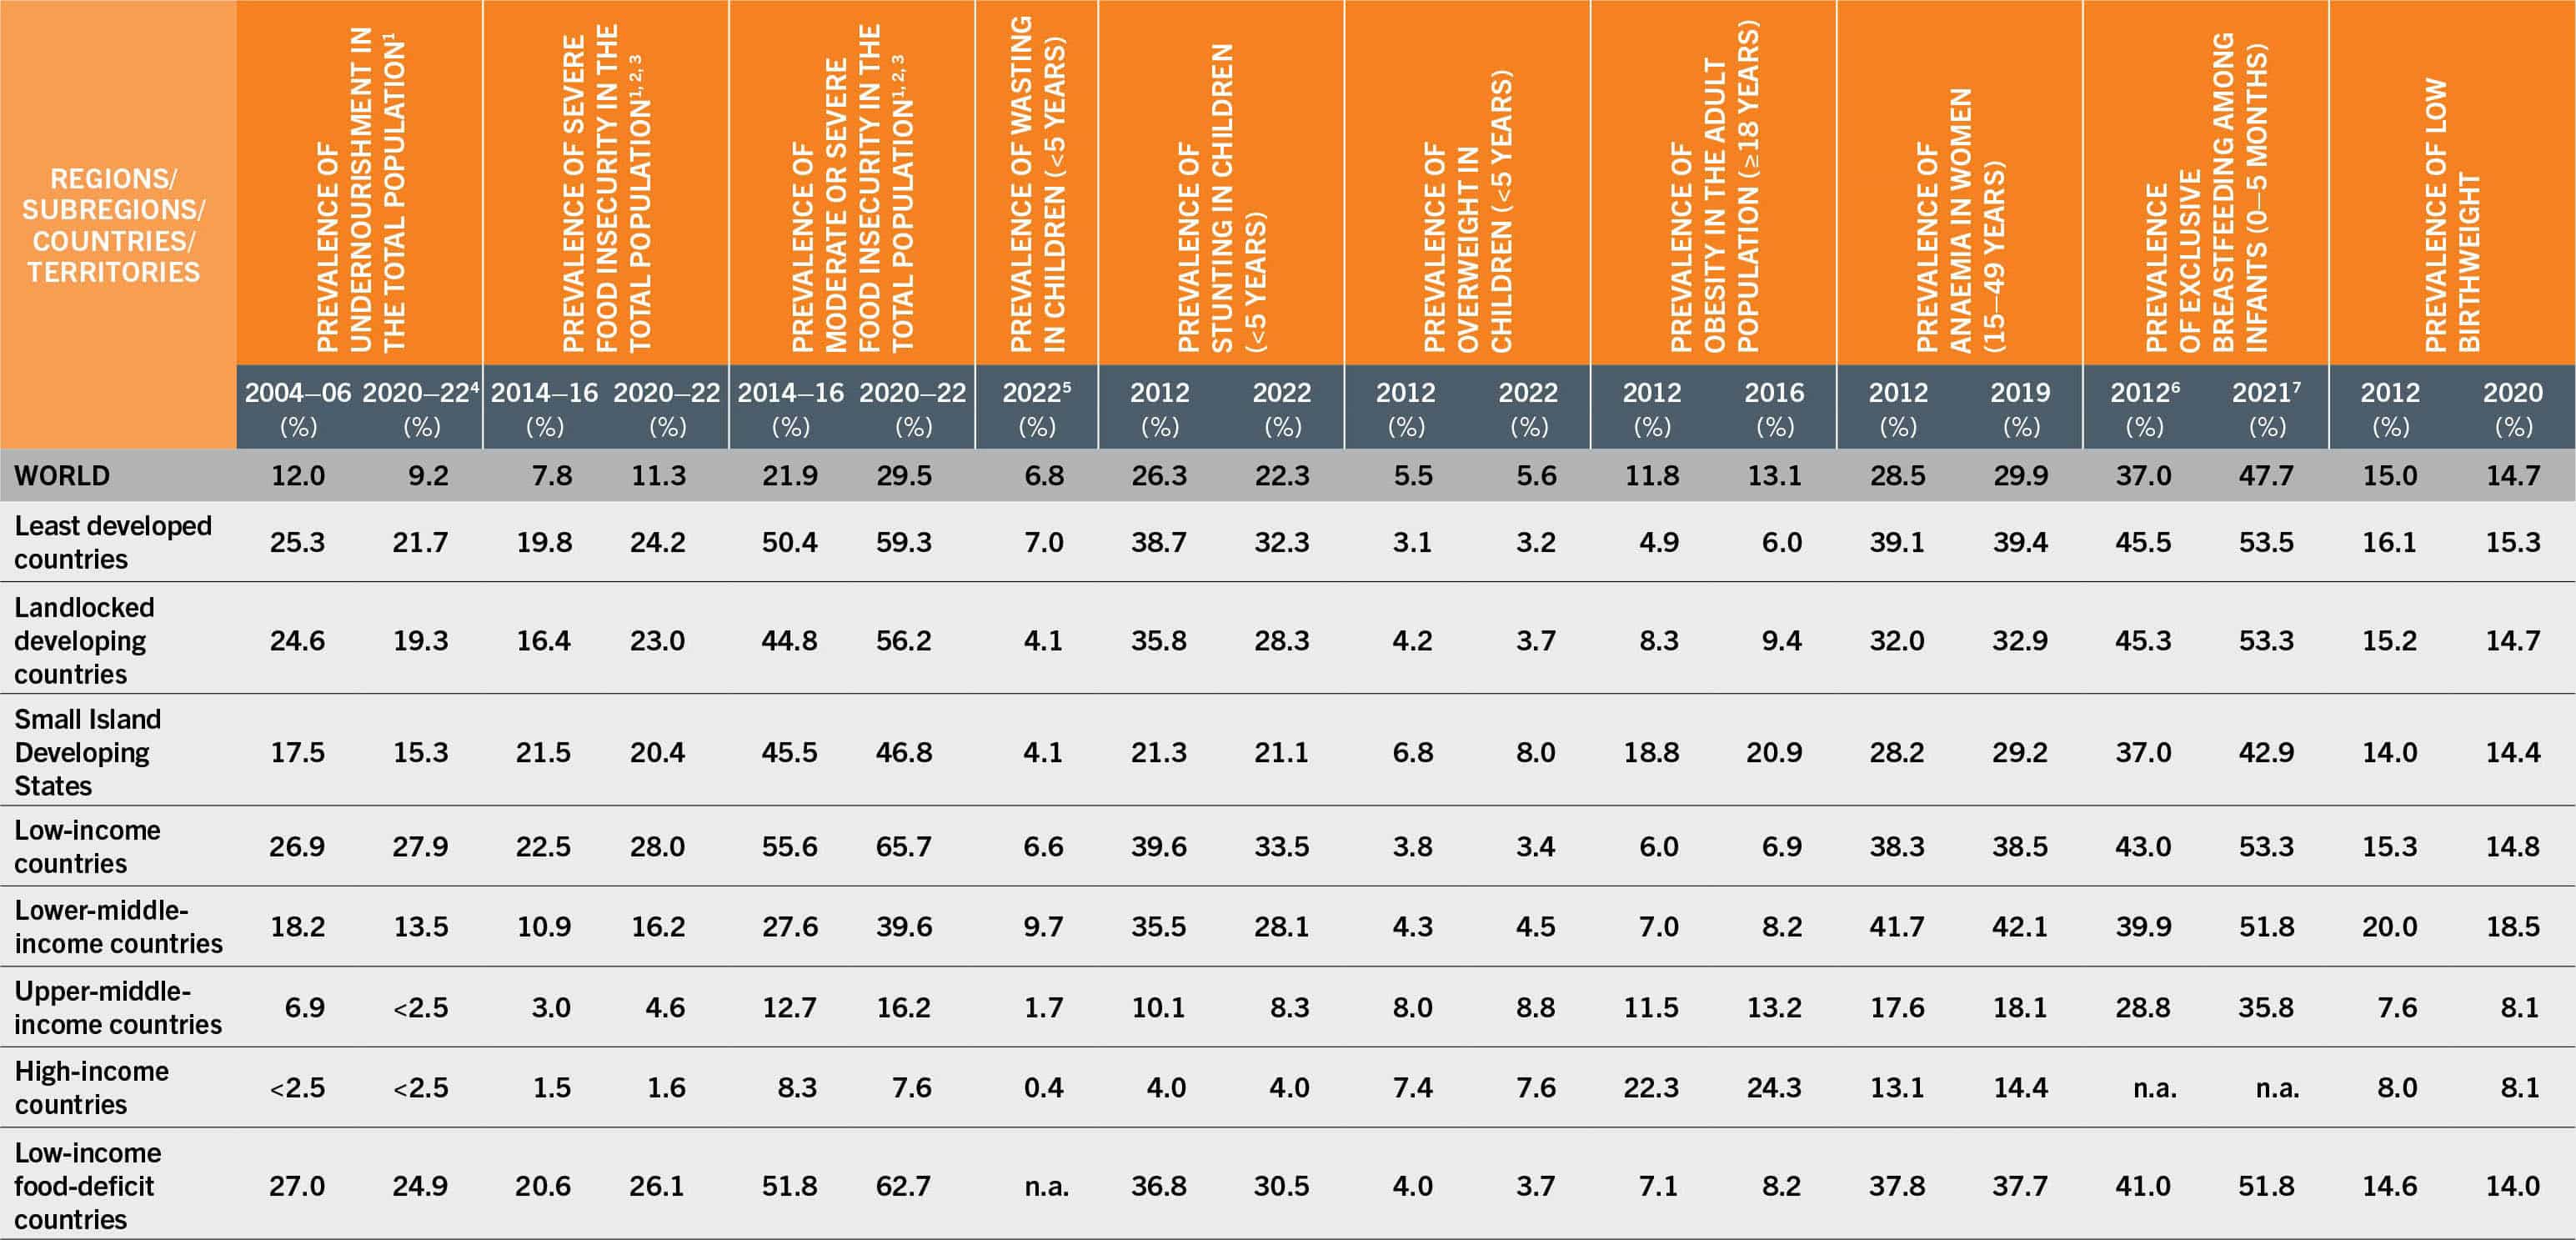
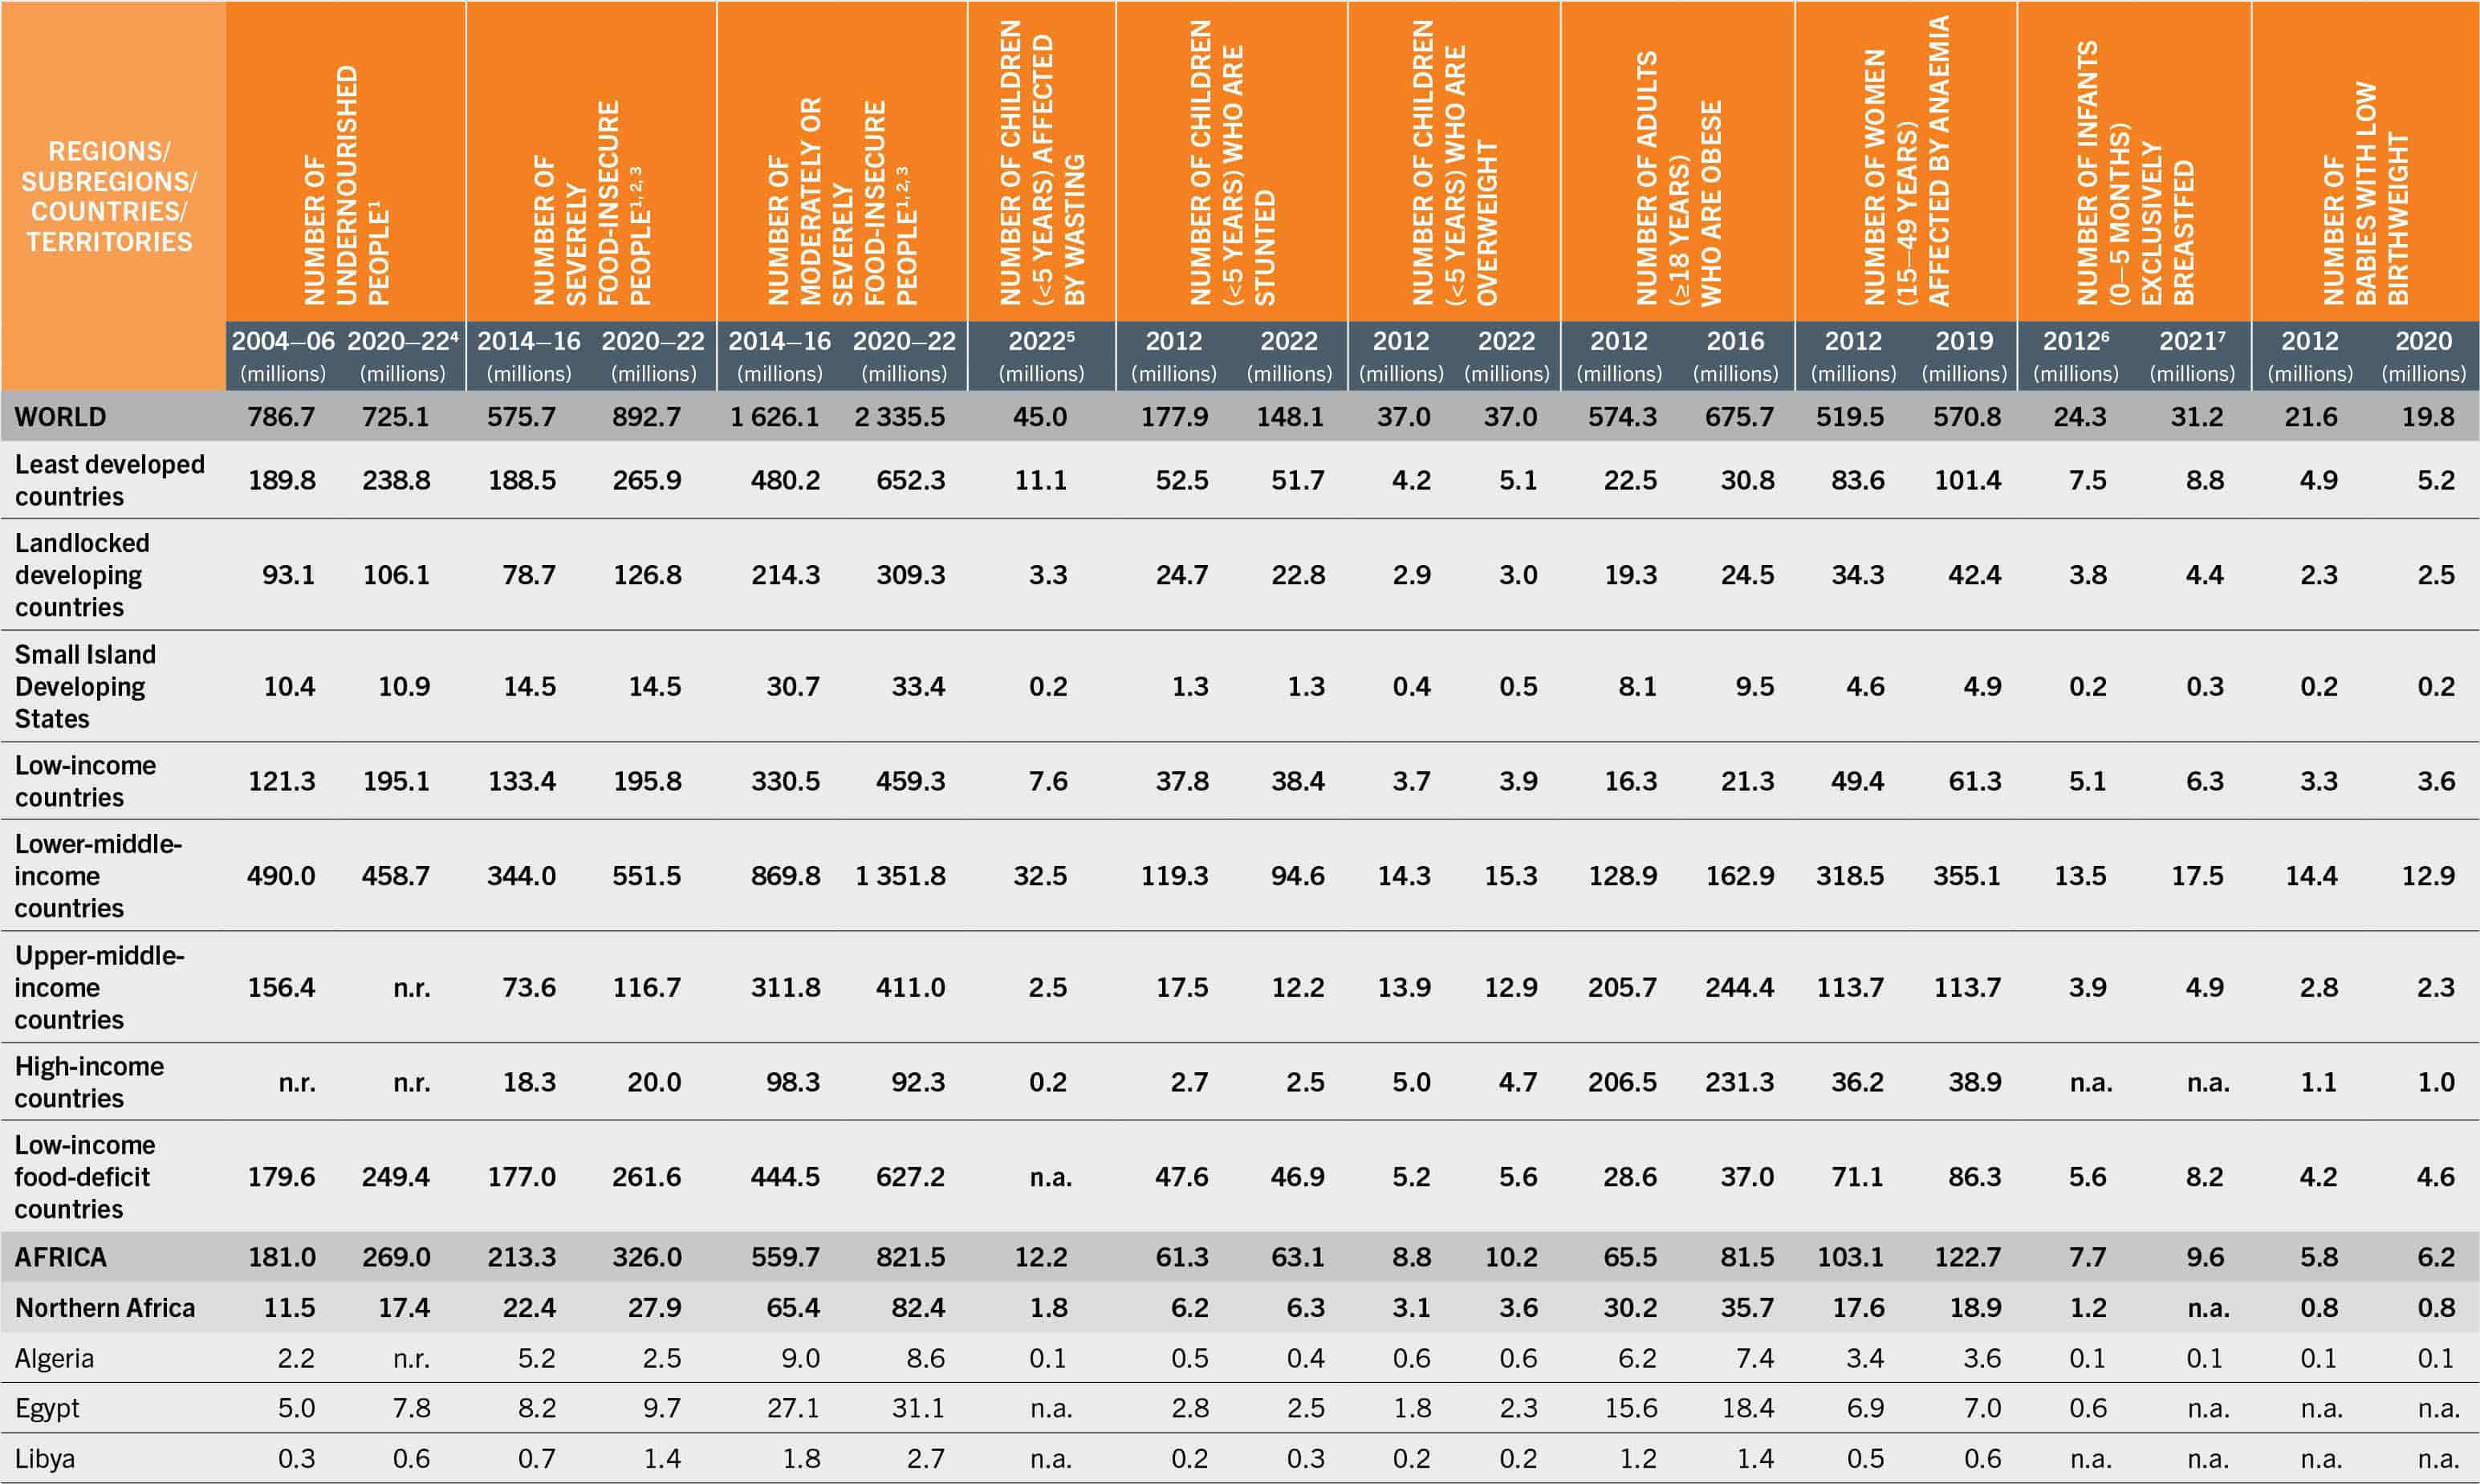
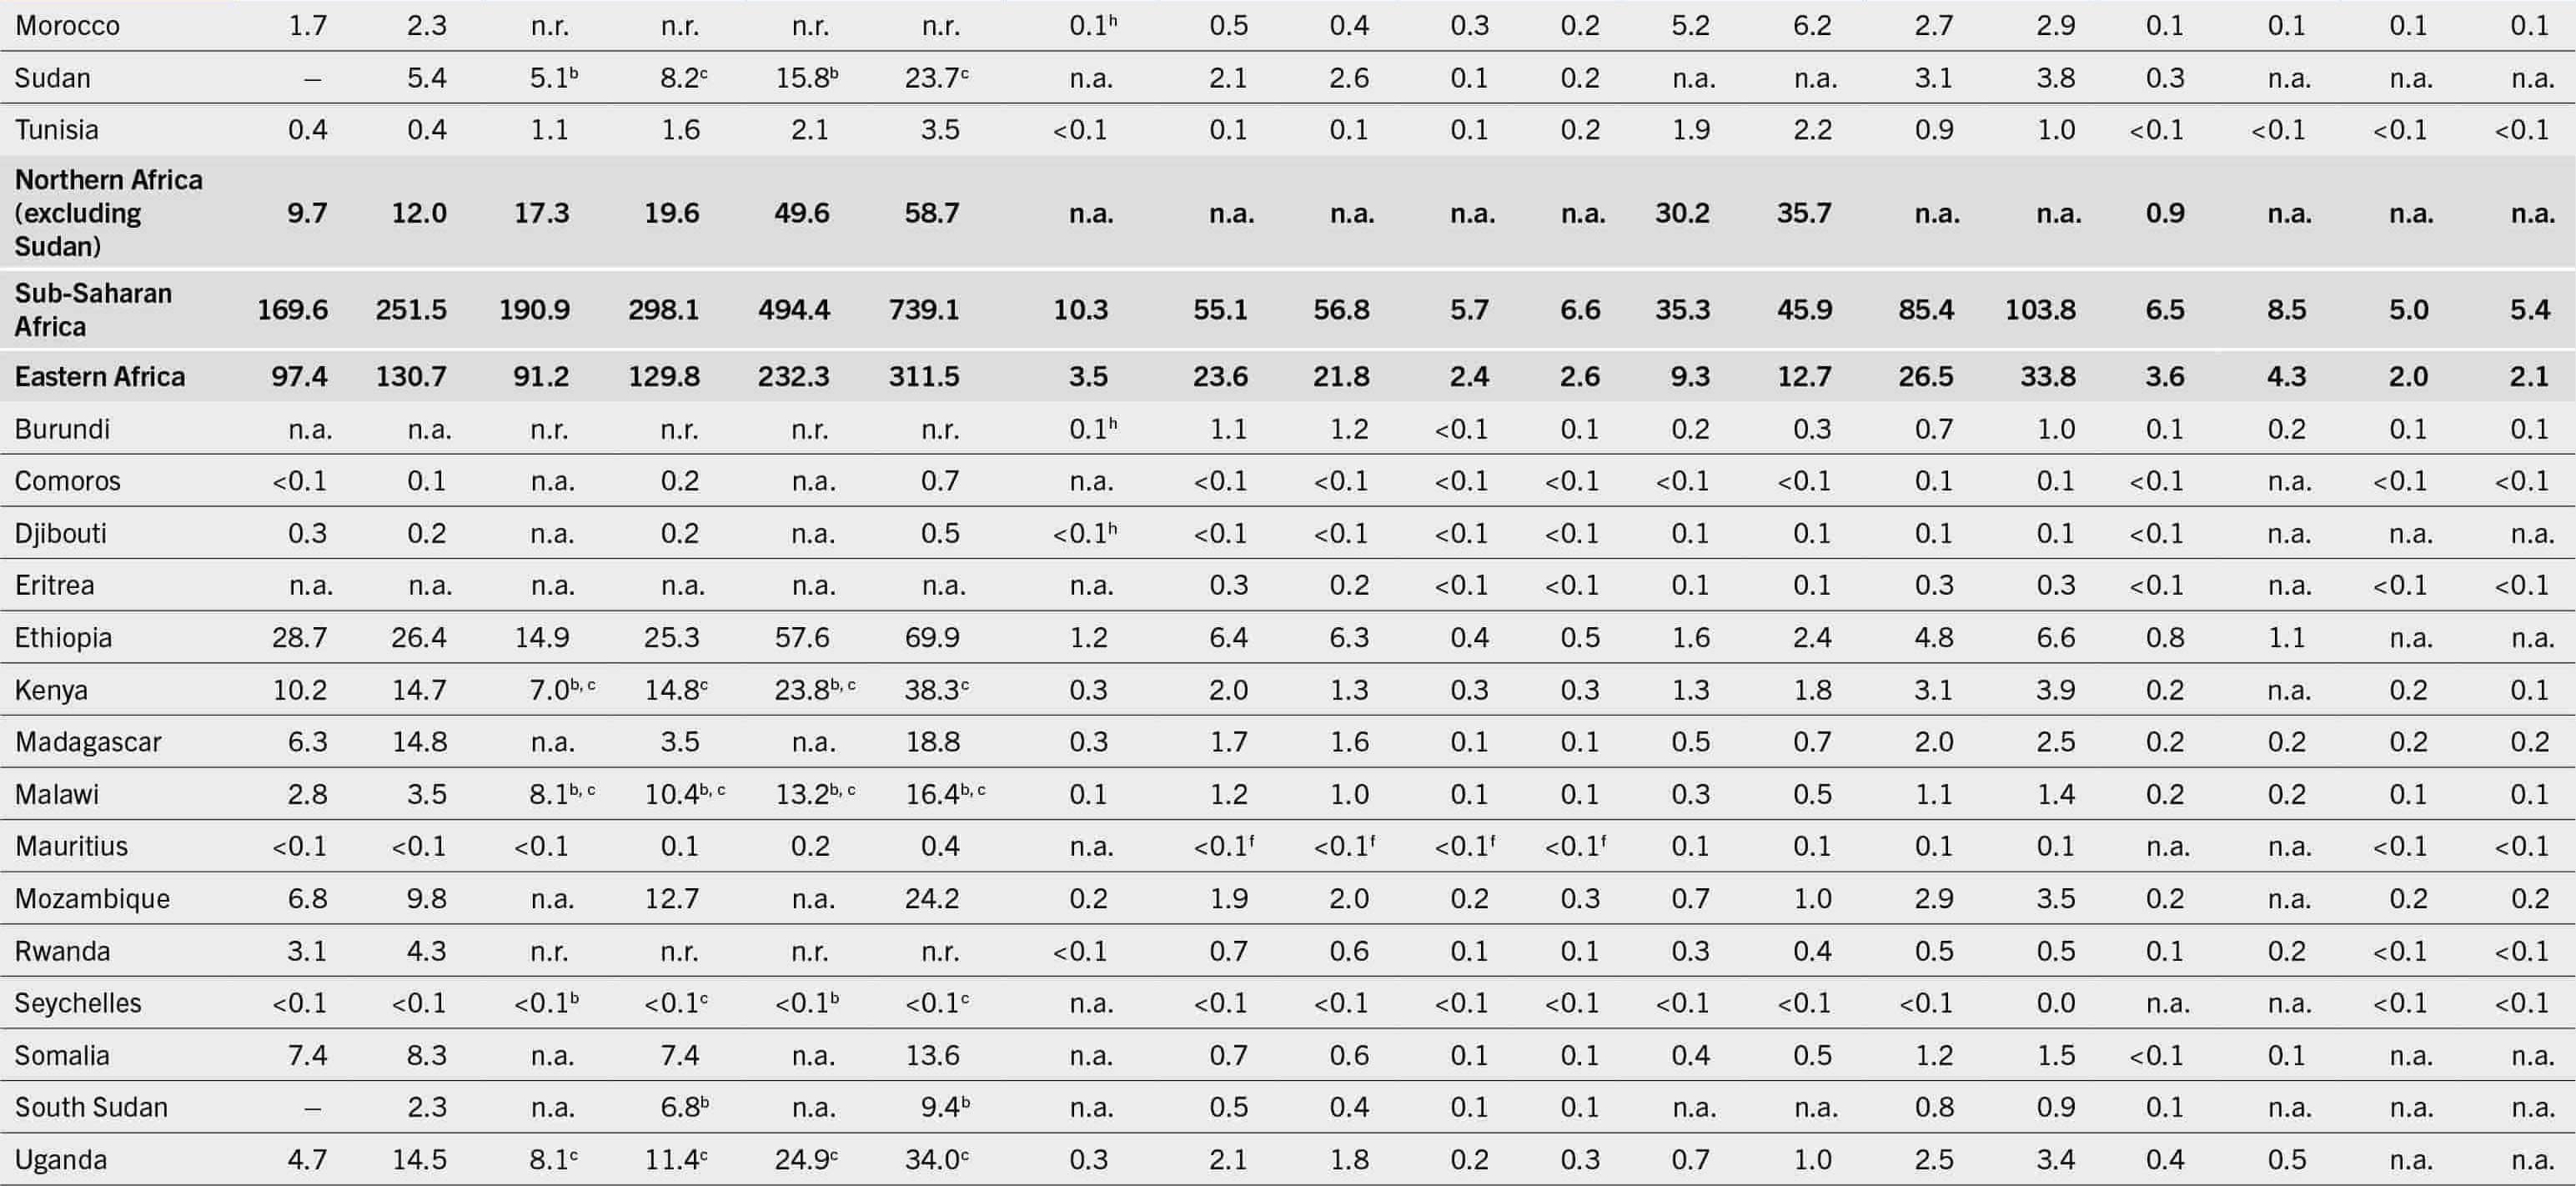
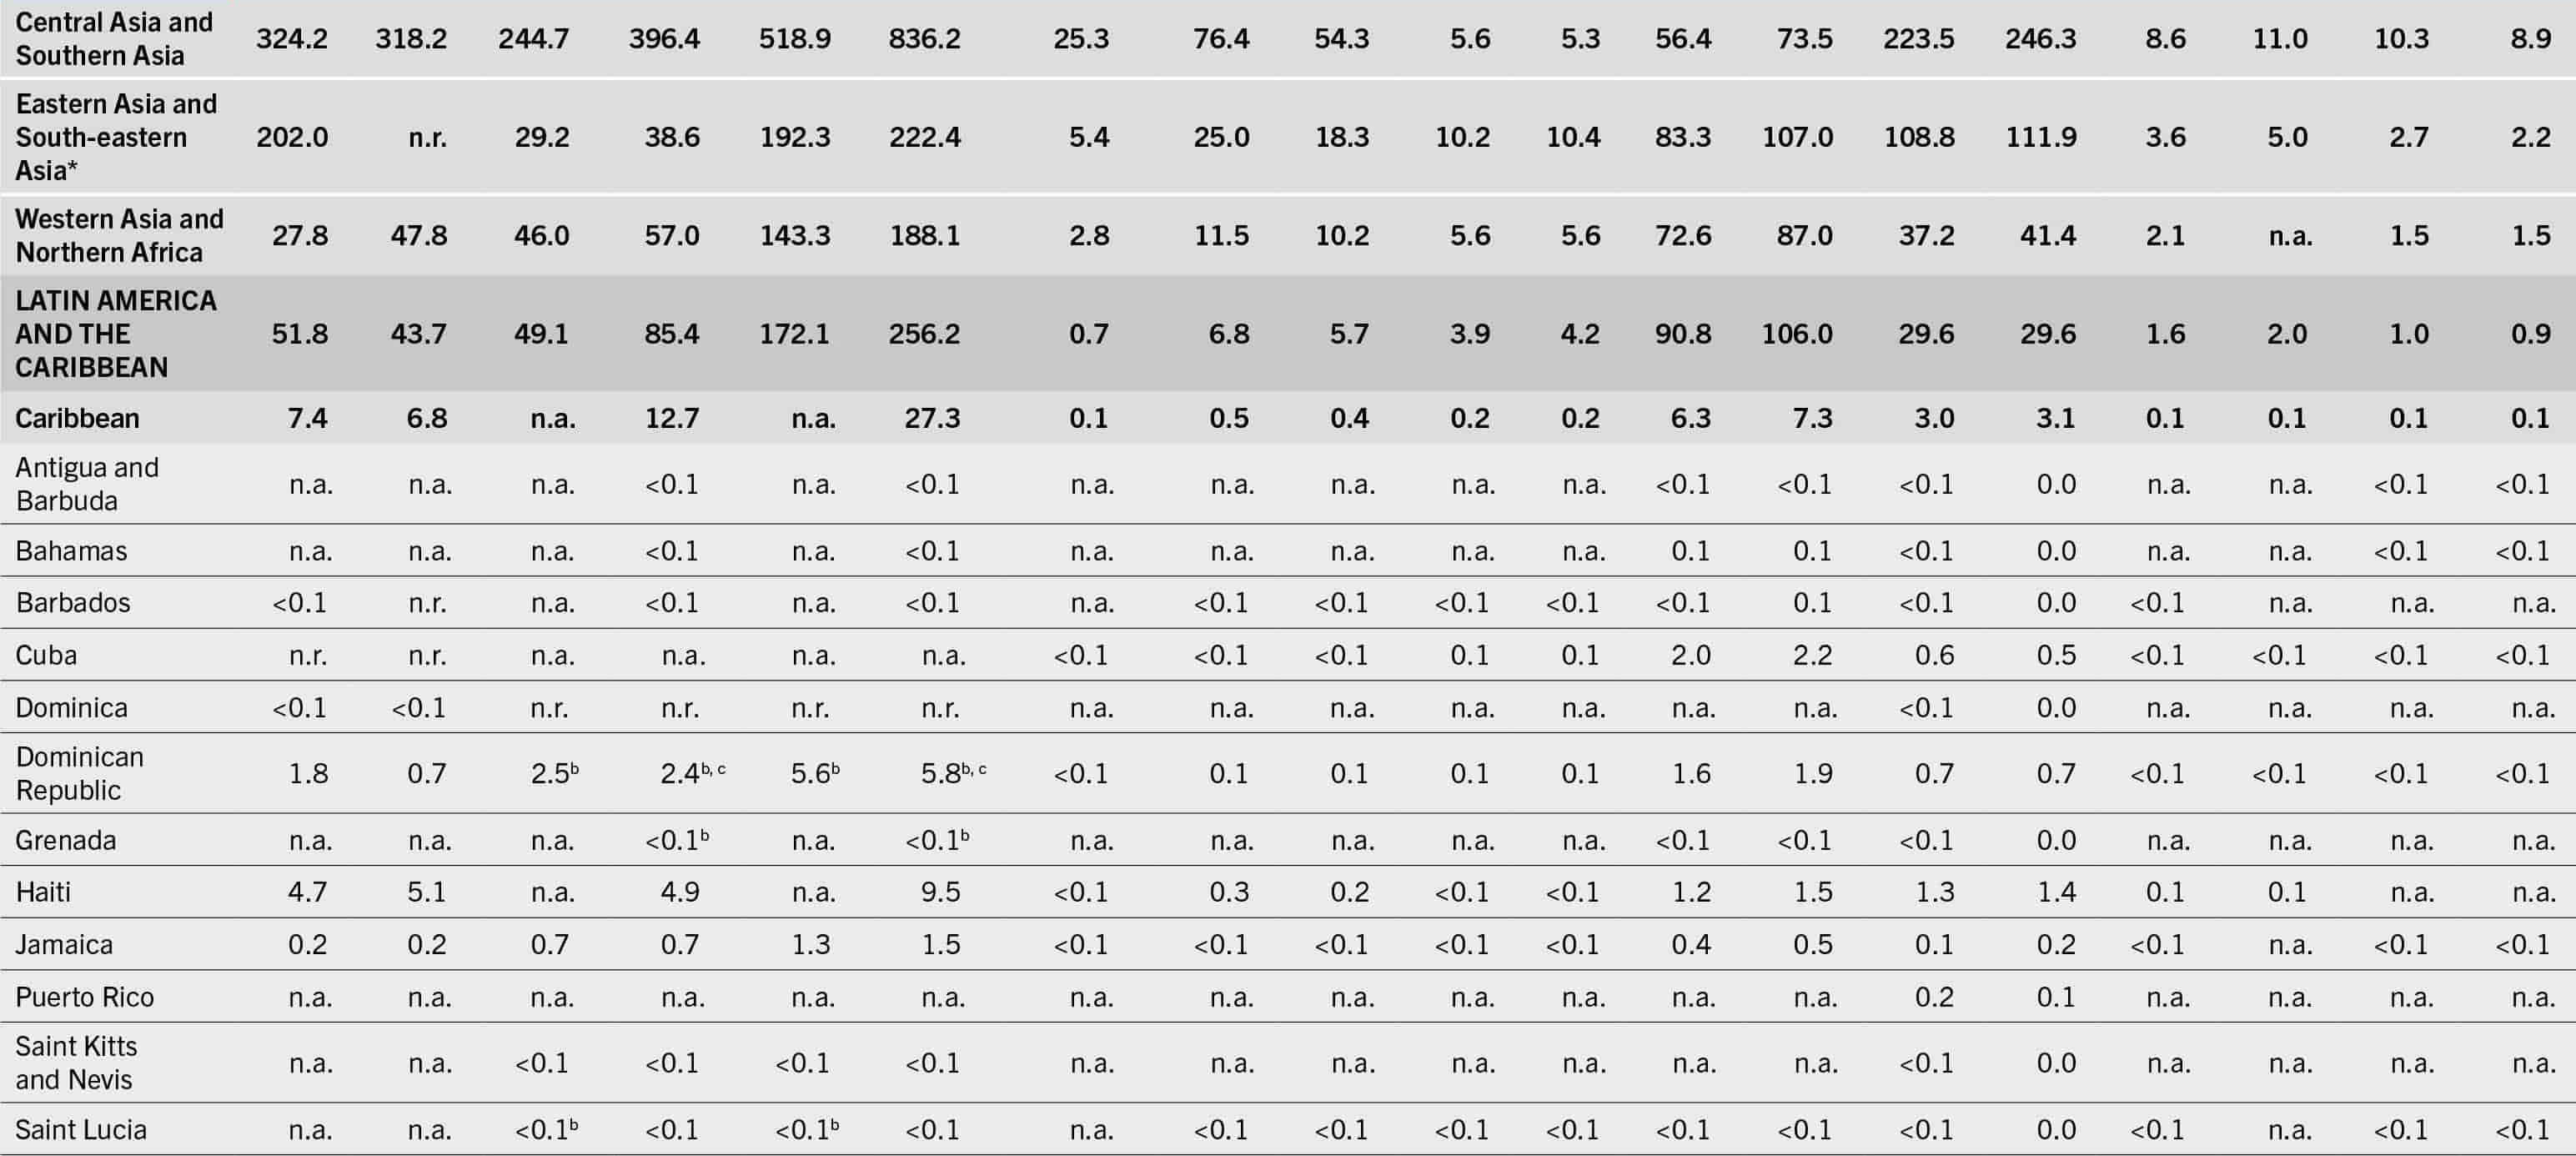
Table A1-1: Long Description The data is represented as regions/subregions/countries/territories: 2004-06, 2020-22 values for the prevalence of undernourishment in the total population, 2014-16, 2020-22 values for the prevalence of severe food insecurity in the total population, 2014-16, 2020-22 values for the prevalence of moderate or severe food insecurity in the total population, 2022 values for the prevalence of wasting in children (less than 5 years), 2012 and 2022 values for the prevalence of stunting in children (less than 5 years), 2012 and 2022 values for the prevalence of overweight in children (less 5 years), 2012, 2016 values for the prevalence of obesity in the adult population (greater than or equal to 18 years), 2012, 2019 values for the prevalence of anemia in women(15 to 49 years), 2012, 2021 values for the prevalence of exclusive breastfeeding among infants (0 to 5 months), and 2012, 2020 values for the prevalence of low birthweight. World: 12, 9.2, 7.8, 11.3, 21.9, 29.5, 6.8, 26.3, 22.3, 5.5, 5.6, 11.8, 13.1, 28.5, 29.9, 37, 47.7, 15, and 14.7. Least developed countries: 25.3, 21.7, 19.8, 24.2, 50.4, 59.3, 7, 38.7, 32.3, 3.1, 3.2, 4.9, 6, 39.1, 39.4, 45.5, 53.5, 16.1, and 15.3. Landlocked developing countries: 24.6, 19.3, 16.4, 23, 44.8, 56.2, 4.1, 35.8, 28.3, 4.2, 3.7, 8.3, 9.4, 32, 32.9, 45.3, 53.3, 15.2, and 14.7. Small Island Developing States: 17.5, 15.3, 21.5, 20.4, 45.5, 46.8, 4.1, 21.3, 21.1, 6.8, 8, 18.8, 20.9, 28.2, 29.2, 37, 42.9, 14, and 14.4. Low-income countries: 26.9, 27.9, 22.5, 28, 55.6, 65.7, 6.6, 39.6, 33.5, 3.8, 3.4, 6, 6.9, 38.3, 38.5, 43, 53.3, 15.3, and 14.8. Lower-middle-income countries: 18.2, 13.5, 10.9, 16.2, 27.6, 39.6, 9.7, 35.5, 28.1, 4.3, 4.5, 7, 8.2, 41.7, 42.1, 39.9, 51.8, 20, and 18.5. Upper-middle-income countries: 6.9, less than 2.5, 3, 4.6, 12.7, 16.2, 1.7, 10.1, 8.3, 8, 8.8, 11.5, 13.2, 17.6, 18.1, 28.8, 35.8, 7.6, and 8.1. High-income countries: less than 2.5, less than 2.5, 1.5, 1.6, 8.3, 7.6, 0.4, 4, 4, 7.4, 7.6, 22.3, 24.3, 13.1, 14.4, not available, not available, 8, and 8.1. Low-income-food-deficit countries: 27, 24.9, 20.6, 26.1, 51.8, 62.7, not available, 36.8, 30.5, 4, 3.7, 7.1, 8.2, 37.8, 37.7, 41, 51.8, 14.6, and 14.
Table A1-1 (Continued): Long Description The data is represented as regions/subregions/countries/territories: 2004-06, 2020-22 values for the prevalence of undernourishment in the total population, 2014-16, 2020-22 values for the prevalence of severe food insecurity in the total population, 2014-16, 2020-22 values for the prevalence of moderate or severe food insecurity in the total population, 2022 values for the prevalence of wasting in children (less than 5 years), 2012 and 2022 values for the prevalence of stunting in children (less than 5 years), 2012 and 2022 values for the prevalence of overweight in children (less 5 years), 2012, 2016 values for the prevalence of obesity in the adult population (greater than or equal to 18 years), 2012, 2019 values for the prevalence of anemia in women(15 to 49 years), 2012, 2021 values for the prevalence of exclusive breastfeeding among infants (0 to 5 months), and 2012, 2020 values for the prevalence of low birthweight. Africa: 19.5, 19.3, 17.8, 23.4, 46.6, 58.9, 5.8, 34.4, 30, 5, 4.9, 11.5, 12.8, 39.2, 38.9, 35.4, 44.3, 14.5, and 13.9. Northern Africa: 6.1, 6.8, 9.8, 10.9, 28.6, 32.2, 6.3, 23.5, 21.7, 11.8, 12.3, 23, 25.2, 31.9, 31.1, 40.8, not available, 14, and 14.1. Algeria: 6.7, less than 2.5, 13, 5.6, 22.9, 19.4, 2.7, 12.1, 8.6, 13.5, 11.9, 24.7, 27.4, 32.9, 33.3, 25.4, 28.6, 6.9, and 7.2. Egypt: 6.4, 7.2, 8.4, 8.8, 27.8, 28.5, not available, 24.6, 20.4, 15.7, 18.8, 29.3, 32, 31, 28.3, 52.8, not available, not available, not available. Libya: 4.7, 8.4, 11.2, 21.2, 29.1, 39.8, not available, 30, 52.2, 26.4, 28.7, 30, 32.5, 28.6, 29.9, not available, not available, not available, not available. Morocco: 5.5, 6.3, not available, not available, not available, not available, 2.3, 15.8, 12.8, 9.5, 4.9, 23.4, 26.1, 29.8, 29.9, 27.8, 35, 16.1, and 14.8. Sudan: empty, 11.9, 13.4b, 18.1, 41.4, 51.8, not available, 36, 36, 2.4, 2.7, not available, not available, 36.8, 36.5, 41, not available, not available, not available. Tunisia: 4.3, 3, 9.1, 12.6, 18.2, 28.5, 2.1, 8.8, 8.6, 12.7, 19, 24.6, 26.9, 30.4, 32.1, 8.5, 13.5, 8.1, and 8.2. Northern Africa (excluding Sudan): 6.1, 5.7, 9.1, 9.3, 26.1, 28, not available, not available, not available, not available, not available, 26.8, 29.5, not available, not available, 40.7, not available, not available, not available. Sub-Saharan Africa: 22.9, 22.1, 19.6, 26.2, 50.8, 64.9, 5.7, 36.2, 31.3, 3.8, 3.7, 8, 9.2, 41.2, 40.7, 34.4, 45.1, 14.5, and 13.9. Eastern Africa: not available, not available, not available, not available, not available, not available, 4.9, 56.5, 56.5, 2.2, 3.6, 4.4, 5.4, 31.1, 38.5, 69.3, 71.9, 15.1, and 14.8. Burundi: 16.8, 13.5, not available, 27.4, not available, 79.7, not available, 31.9, 18.8, 11.5, 7.7, 6.7, 7.8, 32.8, 33.8, 11.4, not available, 24.1, and 23. Comoros: 30.2, 16.8, not available, 16.5, not available, 49.2, 10.6, 29.6, 18.7, 1.3, 3.2, 12.3, 13.5, 31, 32.3, 12.4, not available, not available, not available. Djibouti: not available, not available, not available, not available, not available, not available, not available, 51.6, 50.2, 1.9, 3, 4.1, 5, 36.2, 37, 68.7, not available, 15.4, and 15.2. Eritrea: 37.1, 21.9, 14.5, 21.1, 56.2, 58.1, 6.8, 42.1, 34.4, 2.5, 2.7, 3.6, 4.5, 22.4, 23.9, 52, 58.8, not available, not available. Ethiopia: 28.4, 27.8, 15, 28, 50.7, 72.3, 4.9, 28.6, 18.4, 4.6, 3.8, 5.9, 7.1, 28.4, 28.7, 31.9, not available, 10.8, and 10. Kenya: 33.7, 51, not available, 12.2, not available, 64.9, 7.2, 47.3, 38.6, 1.8, 1.5, 4.3, 5.3, 37.5, 37.8, 41.9, 54.4, 19.5, and 18.7. Madagascar: 21.9, 17.8, 47.7, 52.2, 78.1, 82.4, 2.6, 43.6, 34, 4.9, 3.9, 4.8, 5.8, 30.6, 31.4, 70.8, 64.1, 15.8, and 15.6. Malawi: 5.1, 6.8, 5.2, 10.5, 13, 32, not available, 9, 8.6, 7.8, 6.8, 9.6, 10.8, 19.2, 23.5, not available, not available, 19.1, and 18.7. Mauritius: 33.8, 30.5, not available, 39.6, not available, 75.4, 3.9, 42.6, 36.4, 5.5, 5.5, 6.1, 7.2, 48.8, 47.9, 40, not available, 18.1, and 17.8.
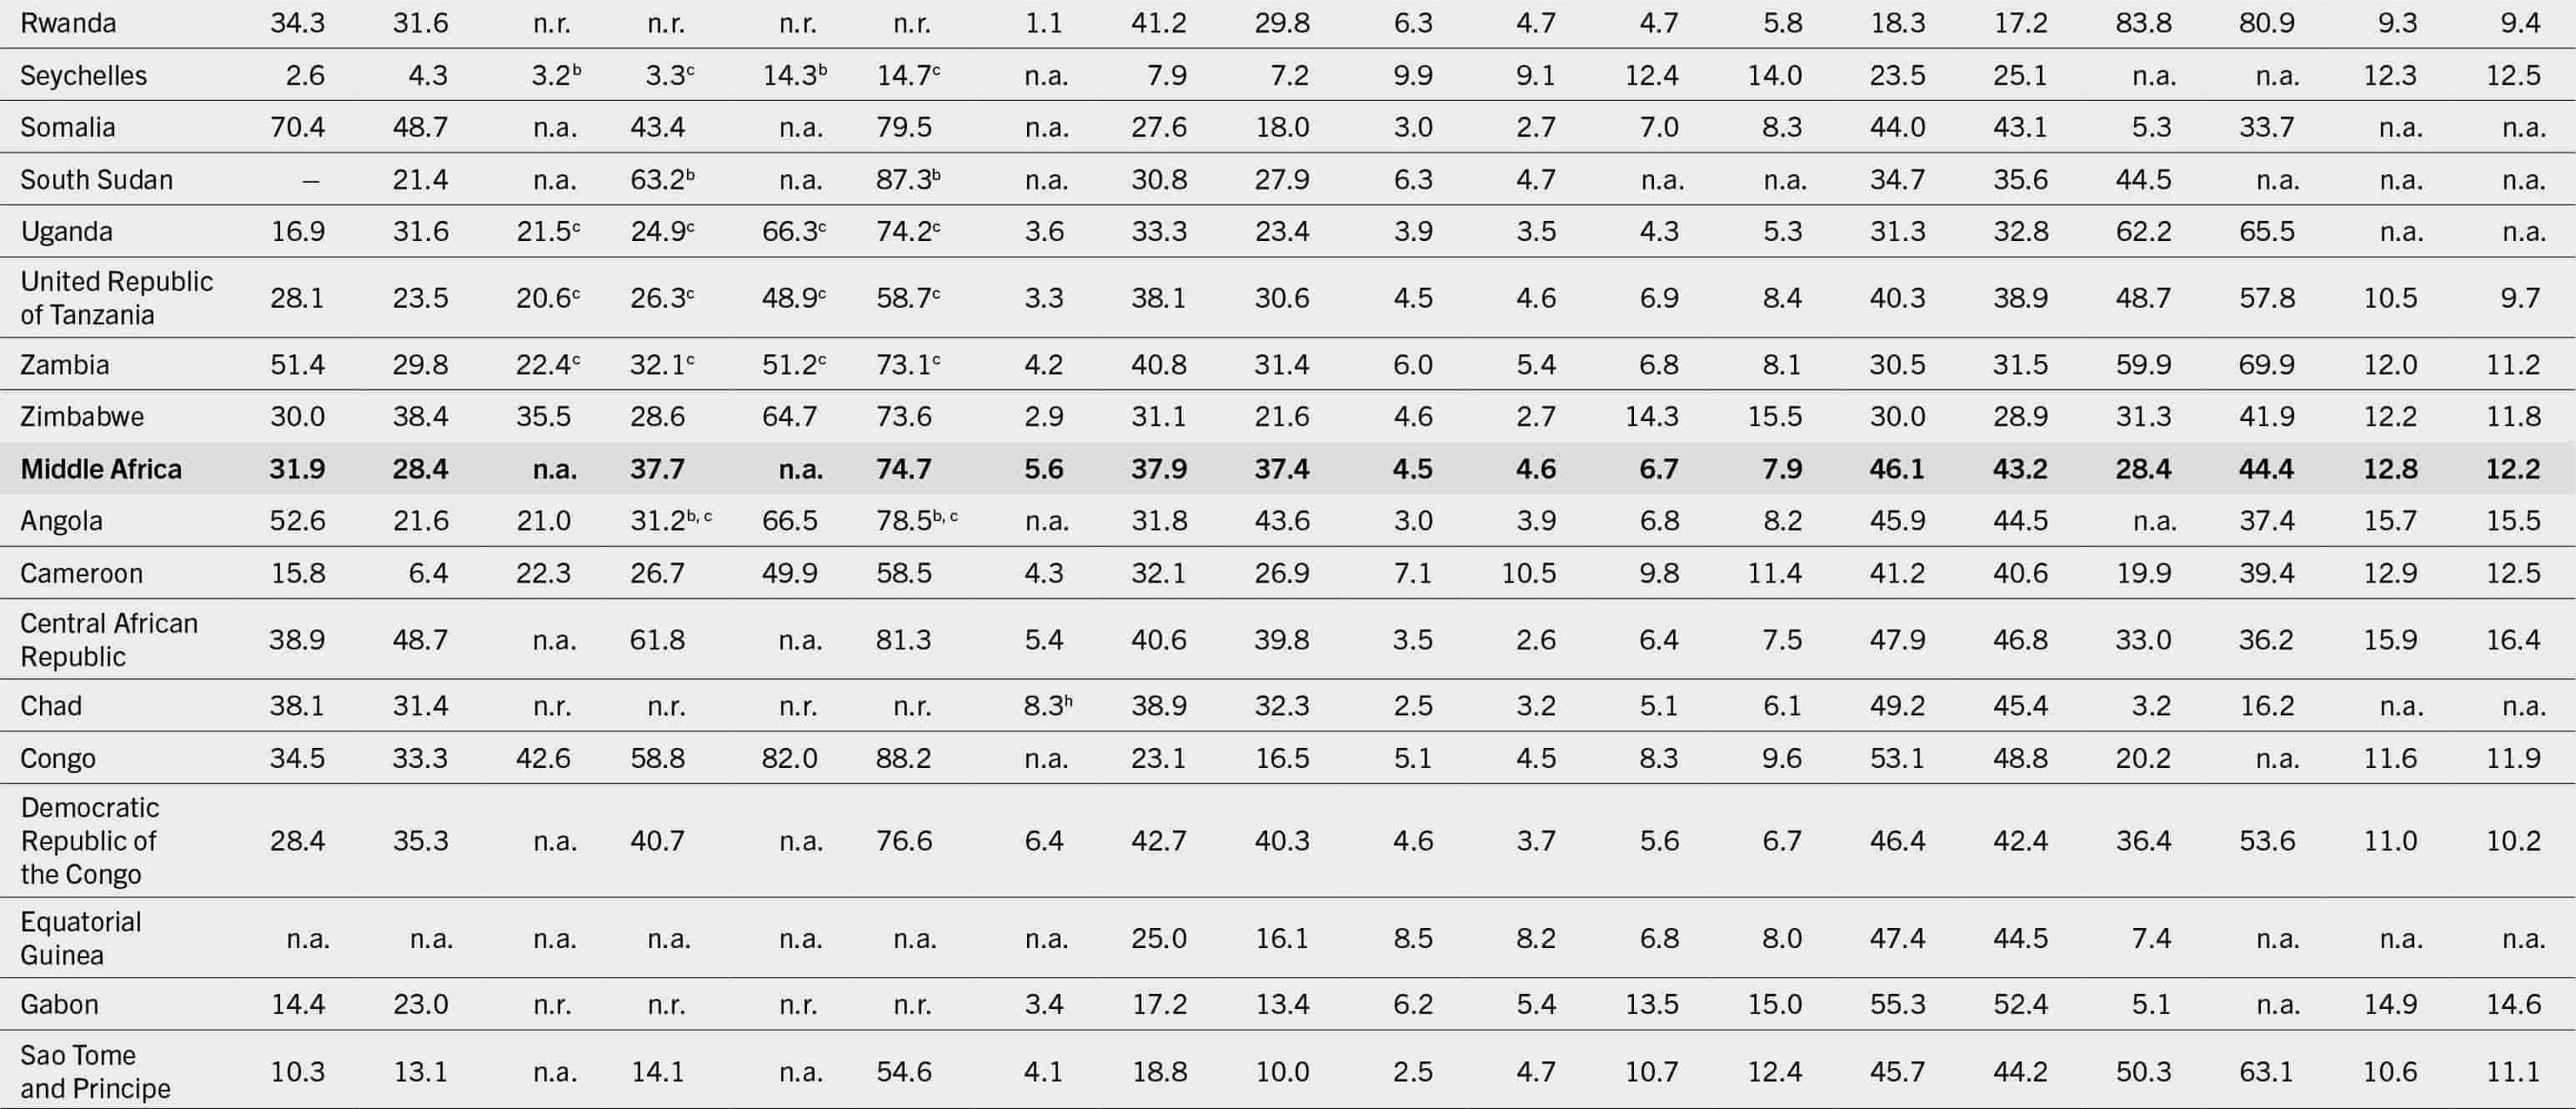
Table A1-1 (Continued1): Long Description The data is represented as regions/subregions/countries/territories: 2004-06, 2020-22 values for the prevalence of undernourishment in the total population, 2014-16, 2020-22 values for the prevalence of severe food insecurity in the total population, 2014-16, 2020-22 values for the prevalence of moderate or severe food insecurity in the total population, 2022 values for the prevalence of wasting in children (less than 5 years), 2012 and 2022 values for the prevalence of stunting in children (less than 5 years), 2012 and 2022 values for the prevalence of overweight in children (less 5 years), 2012, 2016 values for the prevalence of obesity in the adult population (greater than or equal to 18 years), 2012, 2019 values for the prevalence of anemia in women(15 to 49 years), 2012, 2021 values for the prevalence of exclusive breastfeeding among infants (0 to 5 months), and 2012, 2020 values for the prevalence of low birthweight. Rwanda: 34.3, 31.6, not available, not available, not available, not available, 1.1, 41.2, 29.8, 6.3, 4.7, 4.7, 5.8, 18.3, 17.2, 83.8, 80.9, 9.3, and 9.4. Seychelles: 2.6, 4.3, 3.2, 3.3, 14.3, 14.7, not available, 7.9, 7.2, 9.9, 9.1, 12.4, 14, 23.5, 25.1, not available, not available, 12.3, and 12.5. Somalia: 70.4, 48.7, not available, 43.4, not available, 79.5, not available, 27.6, 18, 3, 2.7, 7, 8.3, 44, 43.1, 5.3, 33.7, not available, not available. South Sudan: empty, 21.4, not available, 63.2, not available, 87.3, not available, 30.8, 27.9, 6.3, 4.7, not available, not available, 34.7, 35.6, 44.5, not available, not available, not available. Uganda: 16.9, 31.6, 21.5, 24.9, 66.3, 74.2, 3.6, 33.3, 23.4, 3.9, 3.5, 4.3, 5.3, 31.3, 32.8, 62.2, 65.5, not available, not available. United Republic of Tanzania: 28.1, 23.5, 20.6, 26.3, 48.9c, 58.7, 3.3, 38.1, 30.6, 4.5, 4.6, 6.9, 8.4, 40.3, 38.9, 48.7, 57.8, 10.5, and 9.7. Zambia: 51.4, 29.8, 22.4, 32.1, 51.2, 73.1, 4.2, 40.8, 31.4, 6, 5.4, 6.8, 8.1, 30.5, 31.5, 59.9, 69.9, 12, and 11.2. Zimbabwe: 30, 38.4, 35.5, 28.6, 64.7, 73.6, 2.9, 31.1, 21.6, 4.6, 2.7, 14.3, 15.5, 30, 28.9, 31.3, 41.9, 12.2, and 11.8. Middle Africa: 31.9, 28.4, not available, 37.7, not available, 74.7, 5.6, 37.9, 37.4, 4.5, 4.6, 6.7, 7.9, 46.1, 43.2, 28.4, 44.4, 12.8, and 12.2. Angola: 52.6, 21.6, 21, 31.2, 66.5, 78.5, not available, 31.8, 43.6, 3, 3.9, 6.8, 8.2, 45.9, 44.5, not available, 37.4, 15.7, and 15.5. Cameroon: 15.8, 6.4, 22.3, 26.7, 49.9, 58.5, 4.3, 32.1, 26.9, 7.1, 10.5, 9.8, 11.4, 41.2, 40.6, 19.9, 39.4, 12.9, and 12.5. Central African Republic: 38.9, 48.7, not available, 61.8, not available, 81.3, 5.4, 40.6, 39.8, 3.5, 2.6, 6.4, 7.5, 47.9, 46.8, 33, 36.2, 15.9, and 16.4. Chad: 38.1, 31.4, not available, not available, not available, not available, 8.3, 38.9, 32.3, 2.5, 3.2, 5.1, 6.1, 49.2, 45.4, 3.2, 16.2, not available, not available. Congo: 34.5, 33.3, 42.6, 58.8, 82, 88.2, not available, 23.1, 16.5, 5.1, 4.5, 8.3, 9.6, 53.1, 48.8, 20.2, not available, 11.6, and 11.9. Democratic Republic of the Congo: 28.4, 35.3, not available, 40.7, not available, 76.6, 6.4, 42.7, 40.3, 4.6, 3.7, 5.6, 6.7, 46.4, 42.4, 36.4, 53.6, 11, and 10.2. Equatorial Guinea: not available, not available, not available, not available, not available, not available, not available, 25, 16.1, 8.5, 8.2, 6.8, 8, 47.4, 44.5, 7.4, not available, not available, not available. Gabon: 14.4, 23, not available, not available, not available, not available, 3.4, 17.2, 13.4, 6.2, 5.4, 13.5, 15, 55.3, 52.4, 5.1, not available, 14.9, and 14.6. Sao Tome and Principe: 10.3, 13.1, not available, 14.1, not available, 54.6, 4.1, 18.8, 10, 2.5, 4.7, 10.7, 12.4, 45.7, 44.2, 50.3, 63.1, 10.6, and 11.1.
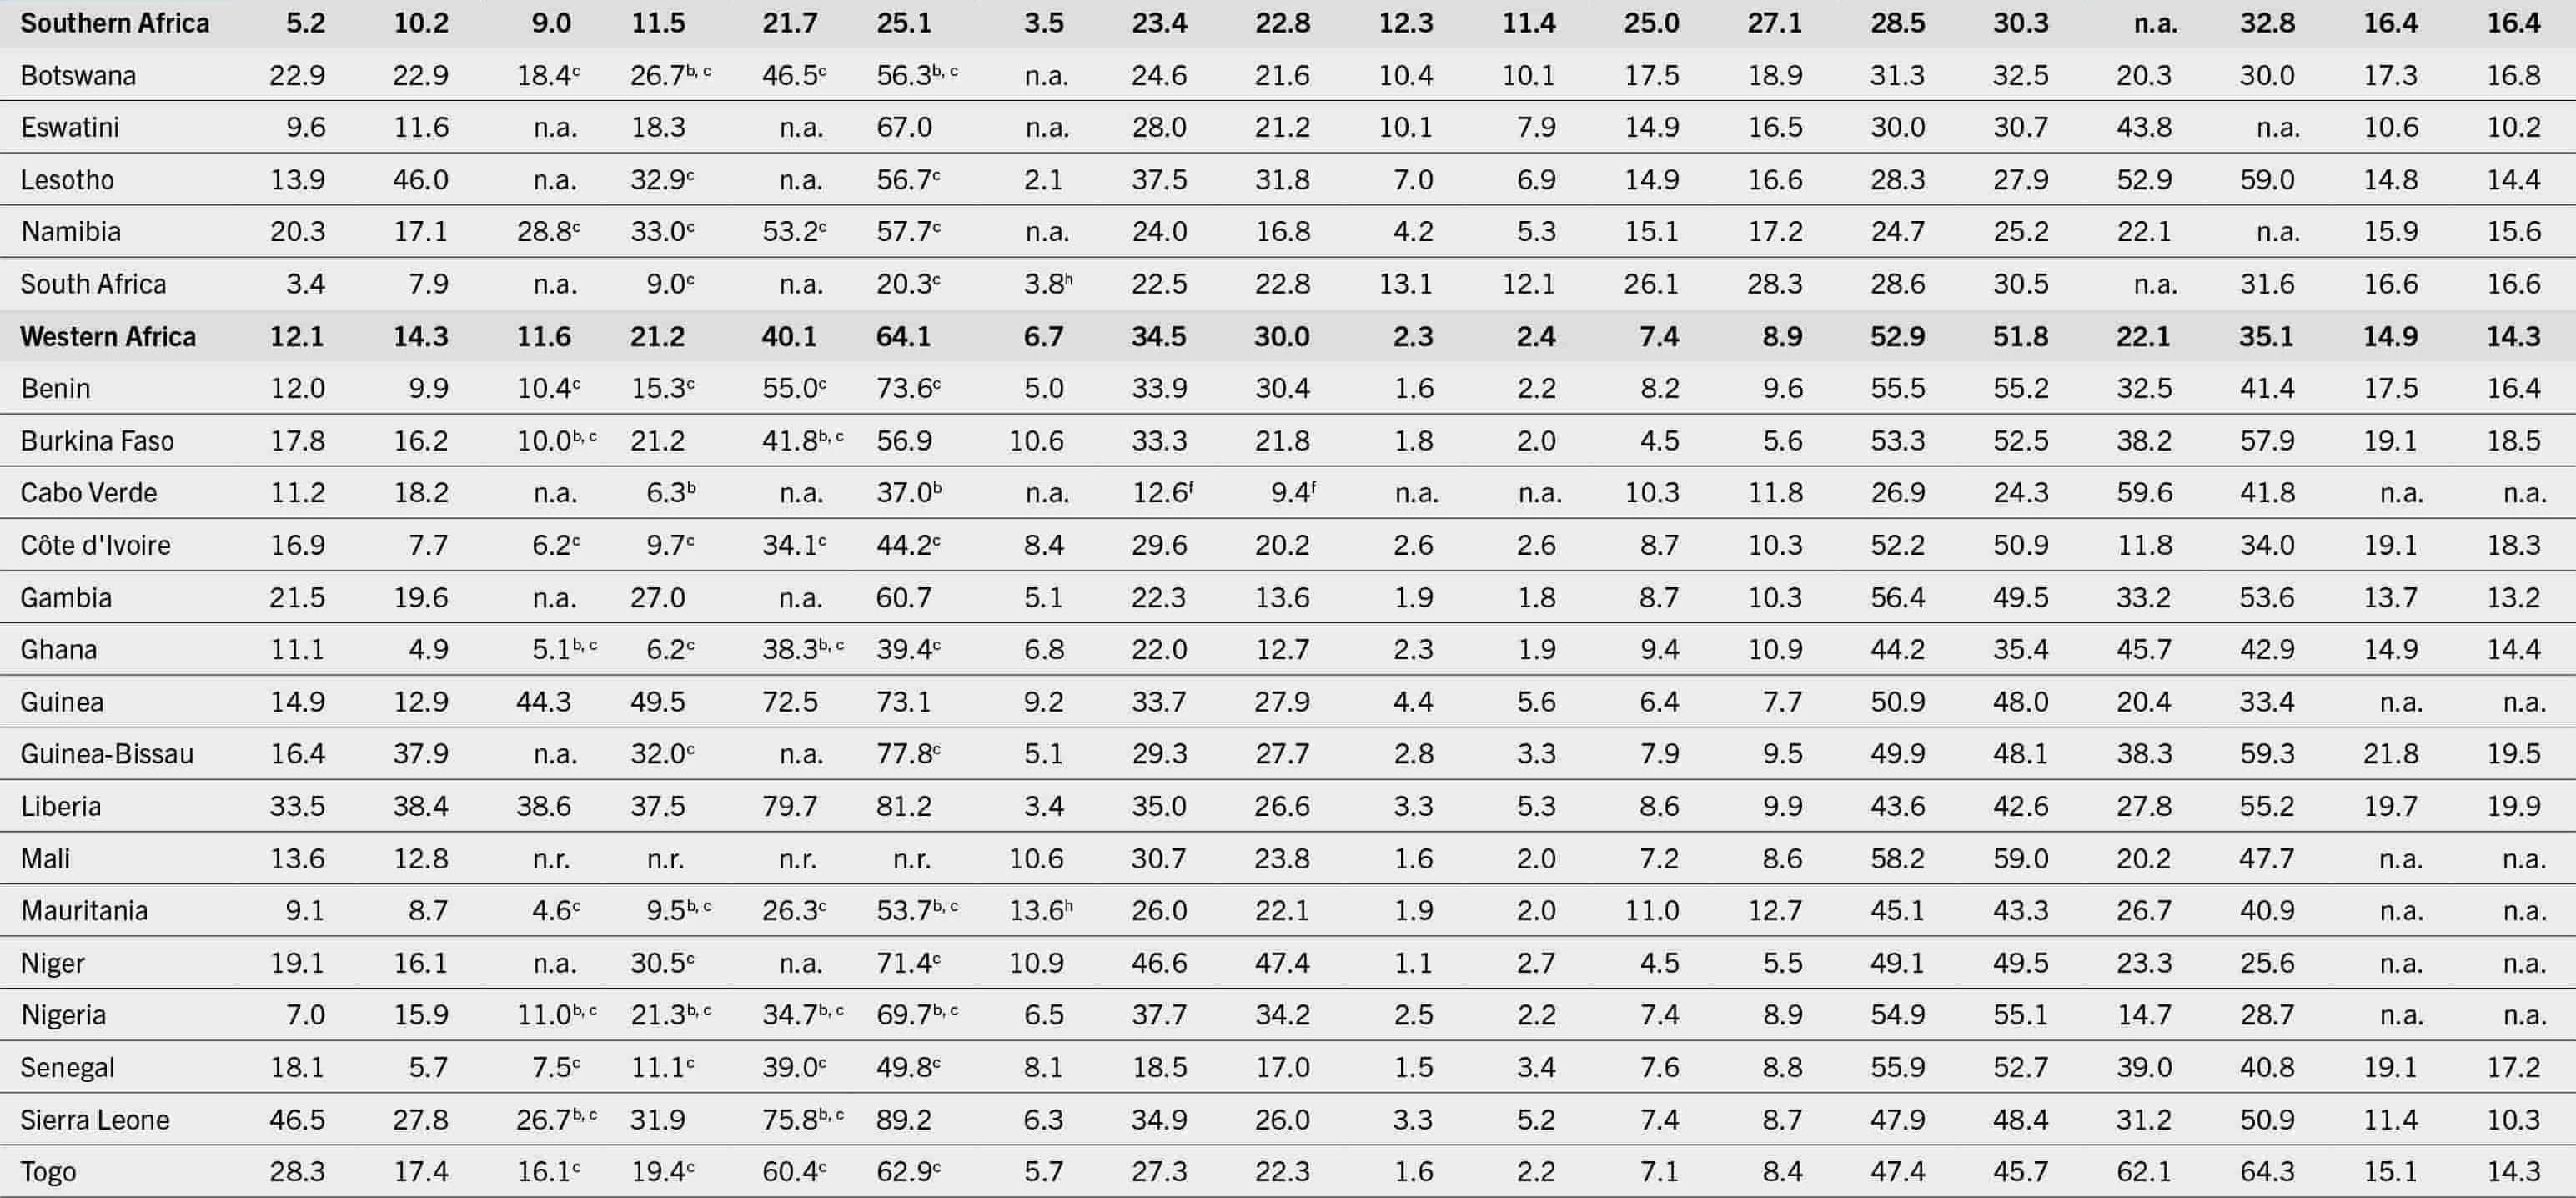
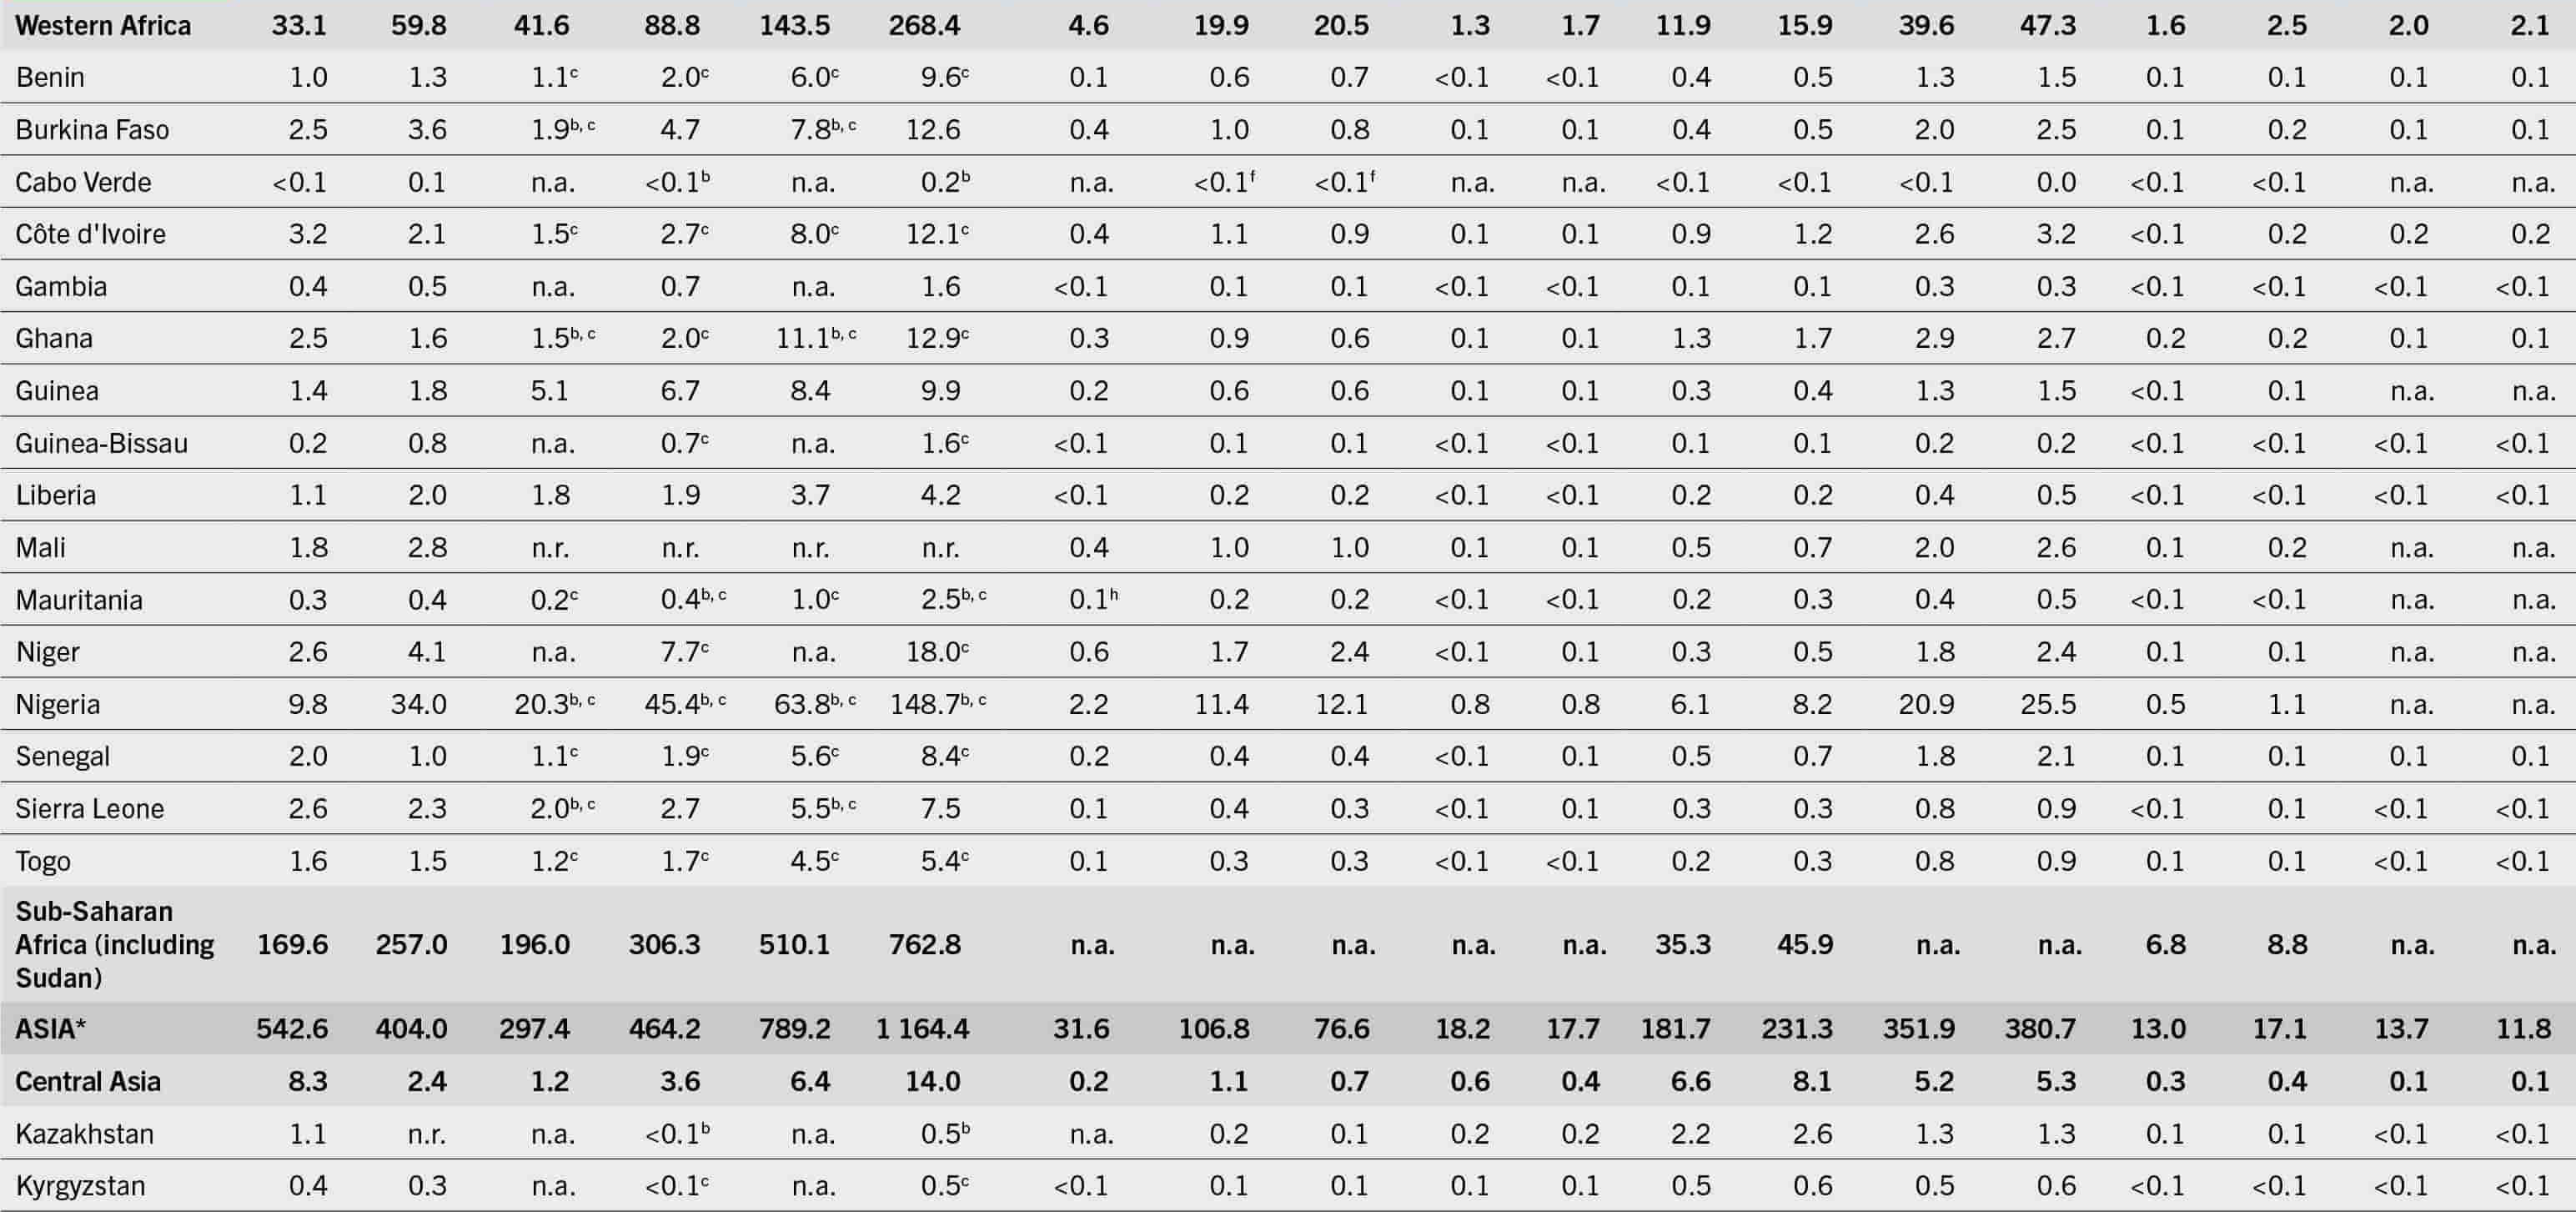
Table A1-1 (Continued2): Long Description The data is represented as regions/subregions/countries/territories: 2004-06, 2020-22 values for the prevalence of undernourishment in the total population, 2014-16, 2020-22 values for the prevalence of severe food insecurity in the total population, 2014-16, 2020-22 values for the prevalence of moderate or severe food insecurity in the total population, 2022 values for the prevalence of wasting in children (less than 5 years), 2012 and 2022 values for the prevalence of stunting in children (less than 5 years), 2012 and 2022 values for the prevalence of overweight in children (less 5 years), 2012, 2016 values for the prevalence of obesity in the adult population (greater than or equal to 18 years), 2012, 2019 values for the prevalence of anemia in women(15 to 49 years), 2012, 2021 values for the prevalence of exclusive breastfeeding among infants (0 to 5 months), and 2012, 2020 values for the prevalence of low birthweight. Botswana: 22.9, 22.9, 18.4, 26.7, 46.5, 56.3, not available, 24.6, 21.6, 10.4, 10.1, 17.5, 18.9, 31.3, 32.5, 20.3, 30, 17.3, and 16.8. Eswatini: 9.6, 11.6, not available, 18.3, not available, 67, not available, 28, 21.2, 10.1, 7.9, 14.9, 16.5, 30, 30.7, 43.8, not available, 10.6, and 10.2. Lesotho: 13.9, 46, not available, 32.9, not available, 56.7, 2.1, 37.5, 31.8, 7, 6.9, 14.9, 16.6, 28.3, 27.9, 52.9, 59, 14.8, and 14.4. Namibia: 20.3, 17.1, 28.8, 33, 53.2, 57.7, not available, 24, 16.8, 4.2, 5.3, 15.1, 17.2, 24.7, 25.2, 22.1, not available, 15.9, and 15.6. South Africa: 3.4, 7.9, not available, 9, not available, 20.3, 3.8, 22.5, 22.8, 13.1, 12.1, 26.1, 28.3, 28.6, 30.5, not available, 31.6, 16.6, and 16.6. Benin: 12, 9.9, 10.4, 15.3, 55, 73.6, 5, 33.9, 30.4, 1.6, 2.2, 8.2, 9.6, 55.5, 55.2, 32.5, 41.4, 17.5, and 16.4. Burkina Faso: 17.8, 16.2, 10, 21.2, 41.8, 56.9, 10.6, 33.3, 21.8, 1.8, 2, 4.5, 5.6, 53.3, 52.5, 38.2, 57.9, 19.1, and 18.5. Cabo Verde: 11.2, 18.2, not available, 6.3, not available, 37, not available, 12.6, 9.4, not available, not available, 10.3, 11.8, 26.9, 24.3, 59.6, 41.8, not available, and not available. Côte d'Ivoire: 16.9, 7.7, 6.2, 9.7, 34.1, 44.2, 8.4, 29.6, 20.2, 2.6, 2.6, 8.7, 10.3, 52.2, 50.9, 11.8, 34, 19.1, and 18.3. Gambia: 21.5, 19.6, not available, 27, not available, 60.7, 5.1, 22.3, 13.6, 1.9, 1.8, 8.7, 10.3, 56.4, 49.5, 33.2, 53.6, 13.7, and 13.2. Ghana: 11.1, 4.9, 5.1, 6.2, 38.3, 39.4, 6.8, 22, 12.7, 2.3, 1.9, 9.4, 10.9, 44.2, 35.4, 45.7, 42.9, 14.9, and 14.4. Guinea: 14.9, 12.9, 44.3, 49.5, 72.5, 73.1, 9.2, 33.7, 27.9, 4.4, 5.6, 6.4, 7.7, 50.9, 48, 20.4, 33.4, not available, and not available. Guinea-Bissau: 16.4, 37.9, not available, 32, not available, 77.8, 5.1, 29.3, 27.7, 2.8, 3.3, 7.9, 9.5, 49.9, 48.1, 38.3, 59.3, 21.8, and 19.5. Liberia: 33.5, 38.4, 38.6, 37.5, 79.7, 81.2, 3.4, 35, 26.6, 3.3, 5.3, 8.6, 9.9, 43.6, 42.6, 27.8, 55.2, 19.7, and 19.9. Mali: 13.6, 12.8, not available, not available, not available, not available, 10.6, 30.7, 23.8, 1.6, 2, 7.2, 8.6, 58.2, 59, 20.2, 47.7, not available, and not available. Mauritania: 9.1, 8.7, 4.6, 9.5, 26.3, 53.7, 13.6, 26, 22.1, 1.9, 2, 11, 12.7, 45.1, 43.3, 26.7, 40.9, not available, and not available. Niger: 19.1, 16.1, not available, 30.5, not available, 71.4, 10.9, 46.6, 47.4, 1.1, 2.7, 4.5, 5.5, 49.1, 49.5, 23.3, 25.6, not available, and not available. Nigeria: 7, 15.9, 11, 21.3, 34.7, 69.7, 6.5, 37.7, 34.2, 2.5, 2.2, 7.4, 8.9, 54.9, 55.1, 14.7, 28.7, not available, and not available. Senegal: 18.1, 5.7, 7.5, 11.1, 39, 49.8, 8.1, 18.5, 17, 1.5, 3.4, 7.6, 8.8, 55.9, 52.7, 39, 40.8, 19.1, and 17.2. Sierra Leone: 46.5, 27.8, 26.7, 31.9, 75.8, 89.2, 6.3, 34.9, 26, 3.3, 5.2, 7.4, 8.7, 47.9, 48.4, 31.2, 50.9, 11.4, and 10.3. Togo: 28.3, 17.4, 16.1, 19.4, 60.4, 62.9, 5.7, 27.3, 22.3, 1.6, 2.2, 7.1, 8.4, 47.4, 45.7, 62.1, 64.3, 15.1, and 14.3.
Table A1-1 (Continued3): Long Description The data is represented as regions/subregions/countries/territories: 2004-06, 2020-22 values for the prevalence of undernourishment in the total population, 2014-16, 2020-22 values for the prevalence of severe food insecurity in the total population, 2014-16, 2020-22 values for the prevalence of moderate or severe food insecurity in the total population, 2022 values for the prevalence of wasting in children (less than 5 years), 2012 and 2022 values for the prevalence of stunting in children (less than 5 years), 2012 and 2022 values for the prevalence of overweight in children (less 5 years), 2012, 2016 values for the prevalence of obesity in the adult population (greater than or equal to 18 years), 2012, 2019 values for the prevalence of anemia in women(15 to 49 years), 2012, 2021 values for the prevalence of exclusive breastfeeding among infants (0 to 5 months), and 2012, 2020 values for the prevalence of low birthweight. Sub-Saharan Africa (including Sudan): 22, 21.7, 19.4, 25.9, 50.5, 64.4, not available, not available, not available, not available, not available, 7.7, 8.9, not available, not available, 34.6, 45.1, not available, and not available. Asia: 13.6, 8.6, 6.7, 9.9, 17.7, 24.8, 9.3, 28.2, 22.3, 4.8, 5.1, 6.1, 7.3, 31.1, 32.7, 39, 51.5, 17.2, and 17.2. Central Asia: 14, 3.2, 1.7, 4.8, 9.2, 18.4, 2.1, 14.7, 7.7, 8.2, 5, 15.6, 17.7, 28.8, 28.1, 29.2, 44.9, 6.3, and 6. Kazakhstan: 7.2, less than 2.5, not available, 0.5, not available, 2.4, not available, 11, 4.9, 12.1, 7.7, 19, 21, 27.3, 28.7, 31.8, 37.8, 5.7, and 5.3. Kyrgyzstan: 8, 4.8, not available, 1.1, not available, 6.9, 2, 16, 10.3, 7.9, 6.4, 14.4, 16.6, 34.1, 35.8, 56, 45.6, 6.4, and 6. Tajikistan: 37.6, 9.3, not available, not available, not available, not available, 5.6, 25.7, 13.1, 5.4, 3, 12.2, 14.2, 31, 35.2, 32.6, 35.8, 9.3, and 8.7. Turkmenistan: 4.2, 5.7, not available, not available, not available, not available, 4.1, 12.5, 6.7, 5.4, 3.6, 16.3, 18.6, 25.3, 26.6, 10.9, 56.5, 4.9, and 4.3. Uzbekistan: 14.8, less than 2.5, 1.9, 6.8, 11.2, 26.1, 2.4, 13.2, 6.9, 7.7, 4.2, 14.4, 16.6, 28.7, 24.8, 23.8, 49.5, 5.8, and 5.8. Eastern Asia: 6.9, less than 2.5, 1, 1.3, 6, 6.7, 1.5, 7.7, 4.9, 6.6, 8.3, 4.9, 6, 15.5, 16.1, 28.4, 35.3, 5.5, and 5.5. China: 7, less than 2.5, not available, not available, not available, not available, 1.9, 7.6, 4.6, 7, 8.9, 5, 6.2, 14.8, 15.5, 27.6, 34.1, 5.1, and 5. China, mainland: 7.1, less than 2.5, not available, not available, not available, not available, not available, not available, not available, not available, not available, not available, not available, not available, not available, not available, not available, and not available. Taiwan Province of China: 4.3, 3, not available, not available, not available, not available, not available, not available, not available, not available, not available, not available, not available, 27, 28.4, not available, not available, not available, and not available. China, Hong Kong SAR: less than 2.5, less than 2.5, not available, not available, not available, not available, not available, not available, not available, not available, not available, not available, not available, not available, not available, not available, not available, and not available. China, Macao SAR: 15.9, 8, not available, not available, not available, not available, not available, not available, not available, not available, not available, not available, not available, not available, not available, not available, not available, and not available. Democratic People’s Republic of Korea: 34.3, 45.5, not available, not available, not available, not available, 2.5, 25.7, 16.8, 1.6, 2.8, 5.9, 6.8, 31.7, 33.9, 68.9, 71.4, not available, and not available. Japan: less than 2.5, 3.2, less than 0.5, 0.9, 2.6, 4.4, not available, 6.5, 5, 1.7, 2.1, 3.6, 4.3, 19.7, 19, not available, not available, 11.1, and 11.3. Mongolia: 28.8, 8, less than 0.5, less than 0.5, 6.8, 5.7, 0.9, 12.2, 6.1, 9.8, 10.7, 17.9, 20.6, 14.3, 14.5, 65.7, 58, 5.7, and 4.9. Republic of Korea: less than 2.5, less than 2.5, less than 0.5, 0.8, 4.8, 5.6, 0.2, 1.9, 1.7, 6.8, 5.4, 4.1, 4.7, 13.7, 13.5, not available, not available, 6.3, and 7.5.
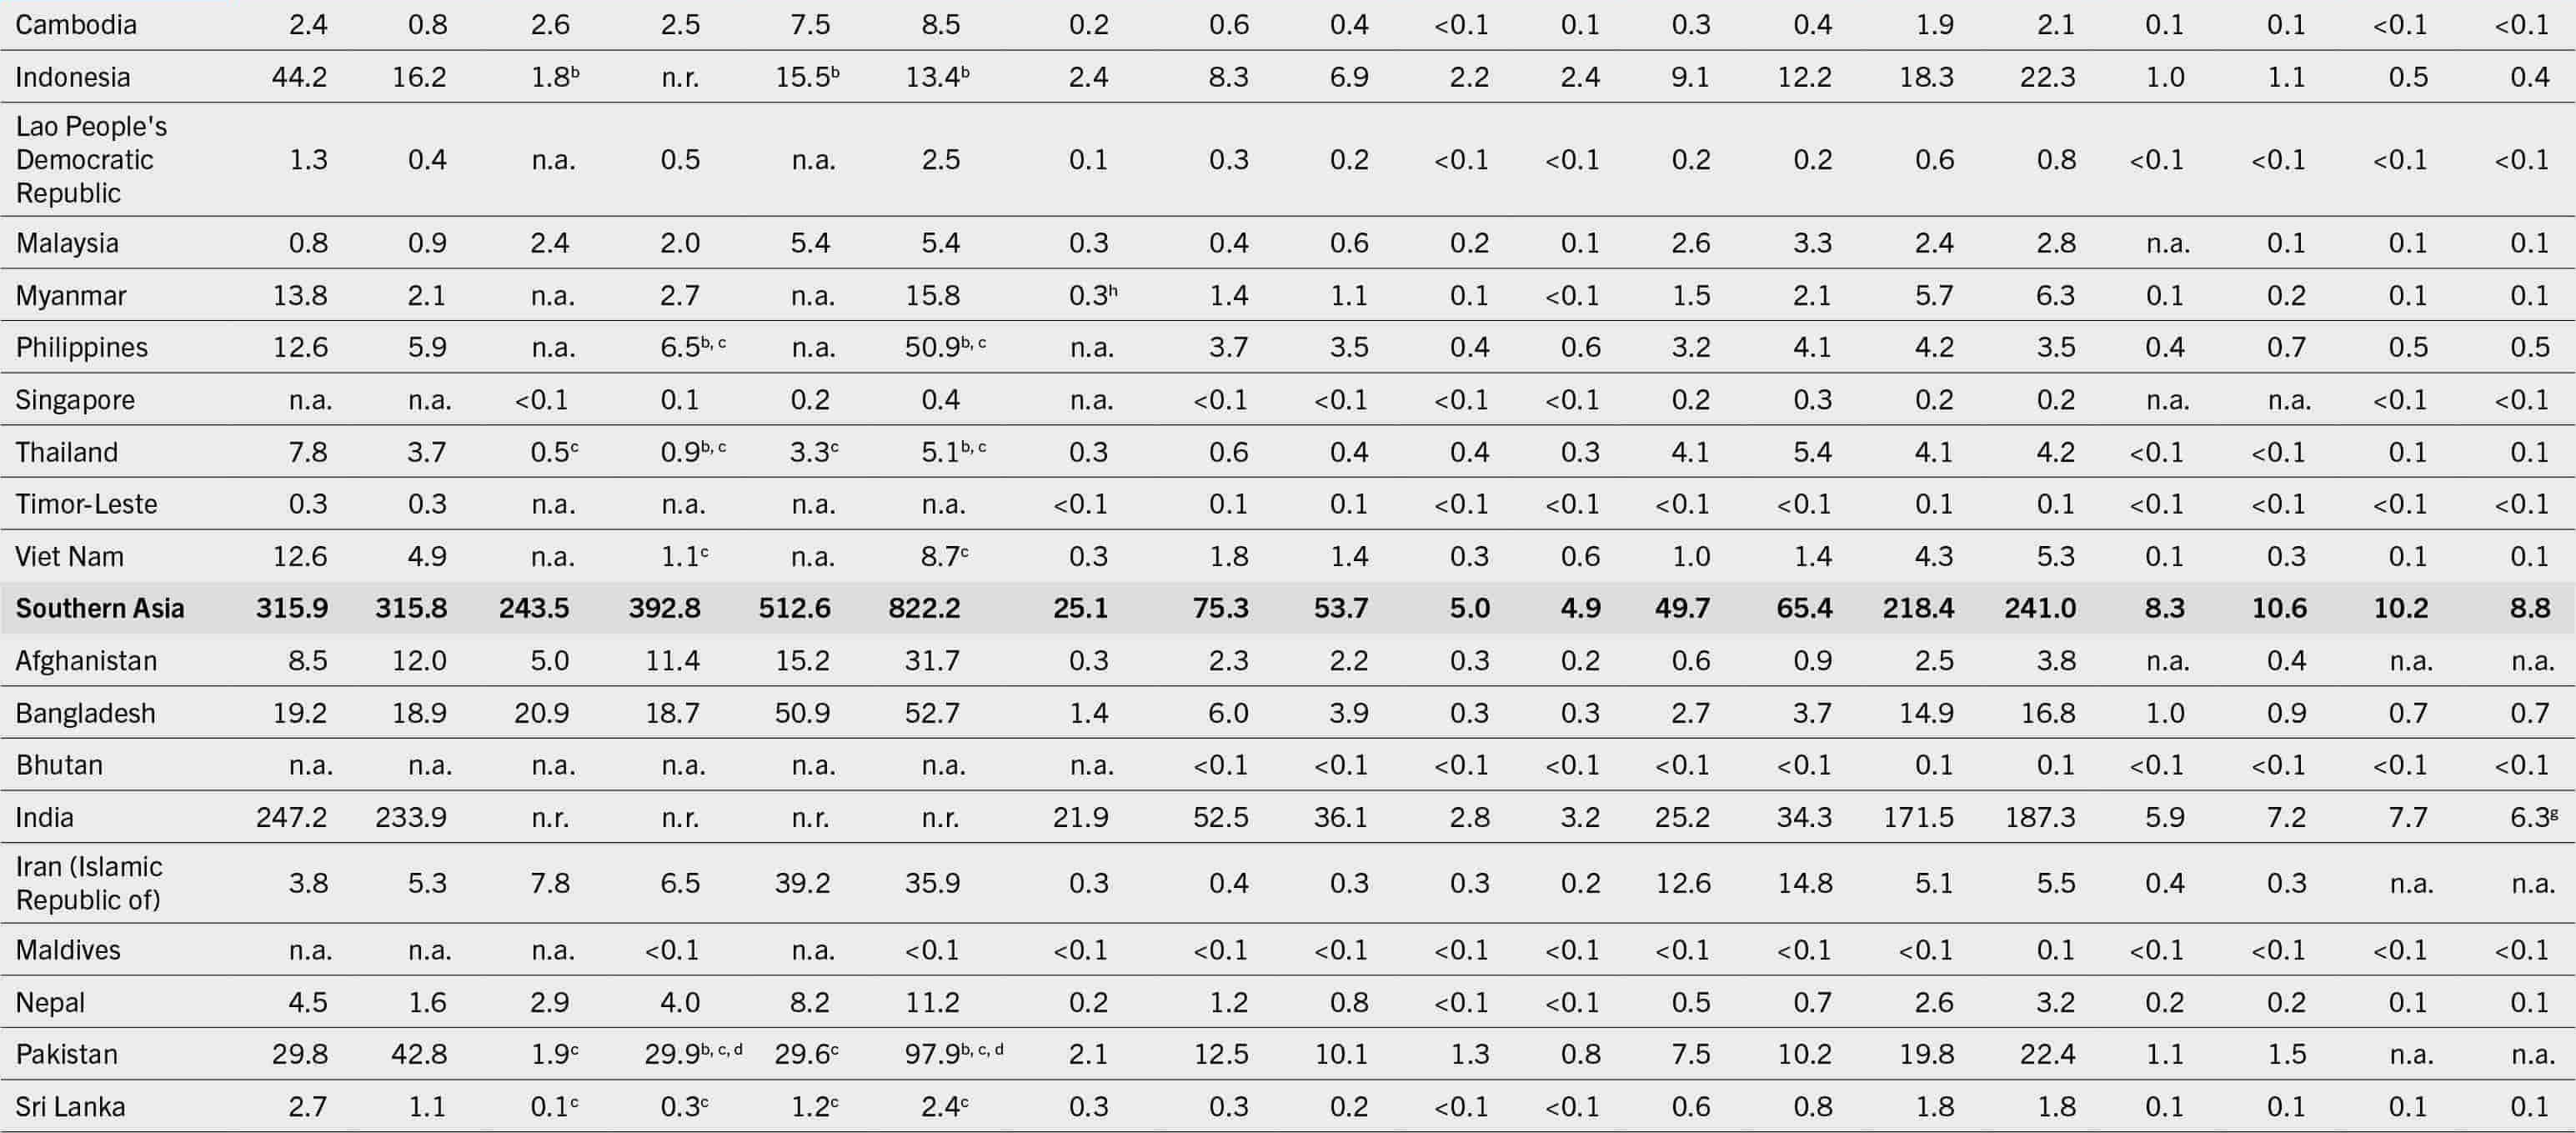
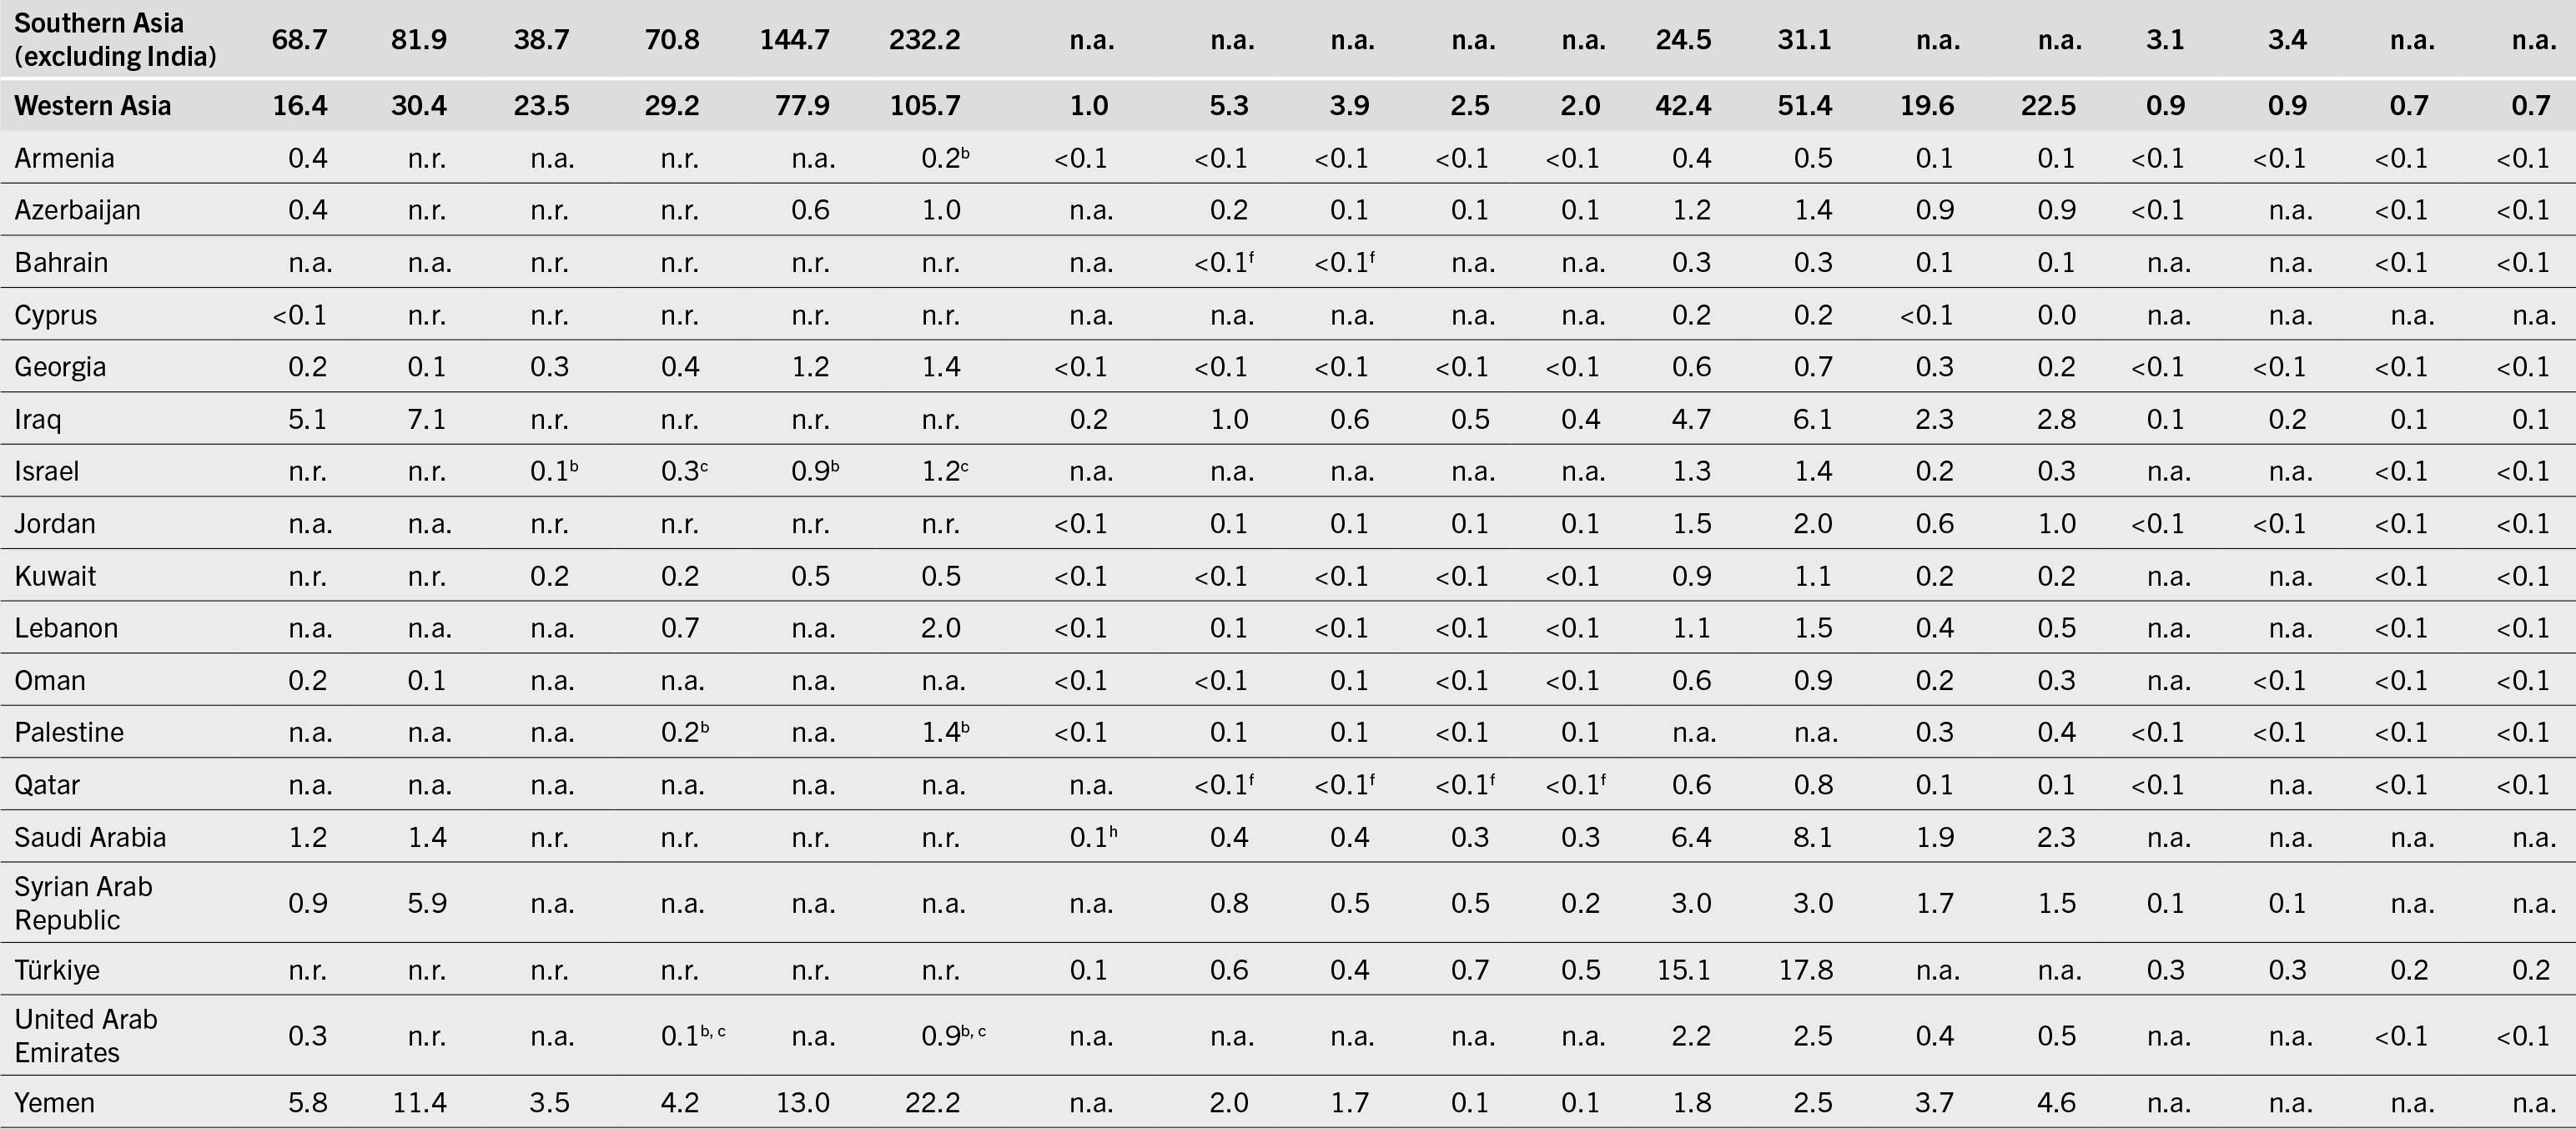
Table A1-1 (Continued4): Long Description The data is represented as regions/subregions/countries/territories: 2004-06, 2020-22 values for the prevalence of undernourishment in the total population, 2014-16, 2020-22 values for the prevalence of severe food insecurity in the total population, 2014-16, 2020-22 values for the prevalence of moderate or severe food insecurity in the total population, 2022 values for the prevalence of wasting in children (less than 5 years), 2012 and 2022 values for the prevalence of stunting in children (less than 5 years), 2012 and 2022 values for the prevalence of overweight in children (less 5 years), 2012, 2016 values for the prevalence of obesity in the adult population (greater than or equal to 18 years), 2012, 2019 values for the prevalence of anemia in women(15 to 49 years), 2012, 2021 values for the prevalence of exclusive breastfeeding among infants (0 to 5 months), and 2012, 2020 values for the prevalence of low birthweight. Eastern Asia (excluding China and Japan): 9.2, 11.8, less than 0.5, 0.9, 3.7, 4.9, not available, not available, not available, not available, not available, not available, not available, not available, not available, not available, not available, and not available. South-eastern Asia: 17.1, 5.2, 2, 2.4, 14.7, 16.4, 7.8, 30.4, 26.4, 6.4, 7.4, 5.4, 6.7, 25, 27.2, 33.4, 48.3, 12.8, and 12.5. Brunei Darussalam: not available, not available, not available, not available, not available, not available, not available, 17, 10.9, 8.6, 9.1, 12.1, 14.1, 14.8, 16.7, not available, not available, 13.2, and 13.6. Cambodia: 17.8, 4.8, 16.9, 14.8, 48.9, 51.1, 9.6, 33.8, 22.3, 2.2, 3.8, 3.1, 3.9, 46.1, 47.1, 72.8, 51.2, 12.7, and 11.4. Indonesia: 19.3, 5.9, 0.7, less than 0.5, 6, 4.9, 10.2, 34.6, 31, 9.2, 10.6, 5.5, 6.9, 27, 31.2, 40.9, 50.7, 10.5, and 9.9. Lao People's Democratic Republic: 22.7, 4.7, not available, 7.2, not available, 34.1, 9, 40.4, 27.7, 2.2, 4, 4.1, 5.3, 36.3, 39.5, 39.7, 44.4, 17.2, and 16.7. Malaysia: 3.1, 2.7, 7.8, 6, 17.4, 16, 9.7, 17.6, 21.9, 6.2, 5.7, 13.1, 15.6, 30.1, 32, not available, 40.3, 13, and 13.8. Myanmar: 29, 3.8, not available, 5, not available, 29.3, 7.4, 31.1, 24.1, 1.8, 0.8, 4.6, 5.8, 39.4, 42.1, 23.6, 51.2, 12.7, and 12.5. Philippines: 14.6, 5.2, not available, 5.7, not available, 44.7, not available, 31.9, 28.8, 3.5, 4.6, 5.4, 6.4, 16.9, 12.3, 33, 54.9, 21.2, and 21.1. Singapore: not available, not available, 1, 1.7, 2.8, 6.6, not available, 3.4, 3, 3, 3.8, 5.6, 6.1, 11.5, 13, not available, not available, 10.6, and 11. Thailand: 11.9, 5.2, 0.7, 1.3, 4.7, 7.1, 7.7, 14, 11.8, 9.1, 8.6, 7.9, 10, 22.1, 24, 12.3, 14, 10.5, and 10.3. Timor-Leste: 33.1, 22.3, not available, not available, not available, not available, 8.3, 52.5, 45.1, 2.4, 1.3, 2.9, 3.8, 26.8, 29.9, 50.8, 65, 16.8, and 18.2. Viet Nam: 15.2, 5, not available, 1.2, not available, 9, 4.7, 25.4, 19.3, 4.3, 8.1, 1.6, 2.1, 17, 20.6, 17, 45.4, 7.6, and 6.3. Southern Asia: 19.6, 15.9, 13.1, 19.7, 27.6, 41.3, 14.3, 40.3, 30.5, 2.7, 2.8, 4.5, 5.4, 48.3, 48.2, 47.2, 60.2, 26.1, and 24.4. Afghanistan: 34.5, 30.1, 14.8, 28.4, 45.1, 79.1, 5.1, 44.3, 33.1, 5, 3.7, 4.4, 5.5, 37.5, 42.6, not available, 57.5, not available, and not available. Bangladesh: 13.7, 11.2, 13.3, 11, 32.2, 31.1, 9.8, 39.2, 26.4, 1.8, 2.1, 2.8, 3.6, 35.7, 36.7, 64.1, 62.6, 24.3, and 23. Bhutan: not available, not available, not available, not available, not available, not available, not available, 30.2, 22.7, 6.9, 6.5, 5.2, 6.4, 39.8, 38.6, 48.7, 53.2, 11.7, and 11.4. India: 21.4, 16.6, not available, not available, not available, not available, 18.7, 41.6, 31.7, 2.2, 2.8, 3.1, 3.9, 53.2, 53, 46.4, 63.7, 29.5, and 27.4. Iran (Islamic Republic of): 5.4, 6.1, 9.5, 7.4, 48, 40.8, 4.3, 5.9, 4.7, 4.8, 3.8, 23.3, 25.8, 22.8, 24.1, 53.1, 47.4, not available, and not available.
Table A1-1 (Continued5): Long Description The data is represented as regions/subregions/countries/territories: 2004-06, 2020-22 values for the prevalence of undernourishment in the total population, 2014-16, 2020-22 values for the prevalence of severe food insecurity in the total population, 2014-16, 2020-22 values for the prevalence of moderate or severe food insecurity in the total population, 2022 values for the prevalence of wasting in children (less than 5 years), 2012 and 2022 values for the prevalence of stunting in children (less than 5 years), 2012 and 2022 values for the prevalence of overweight in children (less 5 years), 2012, 2016 values for the prevalence of obesity in the adult population (greater than or equal to 18 years), 2012, 2019 values for the prevalence of anemia in women(15 to 49 years), 2012, 2021 values for the prevalence of exclusive breastfeeding among infants (0 to 5 months), and 2012, 2020 values for the prevalence of low birthweight. Maldives: not available, not available, not available, 2.2, not available, 13.4, 9.1, 16.4, 13.9, 6, 3.3, 6.7, 8.6, 45.6, 52.2, 45.3, 63, 13.8, and 13.7. Nepal: 17, 5.4, 10.4, 13.2, 29.5, 37.4, 7.7, 40.3, 26.7, 1.2, 1.7, 3.3, 4.1, 35.9, 35.7, 69.6, 62.1, 20.9, and 19.7. Pakistan: 17.1, 18.5, 0.9, 12.9, 14.1, 42.3, 7.1, 43.8, 34, 4.6, 2.7, 7.1, 8.6, 42.7, 41.3, 37, 47.8, not available, and not available. Sri Lanka: 13.9, 5.3, 0.7, 1.2, 5.9, 10.9, 15.1, 16.7, 15.9, 1.2, 1.3, 4.1, 5.2, 33.5, 34.6, 75.8, 80.9, 18.5, and 18. Southern Asia (excluding India): 15, 14.1, 7.3, 12.2, 27.1, 39.9, not available, not available, not available, not available, not available, 8.2, 9.5, not available, not available, 49, 53.8, not available, and not available. Western Asia: 7.8, 10.5, 8.9, 10.1, 29.4, 36.5, 3.5, 19.1, 14, 9.1, 7.2, 27.2, 29.8, 31.7, 32.5, 31.9, 31.7, 12.2, and 12.2. Armenia: 12.3, less than 2.5, not available, less than 0.5, not available, 7.1, 4.4, 13.9, 7.2, 15, 11.5, 18.3, 20.2, 17.6, 17.3, 34.1, 44.5, 8.3, and 8.3. Azerbaijan: 4.7, less than 2.5, less than 0.5, less than 0.5, 5.9, 10.1, not available, 17.4, 13.3, 12.2, 10.1, 17.7, 19.9, 34.7, 35.1, 10.8, not available, 11, and 11. Bahrain: not available, not available, not available, not available, not available, not available, not available, 6.8, 5, not available, not available, 27.6, 29.8, 36.3, 35.4, not available, not available, 11.6, and 12.4. Cyprus: 7.7, less than 2.5, not available, not available, not available, not available, not available, not available, not available, not available, not available, 20.4, 21.8, 12, 13.6, not available, not available, not available, not available. Georgia: 3.9, 2.9, 7, 9.7, 31.8, 36.5, 0.6, 8.8, 4.8, 13.9, 5, 19.3, 21.7, 26.9, 27.5, 54.8, 20.4, 6.9, and 7.4. Iraq: 17.8, 16.3, not available, not available, not available, not available, 3, 19.6, 9.9, 9.5, 6.4, 28, 30.4, 29.8, 28.6, 19.4, 25.8, 10.8, and 10.9. Israel: less than 2.5, less than 2.5, 1.3, 3.1, 11, 13.2, not available, not available, not available, not available, not available, 24.8, 26.1, 11.5, 12.9, not available, not available, 9.4, and 9. Jordan: not available, not available, 14.3, 17.7, 30.1, 43.9, 0.6, 7.7, 6.6, 5.9, 9.5, 33.1, 35.5, 30.5, 37.7, 22.7, 17.8, 17, and 18.9. Kuwait: less than 2.5, less than 2.5, 4.9, 4.5, 12.6, 10.9, 2.3, 4.8, 6.9, 9, 11.7, 35.6, 37.9, 21.1, 23.7, not available, not available, 12.4, and 14.4. Lebanon: not available, not available, not available, 12.6, not available, 36.5, 1.4, 11.7, 7.4, 8.5, 8.3, 29.7, 32, 25.4, 28.3, not available, not available, 12.2, and 12.6. Oman: 9.4, 2.8, not available, not available, not available, not available, 9.3, 11.1, 12.7, 2.9, 6.5, 24.3, 27, 29, 29.1, not available, 23.2, 13.3, and 13.2. Palestine: not available, not available, not available, 4, not available, 28.1, 1.3, 10.3, 7.5, 7.6, 8.3, not available, not available, 30.5, 31, 28.7, 38.9, 9.8, and 10.4. Qatar: not available, not available, not available, not available, not available, not available, not available, 6.2, 4.4, 12.2, 11.7, 32.4, 35.1, 27.1, 28.1, 29.3, not available, 9.9, and 10. Saudi Arabia: 4.9, 3.8, not available, not available, not available, not available, 4.4, 11.8, 12.4, 9.3, 10.1, 32.8, 35.4, 25.8, 27.5, not available, not available, not available, not available. Syrian Arab Republic: 4.9, 27.8, not available, not available, not available, not available, not available, 26.4, 25.4, 16.6, 11.7, 25.1, 27.8, 31.7, 32.8, 42.6, 28.5, not available, and not available. Türkiye: less than 2.5, less than 2.5, not available, not available, not available, not available, 1.7, 9.1, 5.5, 10.2, 8.1, 29.5, 32.1, not available, not available, 41.6, 40.7, 14, and 12.9. United Arab Emirates: 7.6, less than 2.5, not available, 1.2, not available, 9.8, not available, not available, not available, not available, not available, 29, 31.7, 24, 24.3, not available, not available, 13.9, and 13.9.
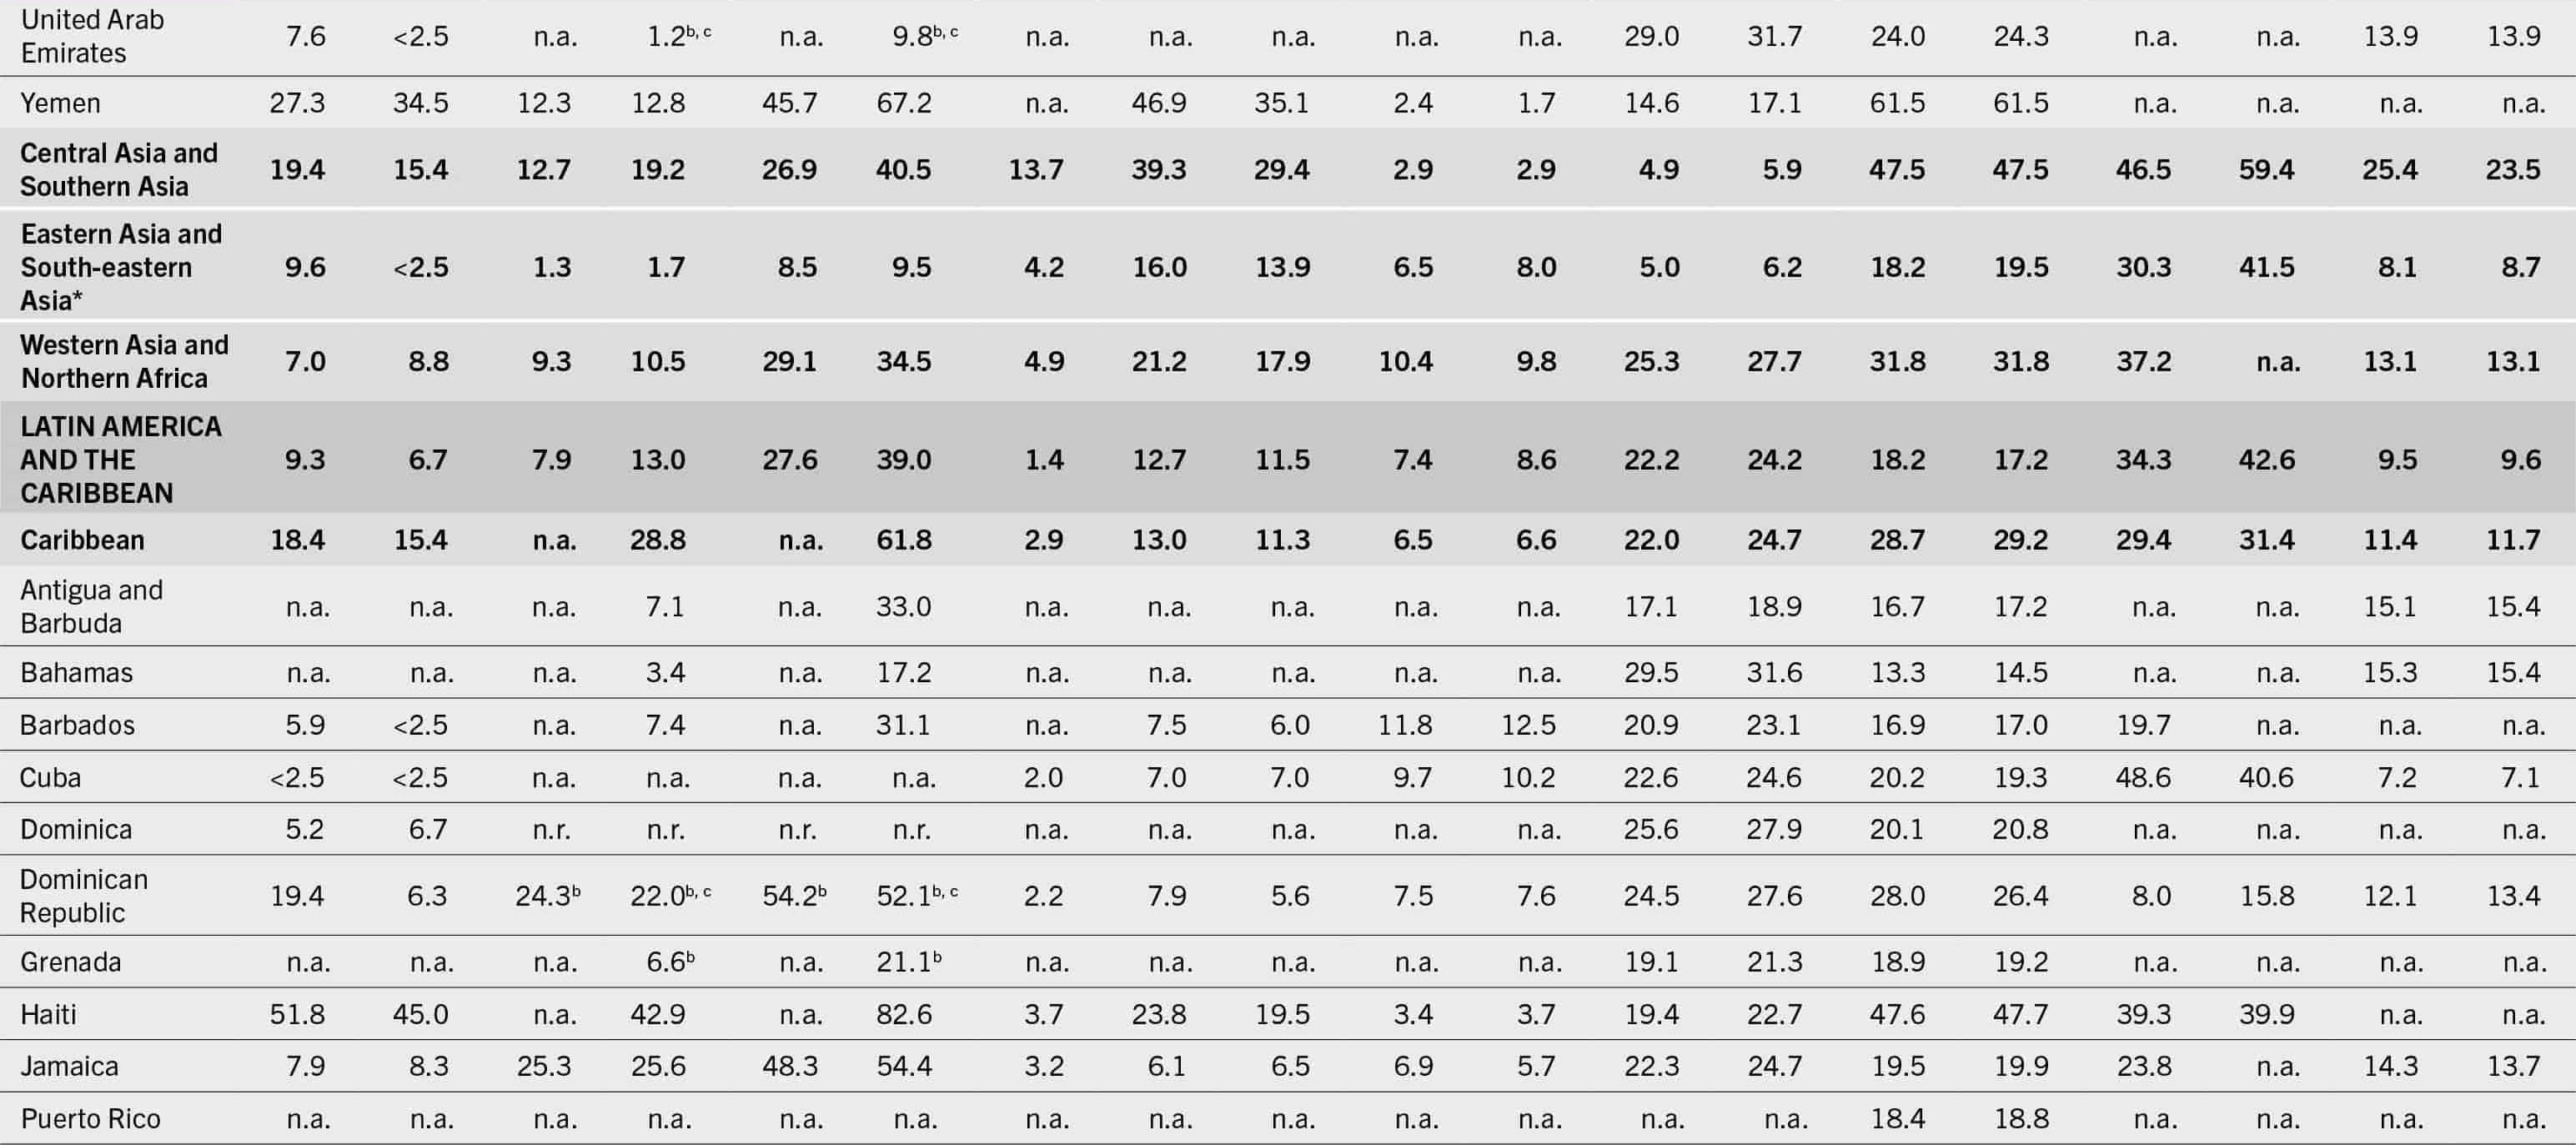
Table A1-1 (Continued6): Long Description The data is represented as regions/subregions/countries/territories: 2004-06, 2020-22 values for the prevalence of undernourishment in the total population, 2014-16, 2020-22 values for the prevalence of severe food insecurity in the total population, 2014-16, 2020-22 values for the prevalence of moderate or severe food insecurity in the total population, 2022 values for the prevalence of wasting in children (less than 5 years), 2012 and 2022 values for the prevalence of stunting in children (less than 5 years), 2012 and 2022 values for the prevalence of overweight in children (less 5 years), 2012, 2016 values for the prevalence of obesity in the adult population (greater than or equal to 18 years), 2012, 2019 values for the prevalence of anemia in women(15 to 49 years), 2012, 2021 values for the prevalence of exclusive breastfeeding among infants (0 to 5 months), and 2012, 2020 values for the prevalence of low birthweight. United Arab Emirates: 7.6, less than 2.5, not available, 1.2, not available, 9.8, not available, not available, not available, not available, not available, 29, 31.7, 24, 24.3, not available, not available, 13.9, and 13.9. Yemen: 27.3, 34.5, 12.3, 12.8, 45.7, 67.2, not available, 46.9, 35.1, 2.4, 1.7, 14.6, 17.1, 61.5, 61.5, not available, not available, not available, and not available. Central Asia and Southern Asia: 19.4, 15.4, 12.7, 19.2, 26.9, 40.5, 13.7, 39.3, 29.4, 2.9, 2.9, 4.9, 5.9, 47.5, 47.5, 46.5, 59.4, 25.4, and 23.5. Eastern Asia and South-Eastern Asia: 9.6, less than 2.5, 1.3, 1.7, 8.5, 9.5, 4.2, 16, 13.9, 6.5, 8, 5, 6.2, 18.2, 19.5, 30.3, 41.5, 8.1, and 8.7. Western Asia and Northern Africa: 7, 8.8, 9.3, 10.5, 29.1, 34.5, 4.9, 21.2, 17.9, 10.4, 9.8, 25.3, 27.7, 31.8, 31.8, 37.2, not available, 13.1, and 13.1. Latin America and the Caribbean: 9.3, 6.7, 7.9, 13, 27.6, 39, 1.4, 12.7, 11.5, 7.4, 8.6, 22.2, 24.2, 18.2, 17.2, 34.3, 42.6, 9.5, and 9.6. Caribbean: 18.4, 15.4, not available, 28.8, not available, 61.8, 2.9, 13, 11.3, 6.5, 6.6, 22, 24.7, 28.7, 29.2, 29.4, 31.4, 11.4, and 11.7. Antigua and Barbuda: not available, not available, not available, 7.1, not available, 33, not available, not available, not available, not available, not available, 17.1, 18.9, 16.7, 17.2, not available, not available, 15.1, and 15.4. Bahamas: not available, not available, not available, 3.4, not available, 17.2, not available, not available, not available, not available, not available, 29.5, 31.6, 13.3, 14.5, not available, not available, 15.3, and 15.4. Barbados: 5.9, less than 2.5, not available, 7.4, not available, 31.1, not available, 7.5, 6, 11.8, 12.5, 20.9, 23.1, 16.9, 17, 19.7, not available, not available, and not available. Cuba: less than 2.5, less than 2.5, not available, not available, not available, not available, 2, 7, 7, 9.7, 10.2, 22.6, 24.6, 20.2, 19.3, 48.6, 40.6, 7.2, and 7.1. Dominica: 5.2, 6.7, not available, not available, not available, not available, not available, not available, not available, not available, not available, 25.6, 27.9, 20.1, 20.8, not available, not available, not available, not available. Dominican Republic: 19.4, 6.3, 24.3, 22, 54.2, 52.1, 2.2, 7.9, 5.6, 7.5, 7.6, 24.5, 27.6, 28, 26.4, 8, 15.8, 12.1, and 13.4. Grenada: not available, not available, not available, 6.6, not available, 21.1, not available, not available, not available, not available, not available, 19.1, 21.3, 18.9, 19.2, not available, not available, not available, not available. Haiti: 51.8, 45, not available, 42.9, not available, 82.6, 3.7, 23.8, 19.5, 3.4, 3.7, 19.4, 22.7, 47.6, 47.7, 39.3, 39.9, not available, and not available. Jamaica: 7.9, 8.3, 25.3, 25.6, 48.3, 54.4, 3.2, 6.1, 6.5, 6.9, 5.7, 22.3, 24.7, 19.5, 19.9, 23.8, not available, 14.3, and 13.7. Puerto Rico: not available, not available, not available, not available, not available, not available, not available, not available, not available, not available, not available, not available, not available, 18.4, 18.8, not available, not available, not available, not available.
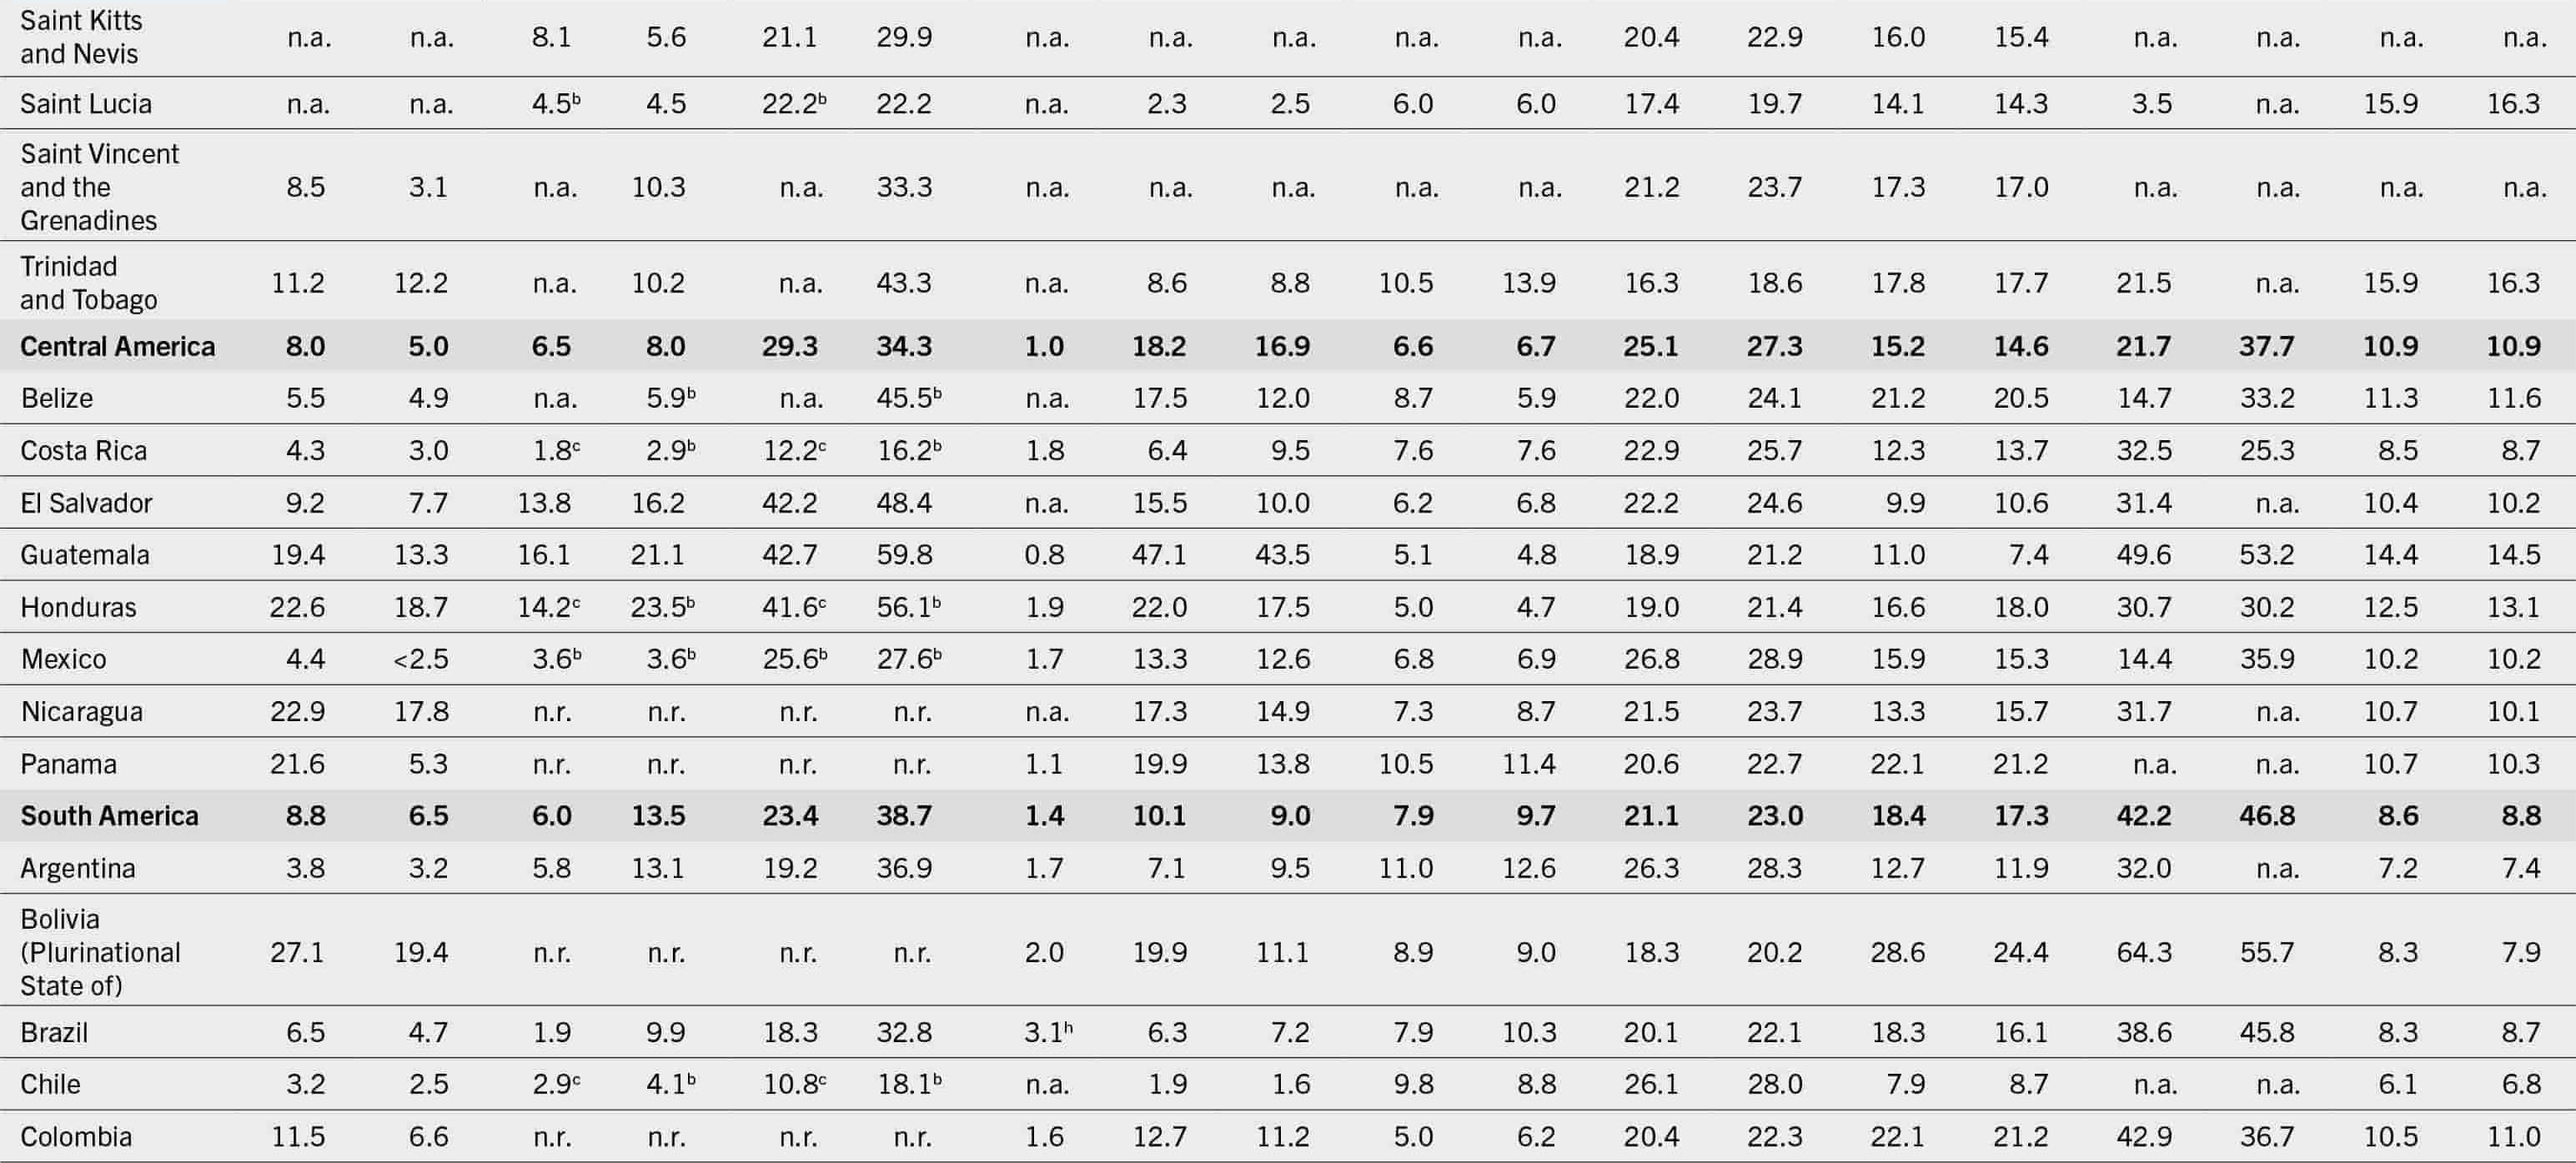
Table A1-1 (Continued7): Long Description The data is represented as regions/subregions/countries/territories: 2004-06, 2020-22 values for the prevalence of undernourishment in the total population, 2014-16, 2020-22 values for the prevalence of severe food insecurity in the total population, 2014-16, 2020-22 values for the prevalence of moderate or severe food insecurity in the total population, 2022 values for the prevalence of wasting in children (less than 5 years), 2012 and 2022 values for the prevalence of stunting in children (less than 5 years), 2012 and 2022 values for the prevalence of overweight in children (less 5 years), 2012, 2016 values for the prevalence of obesity in the adult population (greater than or equal to 18 years), 2012, 2019 values for the prevalence of anemia in women(15 to 49 years), 2012, 2021 values for the prevalence of exclusive breastfeeding among infants (0 to 5 months), and 2012, 2020 values for the prevalence of low birthweight. Saint Kitts and Nevis: not available, not available, 8.1, 5.6, 21.1, 29.9, not available, not available, not available, not available, not available, 20.4, 22.9, 16, 15.4, not available, not available, not available, and not available. Saint Lucia: not available, not available, 4.5, 4.5, 22.2, 22.2, not available, 2.3, 2.5, 6, 6, 17.4, 19.7, 14.1, 14.3, 3.5, not available, 15.9, and 16.3. Saint Vincent and the Grenadines: 8.5, 3.1, not available, 10.3, not available, 33.3, not available, not available, not available, not available, not available, 21.2, 23.7, 17.3, 17, not available, not available, not available, and not available. Trinidad and Tobago: 11.2, 12.2, not available, 10.2, not available, 43.3, not available, 8.6, 8.8, 10.5, 13.9, 16.3, 18.6, 17.8, 17.7, 21.5, not available, 15.9, and 16.3. Central America: 8, 5, 6.5, 8, 29.3, 34.3, 1, 18.2, 16.9, 6.6, 6.7, 25.1, 27.3, 15.2, 14.6, 21.7, 37.7, 10.9, and 10.9. Belize: 5.5, 4.9, not available, 5.9, not available, 45.5, not available, 17.5, 12, 8.7, 5.9, 22, 24.1, 21.2, 20.5, 14.7, 33.2, 11.3, and 11.6. Costa Rica: 4.3, 3, 1.8, 2.9, 12.2, 16.2, 1.8, 6.4, 9.5, 7.6, 7.6, 22.9, 25.7, 12.3, 13.7, 32.5, 25.3, 8.5, and 8.7. El Salvador: 9.2, 7.7, 13.8, 16.2, 42.2, 48.4, not available, 15.5, 10, 6.2, 6.8, 22.2, 24.6, 9.9, 10.6, 31.4, not available, 10.4, and 10.2. Guatemala: 19.4, 13.3, 16.1, 21.1, 42.7, 59.8, 0.8, 47.1, 43.5, 5.1, 4.8, 18.9, 21.2, 11, 7.4, 49.6, 53.2, 14.4, and 14.5. Honduras: 22.6, 18.7, 14.2, 23.5, 41.6, 56.1, 1.9, 22, 17.5, 5, 4.7, 19, 21.4, 16.6, 18, 30.7, 30.2, 12.5, and 13.1. Mexico: 4.4, less than 2.5, 3.6, 3.6, 25.6, 27.6, 1.7, 13.3, 12.6, 6.8, 6.9, 26.8, 28.9, 15.9, 15.3, 14.4, 35.9, 10.2, and 10.2. Nicaragua: 22.9, 17.8, not available, not available, not available, not available, not available, 17.3, 14.9, 7.3, 8.7, 21.5, 23.7, 13.3, 15.7, 31.7, not available, 10.7, and 10.1. Panama: 21.6, 5.3, not available, not available, not available, not available, 1.1, 19.9, 13.8, 10.5, 11.4, 20.6, 22.7, 22.1, 21.2, not available, not available, 10.7, and 10.3. South America: 8.8, 6.5, 6, 13.5, 23.4, 38.7, 1.4, 10.1, 9, 7.9, 9.7, 21.1, 23, 18.4, 17.3, 42.2, 46.8, 8.6, and 8.8. Argentina: 3.8, 3.2, 5.8, 13.1, 19.2, 36.9, 1.7, 7.1, 9.5, 11, 12.6, 26.3, 28.3, 12.7, 11.9, 32, not available, 7.2, and 7.4. Bolivia (Plurinational State of): 27.1, 19.4, not available, not available, not available, not available, 2, 19.9, 11.1, 8.9, 9, 18.3, 20.2, 28.6, 24.4, 64.3, 55.7, 8.3, and 7.9. Brazil: 6.5, 4.7, 1.9, 9.9, 18.3, 32.8, 3.1, 6.3, 7.2, 7.9, 10.3, 20.1, 22.1, 18.3, 16.1, 38.6, 45.8, 8.3, and 8.7. Chile: 3.2, 2.5, 2.9, 4.1, 10.8, 18.1, not available, 1.9, 1.6, 9.8, 8.8, 26.1, 28, 7.9, 8.7, not available, not available, 6.1, and 6.8. Colombia: 11.5, 6.6, not available, not available, not available, not available, 1.6, 12.7, 11.2, 5, 6.2, 20.4, 22.3, 22.1, 21.2, 42.9, 36.7, 10.5, and 11.
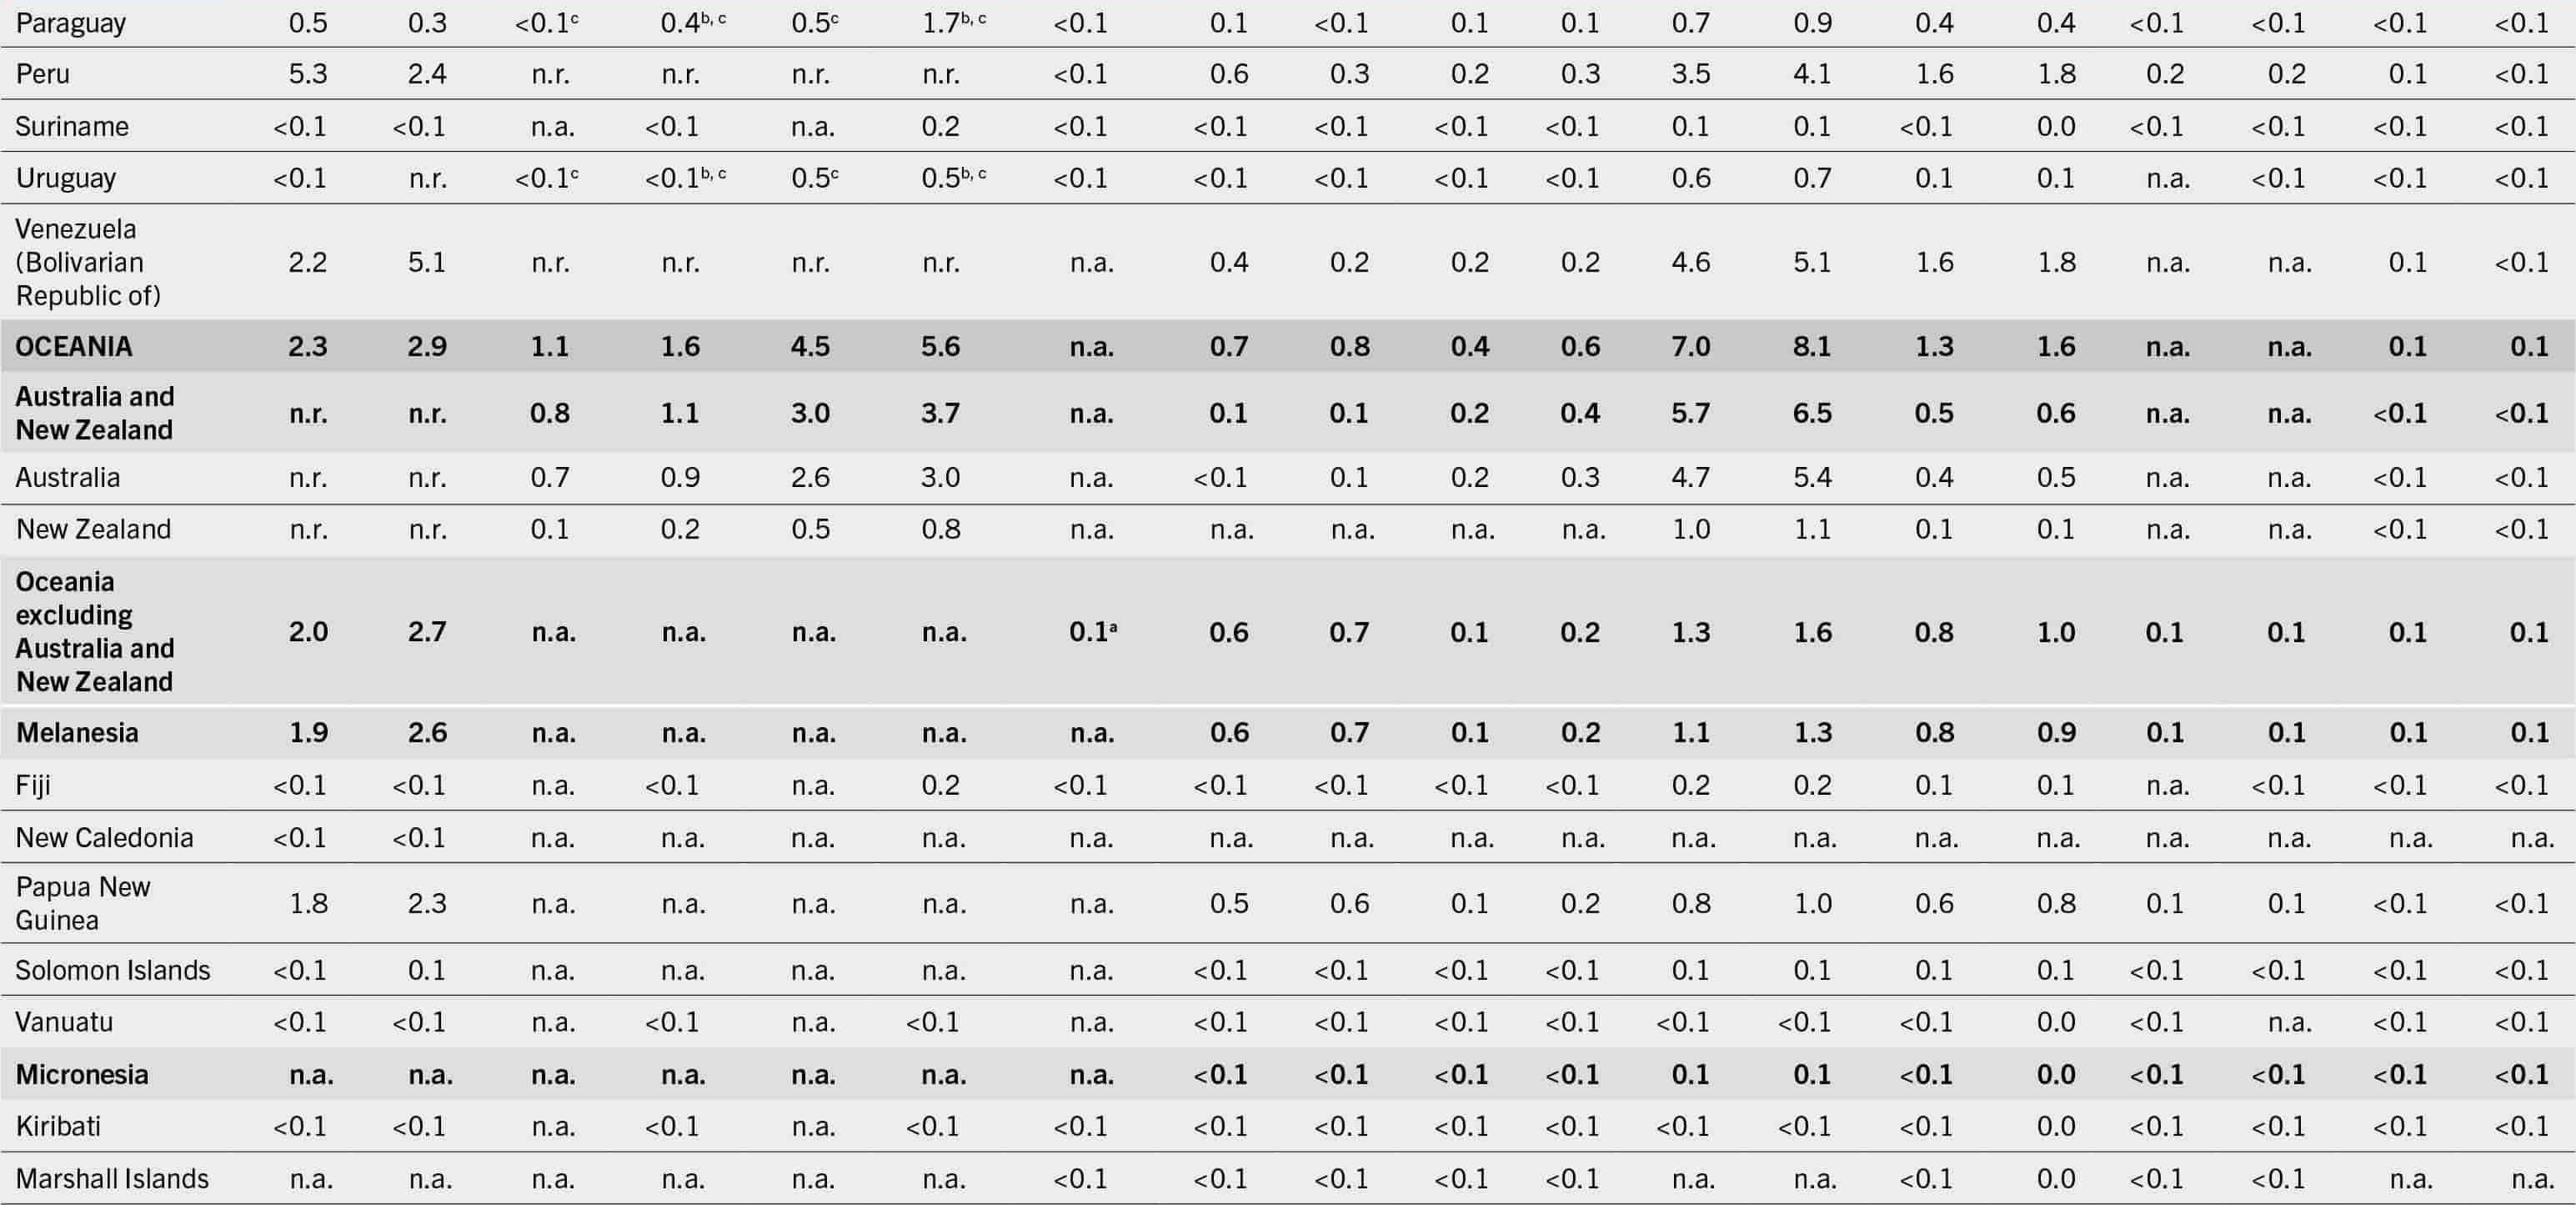
Table A1-1 (Continued8): Long Description The data is represented as regions/subregions/countries/territories: 2004-06, 2020-22 values for the prevalence of undernourishment in the total population, 2014-16, 2020-22 values for the prevalence of severe food insecurity in the total population, 2014-16, 2020-22 values for the prevalence of moderate or severe food insecurity in the total population, 2022 values for the prevalence of wasting in children (less than 5 years), 2012 and 2022 values for the prevalence of stunting in children (less than 5 years), 2012 and 2022 values for the prevalence of overweight in children (less 5 years), 2012, 2016 values for the prevalence of obesity in the adult population (greater than or equal to 18 years), 2012, 2019 values for the prevalence of anemia in women(15 to 49 years), 2012, 2021 values for the prevalence of exclusive breastfeeding among infants (0 to 5 months), and 2012, 2020 values for the prevalence of low birthweight. Ecuador: 22.3, 13.9, 6, 13, 20.7, 37.3, 3.7, 24.4, 22.7, 7.5, 11.9, 18.1, 19.9, 17.3, 17.2, not available, not available, 10.9, and 10.6. Guyana: 7.1, less than 2.5, not available, not available, not available, not available, 6.5, 14.5, 7.6, 6.2, 5.7, 17.9, 20.2, 34.4, 31.7, 31.3, not available, 17, and 17.2. Paraguay: 9.3, 4.2, 1.2, 6.1, 8.3, 25.9, 1, 9.4, 3.4, 10.4, 14.6, 18.2, 20.3, 22.2, 23, 24.4, 29.6, 10, and 10. Peru: 18.7, 7, not available, not available, not available, not available, 0.4, 18.6, 10.1, 8.1, 9.4, 18.1, 19.7, 20.6, 20.6, 67.4, 63.9, 8.3, and 7.5. Suriname: 9.8, 9, not available, 7.2, not available, 35.9, 5.5, 8.3, 7.6, 3.7, 3.8, 24.4, 26.4, 20.3, 21, 2.8, 8.9, 15.7, and 16.5. Uruguay: 2.9, less than 2.5, 1.7, 2.9, 13.3, 15.2, 1.4, 9.1, 6.1, 9.3, 11.5, 26, 27.9, 13.2, 15, not available, 57.7, 8, and 7.8. Venezuela (Bolivarian Republic of): 8.3, 17.9, not available, not available, not available, not available, not available, 12.1, 10.5, 6.2, 6.9, 24, 25.6, 20.9, 24.2, not available, not available, 9, and 9.3. Oceania: 6.8, 6.6, 2.8, 3.5, 11.1, 12.7, not available, 20, 22, 11, 16.8, 25.8, 28.1, 14.4, 16, not available, not available, 11.3, and 11.8. Australia and New Zealand: less than 2.5, less than 2.5, 2.8, 3.4, 10.6, 12, not available, 3.4, 3.4, 12.4, 19.3, 27, 29.3, 7.6, 8.8, not available, not available, 6.4, and 6.4. Australia: less than 2.5, less than 2.5, 2.8, 3.4, 10.8, 11.4, not available, 3.2, 3.4, 13.7, 21.8, 26.7, 29, 7.4, 8.5, not available, not available, 6.4, and 6.6. New Zealand: less than 2.5, less than 2.5, 2.8, 3.3, 10, 15.1, not available, not available, not available, not available, not available, 28.4, 30.8, 8.8, 10.4, not available, not available, 6, and 5.9. Oceania excluding Australia and New Zealand: 21.1, 19.8, not available, not available, not available, not available, 8.3, 40.9, 44, 9.3, 13.9, 21.3, 23.6, 32.9, 33.9, 56.6, 59.5, 17.4, and 17.9. Melanesia: 23.4, 21.1, not available, not available, not available, not available, not available, 43.3, 46.4, 9.6, 14.4, 20.1, 22.3, 33.3, 34.2, 56.8, 59.8, 17.6, and 18. Fiji: 3.5, 6.6, not available, 6.3, not available, 24.2, 4.6, 8.5, 7.1, 6.3, 7.4, 27.7, 30.2, 31.5, 32, not available, 42.9, 7.4, and 7.4. New Caledonia: 10.1, 4.8, not available, not available, not available, not available, not available, not available, not available, not available, not available, not available, not available, not available, not available, not available, not available, not available, and not available. Papua New Guinea: 28, 23.4, not available, not available, not available, not available, not available, 48, 51.2, 10.5, 16, 19, 21.3, 33.4, 34.4, 56.1, 59.7, 19, and 19.4. Solomon Islands: 12, 19, not available, not available, not available, not available, not available, 31.8, 29.8, 3.5, 5.5, 19.9, 22.5, 38.4, 37.7, 73.7, 76.2, 13.2, and 13.2. Vanuatu: 6.9, 9.5, not available, 2.4, not available, 23.3, not available, 27, 31.4, 4.8, 5.1, 22.6, 25.2, 24.1, 28.5, 39.5, not available, 12.7, and 13.1.
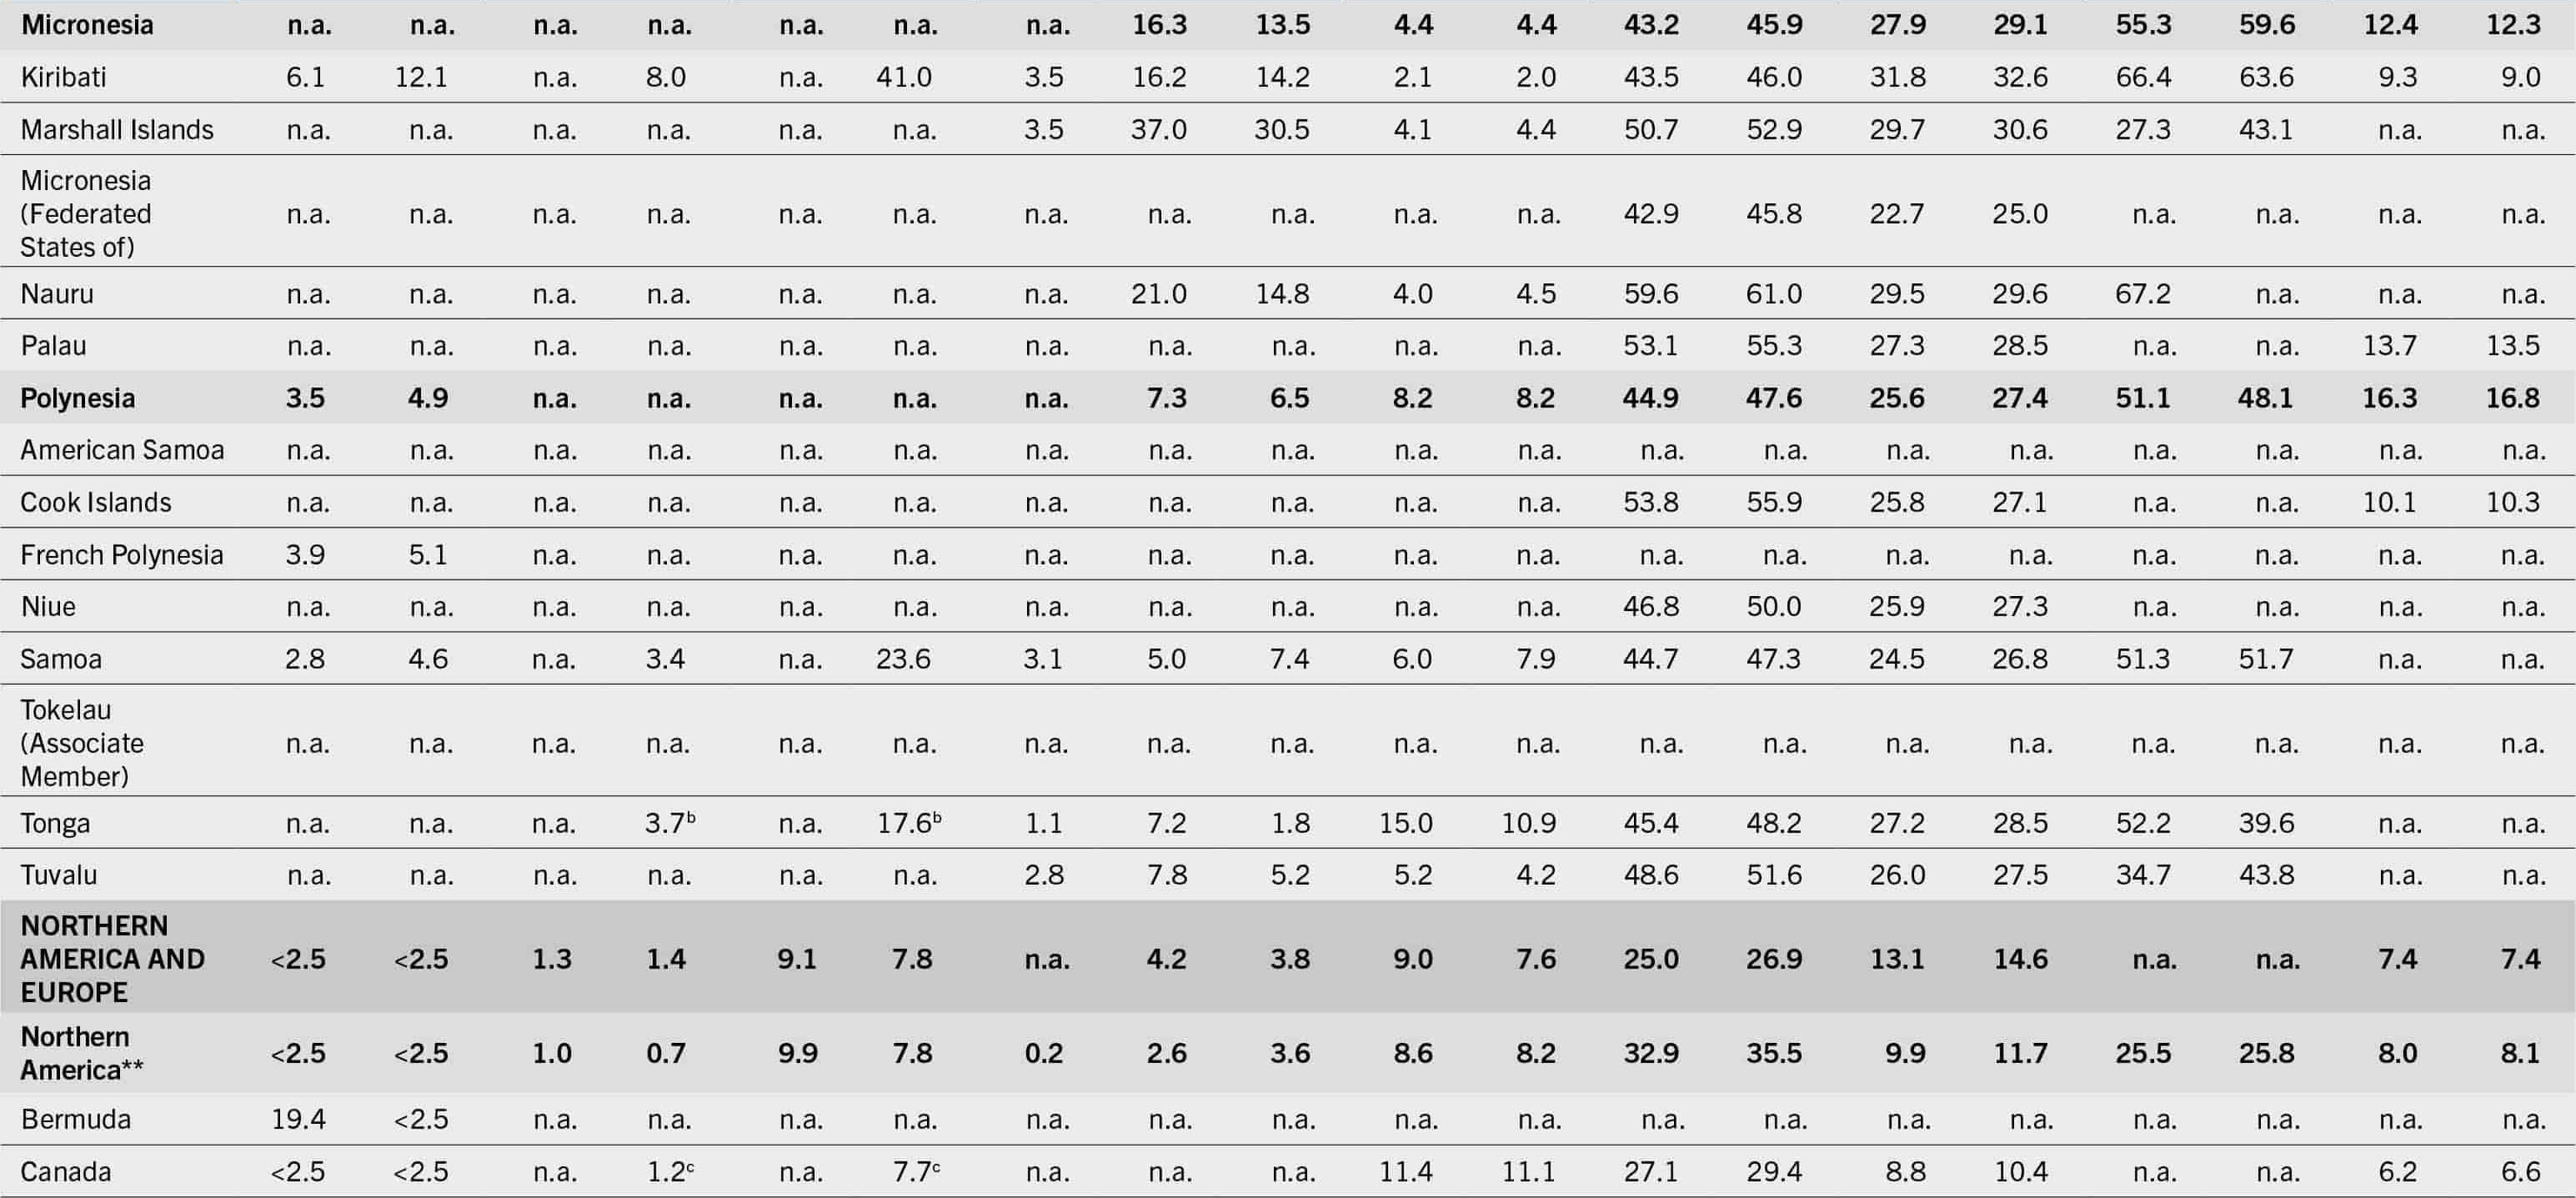
Table A1-1 (Continued9): Long Description The data is represented as regions/subregions/countries/territories: 2004-06, 2020-22 values for the prevalence of undernourishment in the total population, 2014-16, 2020-22 values for the prevalence of severe food insecurity in the total population, 2014-16, 2020-22 values for the prevalence of moderate or severe food insecurity in the total population, 2022 values for the prevalence of wasting in children (less than 5 years), 2012 and 2022 values for the prevalence of stunting in children (less than 5 years), 2012 and 2022 values for the prevalence of overweight in children (less 5 years), 2012, 2016 values for the prevalence of obesity in the adult population (greater than or equal to 18 years), 2012, 2019 values for the prevalence of anemia in women(15 to 49 years), 2012, 2021 values for the prevalence of exclusive breastfeeding among infants (0 to 5 months), and 2012, 2020 values for the prevalence of low birthweight. Micronesia: not available, not available, not available, not available, not available, not available, not available, 16.3, 13.5, 4.4, 4.4, 43.2, 45.9, 27.9, 29.1, 55.3, 59.6, 12.4, and 12.3. Kiribati: 6.1, 12.1, not available, 8, not available, 41, 3.5, 16.2, 14.2, 2.1, 2, 43.5, 46, 31.8, 32.6, 66.4, 63.6, 9.3, and 9. Marshall Islands: not available, not available, not available, not available, not available, not available, 3.5, 37, 30.5, 4.1, 4.4, 50.7, 52.9, 29.7, 30.6, 27.3, 43.1, not available, and not available. Micronesia (Federated States of): not available, not available, not available, not available, not available, not available, not available, not available, not available, not available, not available, 42.9, 45.8, 22.7, 25, not available, not available, not available, and not available. Nauru: not available, not available, not available, not available, not available, not available, not available, 21, 14.8, 4, 4.5, 59.6, 61, 29.5, 29.6, 67.2, not available, and not available. Palau: not available, not available, not available, not available, not available, not available, not available, not available, not available, not available, not available, 53.1, 55.3, 27.3, 28.5, not available, not available, 13.7, and 13.5. Polynesia: 3.5, 4.9, not available, not available, not available, not available, not available, 7.3, 6.5, 8.2, 8.2, 44.9, 47.6, 25.6, 27.4, 51.1, 48.1, 16.3, and 16.8. American Samoa: not available, not available, not available, not available, not available, not available, not available, not available, not available, not available, not available, not available, not available, not available, not available, not available, not available, not available, and not available. Cook Islands: not available, not available, not available, not available, not available, not available, not available, not available, not available, not available, not available, 53.8, 55.9, 25.8, 27.1, not available, not available, 10.1, and 10.3. French Polynesia: 3.9, 5.1, not available, not available, not available, not available, not available, not available, not available, not available, not available, not available, not available, not available, not available, not available, not available, not available, and not available. Niue: not available, not available, not available, not available, not available, not available, not available, not available, not available, not available, not available, 46.8, 50, 25.9, 27.3, not available, not available, not available, and not available. Samoa: 2.8, 4.6, not available, 3.4, not available, 23.6, 3.1, 5, 7.4, 6, 7.9, 44.7, 47.3, 24.5, 26.8, 51.3, 51.7, not available, and not available. Tokelau (Associate Member): not available, not available, not available, not available, not available, not available, not available, not available, not available, not available, not available, not available, not available, not available, not available, not available, not available, not available, and not available. Tonga: not available, not available, not available, 3.7, not available, 17.6, 1.1, 7.2, 1.8, 15, 10.9, 45.4, 48.2, 27.2, 28.5, 52.2, 39.6, not available, and not available. Tuvalu: not available, not available, not available, not available, not available, not available, 2.8, 7.8, 5.2, 5.2, 4.2, 48.6, 51.6, 26, 27.5, 34.7, 43.8, not available, and not available. Northern America and Europe: less than 2.5, less than 2.5, 1.3, 1.4, 9.1, 7.8, not available, 4.2, 3.8, 9, 7.6, 25, 26.9, 13.1, 14.6, not available, not available, 7.4, and 7.4. Northern America: less than 2.5, less than 2.5, 1, 0.7, 9.9, 7.8, 0.2, 2.6, 3.6, 8.6, 8.2, 32.9, 35.5, 9.9, 11.7, 25.5, 25.8, 8, and 8.1. Bermuda: 19.4, less than 2.5, not available, not available, not available, not available, not available, not available, not available, not available, not available, not available, not available, not available, not available, not available, not available, not available, and not available. Canada: less than 2.5, less than 2.5, not available, 1.2, not available, 7.7, not available, not available, not available, 11.4, 11.1, 27.1, 29.4, 8.8, 10.4, not available, not available, 6.2, and 6.6.
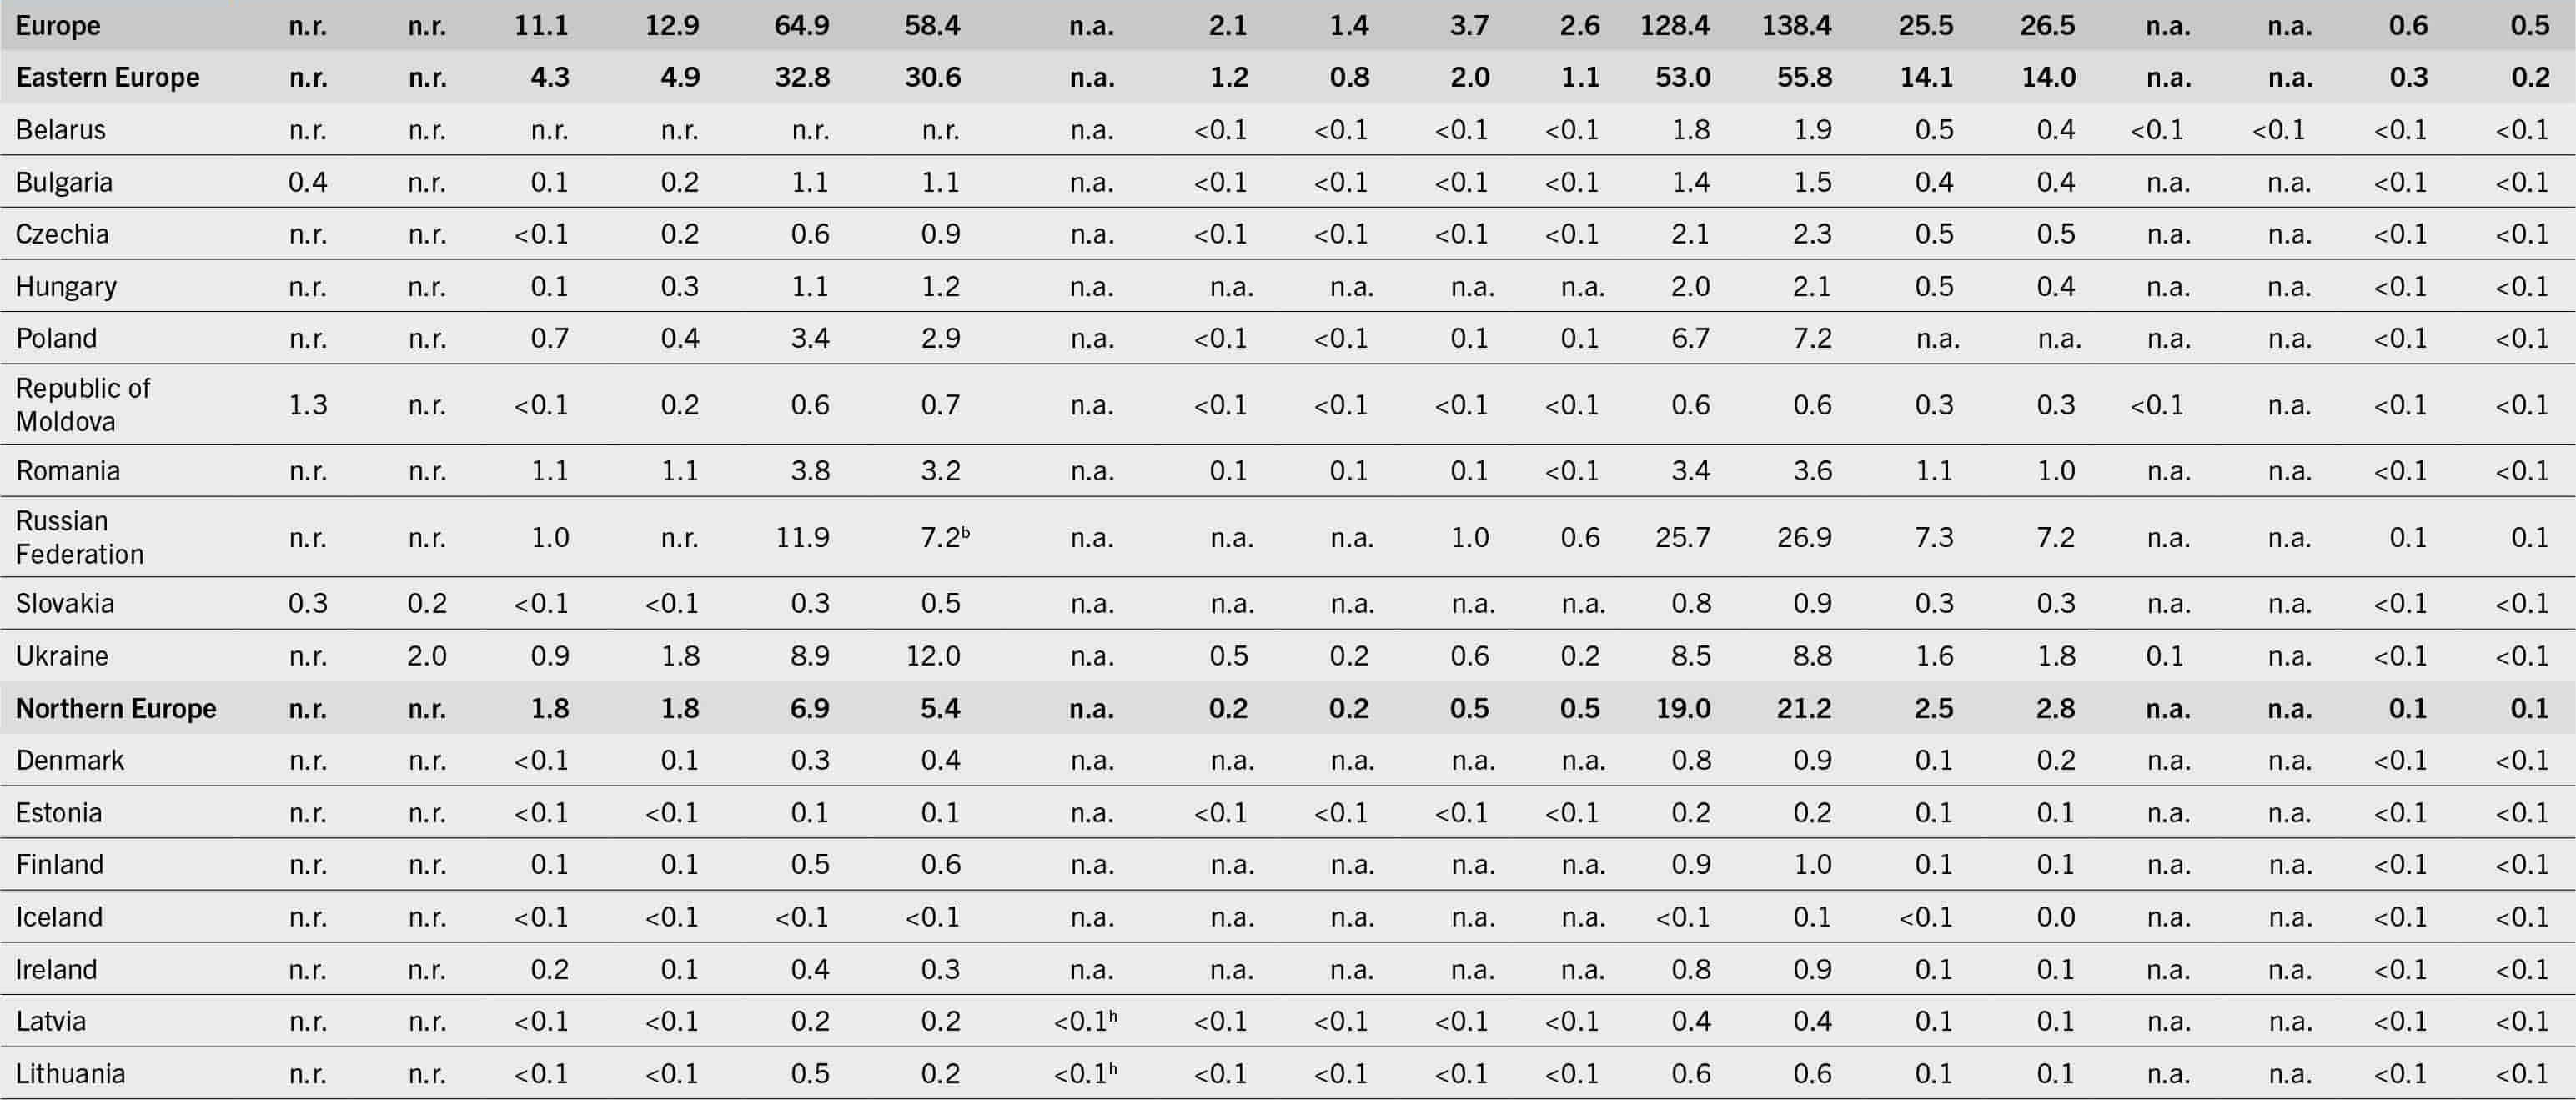
Table A1-1 (Continued10): Long Description The data is represented as regions/subregions/countries/territories: 2004-06, 2020-22 values for the prevalence of undernourishment in the total population, 2014-16, 2020-22 values for the prevalence of severe food insecurity in the total population, 2014-16, 2020-22 values for the prevalence of moderate or severe food insecurity in the total population, 2022 values for the prevalence of wasting in children (less than 5 years), 2012 and 2022 values for the prevalence of stunting in children (less than 5 years), 2012 and 2022 values for the prevalence of overweight in children (less 5 years), 2012, 2016 values for the prevalence of obesity in the adult population (greater than or equal to 18 years), 2012, 2019 values for the prevalence of anemia in women(15 to 49 years), 2012, 2021 values for the prevalence of exclusive breastfeeding among infants (0 to 5 months), and 2012, 2020 values for the prevalence of low birthweight. Greenland: not available, not available, not available, not available, not available, not available, not available, not available, not available, not available, not available, not available, not available, not available, not available, not available, not available, not available, not available. United States of America: 2.5, less than 2.5, 1.1b, 0.7, 10.5, 7.8, 0.1, 2.5, 3.6, 8.4, 7.9, 33.6, 36.2, 10, 11.8, 25.5, 25.8, 8.2, 8.3. Europe: 2.5, less than 2.5, 1.5, 1.7, 8.7, 7.8, not available, 5.1, 4, 9.2, 7.3, 21.4, 22.9, 14.5, 16, not available, not available, 7.1, 7. Eastern Europe: 2.5, less than 2.5, 1.5, 1.7, 11.2, 10.5, not available, 7.2, 5.3, 12.1, 7.4, 22, 23.4, 19.2, 20.5, not available, not available, 7.1, 7. Belarus: 2.5, less than 2.5, not available, not available, not available, not available, not available, 3.9, 3.6, 8, 5.3, 23, 24.5, 19.1, 20.6, 19, 21.7, 5, 5.1. Bulgaria: 4.8, less than 2.5, 1.9, 3.5, 14.9, 15.8, not available, 7.1, 5.6, 7, 3.8, 23.2, 25, 22.5, 23.6, not available, not available, 11, 11.4. Czechia: 2.5, less than 2.5, 0.7, 2.3, 5.8, 8.5, not available, 2.5, 2.5, 5.3, 6.1, 24.5, 26, 20, 21.1, not available, not available, 7.3, 7.6. Hungary: 2.5, less than 2.5, 1.4, 3, 11.3, 12.6, not available, not available, not available, not available, not available, 24.5, 26.4, 19.6, 19.7, not available, not available, 8.4, 8.3. Poland: 2.5, less than 2.5, 1.8, 1, 8.9, 7.5, not available, 2.1, 2.3, 5.6, 6, 21.5, 23.1, not available, not available, not available, not available, 5.8, 5.6. Republic of Moldova: 33.4, less than 2.5, 1.6, 4.8, 19.3, 23.5, not available, 6.8, 3.9, 5.4, 2.9, 17.5, 18.9, 26, 26.1, 36.4, not available, 6.5, 6.5. Romania: 2.5, less than 2.5, 5.6, 5.7, 19.3, 16.3, not available, 9.3, 7.7, 7.9, 4.5, 20.7, 22.5, 22.1, 22.7, not available, not available, 9.5, 8.8. Russian Federation: 2.5, less than 2.5, 0.7, less than 0.5b, 8.2, 5, not available, not available, not available, 12.2, 7.4, 21.9, 23.1, 20, 21.1, not available, not available, 7.3, 7.3. Slovakia: 5.5, 2.8, 1.1, 1.8, 6.2, 8.3, not available, not available, not available, not available, not available, 19.1, 20.5, 22.3, 23.5, not available, not available, 7.5, 7.8. Ukraine: 2.5, 4.8, 2, 4.3, 19.8, 28.2, not available, 18.2, 12.3, 23.6, 13.6, 22.7, 24.1, 14.4, 17.7, 19.7, not available, 6, 5.7. Northern Europe: 2.5, less than 2.5, 1.8, 1.7, 6.7, 5.1, not available, 3.7, 3, 8.7, 9.7, 23.7, 25.8, 10.6, 12, not available, not available, 6.3, 6. Denmark: 2.5, less than 2.5, 1, 1.8, 5.9, 6.8, not available, not available, not available, not available, not available, 18.1, 19.7, 11.5, 12.2, not available, not available, 5.1, 4.8. Estonia: 2.5, less than 2.5, 0.9, 0.7, 9.5, 8.5, not available, 1.3, 1.2, 4.8, 5.1, 20.1, 21.2, 20.7, 21.7, not available, not available, 4.5, 4.2. Finland: 2.5, less than 2.5, 2.4, 2.6, 9.3, 10.5, not available, not available, not available, not available, not available, 20.7, 22.2, 9.7, 10.9, not available, not available, 4.1, 4.1. Iceland: 2.5, less than 2.5, 1.7, 1.6, 6.4, 6.1, not available, not available, not available, not available, not available, 20.3, 21.9, 9.4, 10.3, not available, not available, 3.8, 4. Ireland: 2.5, less than 2.5, 3.4, 2.4, 8.9, 5.4, not available, not available, not available, not available, not available, 22.8, 25.3, 10.9, 12.1, not available, not available, 5.5, 5.6. Latvia: 2.5, less than 2.5, 0.6, 1, 9.9, 9.4, 1.6h, 2.4, 1.8, 10.3, 6.4, 22.4, 23.6, 20.9, 21.6, not available, not available, 4.5, 4.2.
Table A1-1 (Continued11): Long Description The data is represented as regions/subregions/countries/territories: 2004-06, 2020-22 values for the prevalence of undernourishment in the total population, 2014-16, 2020-22 values for the prevalence of severe food insecurity in the total population, 2014-16, 2020-22 values for the prevalence of moderate or severe food insecurity in the total population, 2022 values for the prevalence of wasting in children (less than 5 years), 2012 and 2022 values for the prevalence of stunting in children (less than 5 years), 2012 and 2022 values for the prevalence of overweight in children (less 5 years), 2012, 2016 values for the prevalence of obesity in the adult population (greater than or equal to 18 years), 2012, 2019 values for the prevalence of anemia in women(15 to 49 years), 2012, 2021 values for the prevalence of exclusive breastfeeding among infants (0 to 5 months), and 2012, 2020 values for the prevalence of low birthweight. Lithuania: less than 2.5, less than 2.5, 2.5, 2.1, 15.3, 8.5, 4.8h, 5.4, 4.5, 8, 4.7, 25, 26.3, 18.8, 19.9, not available, not available, 4.7, 4.4. Norway: less than 2.5, less than 2.5, 1.1, 1.2, 4.8, 5.2, not available, not available, not available, not available, not available, 21.3, 23.1, 10.7, 12, not available, not available, 4.7, 4.4. Sweden: less than 2.5, less than 2.5, 0.8, 1.4, 4.5, 5.4, not available, not available, not available, not available, not available, 19, 20.6, 11.7, 13.6, not available, not available, 4.2, 4.1. United Kingdom of Great Britain and Northern Ireland: less than 2.5, less than 2.5, 1.9, 1.6, 6.3, 4.1, 0.3, not available, not available, 9.7, 11.3, 25.4, 27.8, 9.4, 11.1, not available, not available, 7.1, 6.8. Southern Europe: less than 2.5, less than 2.5, 1.7, 2.3, 9.9, 8.5, not available, 4.6, 3.9, 8.7, 8.3, 20.4, 21.8, 13.5, 15.1, not available, not available, 8, 8.2. Albania: 8.9, 4.1, 10, 7.5, 38.8, 30.2, 1.6, 16.4, 8.3, 22.4, 13.4, 19.3, 21.7, 21.6, 24.8, 37.1, 36.5, 6, 6. Andorra: not available, not available, not available, not available, not available, not available, not available, not available, not available, not available, not available, 24.8, 25.6, 10.6, 12.1, not available, not available, 9.1, 9.4. Bosnia and Herzegovina: less than 2.5, less than 2.5, 1.5, 3.1, 9.6, 13.4, not available, 9.2, 8, 18.7, 9.4, 16.3, 17.9, 23.8, 24.4, 18.2, not available, 5.2, 5.2. Croatia: less than 2.5, less than 2.5, 0.6, 1.9, 6.5, 9.7, not available, not available, not available, not available, not available, 22.5, 24.4, 20.4, 21, not available, not available, 5, 5. Greece: less than 2.5, less than 2.5, 2.6, 1.5, 15.8, 6.3, not available, 2, 2.2, 15.8, 14.6, 23.2, 24.9, 12.8, 15.1, not available, not available, 10.9, 11.4. Italy: less than 2.5, less than 2.5, 1.2, 1.8, 8.6, 5.7, not available, not available, not available, not available, not available, 18.7, 19.9, 11.8, 13.6, not available, not available, 7.1, 7.2. Malta: less than 2.5, 4.6, 1.5, 1.9, 5.8, 7.2, not available, not available, not available, not available, not available, 27.5, 28.9, 12.3, 13.7, not available, not available, 7, 7.2. Montenegro: 5.4, less than 2.5, 2.1, 3.3, 12.6, 12.9, 2.2, 8.4, 8.2, 15.8, 8, 21.6, 23.3, 16.1, 17.2, 19.3, 19.5, 6.4, 6.2. North Macedonia: 4.9, 3.6, 3.6, 6.9, 15.1, 24, 3.4, 5.8, 3.7, 13.6, 9.9, 20.8, 22.4, 17.2, 19.3, 23, 27.5, 8.2, 8.3. Portugal: less than 2.5, less than 2.5, 4.1, 3.9, 14.7, 12.4, 1.1h, 3.8, 3.1, 8.2, 8.9, 19, 20.8, 12, 13.2, not available, not available, 8.4, 8.9. Serbia: less than 2.5, less than 2.5, 1.7, 4.1, 11.4, 14.8, 2.6, 5.9, 4.6, 15.6, 9.9, 20, 21.5, 21.8, 22.8, 13.4, 23.6, 6, 6.2. Slovenia: less than 2.5, less than 2.5, 0.9, 0.9, 12.3, 7, not available, not available, not available, not available, not available, 18.8, 20.2, 20.2, 21.8, not available, not available, 6.2, 6.3. Spain: less than 2.5, less than 2.5, 1.1, 1.8, 7.1, 8, not available, not available, not available, not available, not available, 22.4, 23.8, 12, 13.4, not available, not available, 9.5, 9.6.
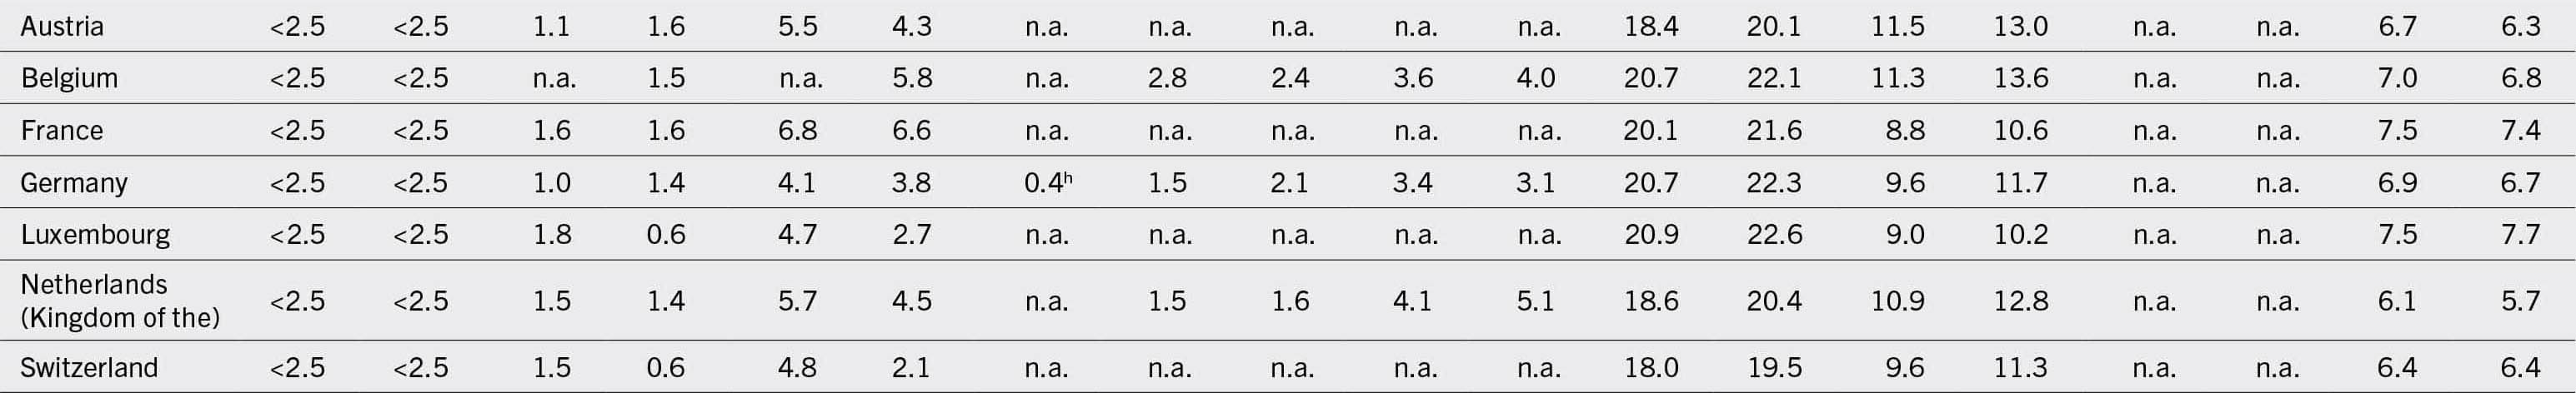
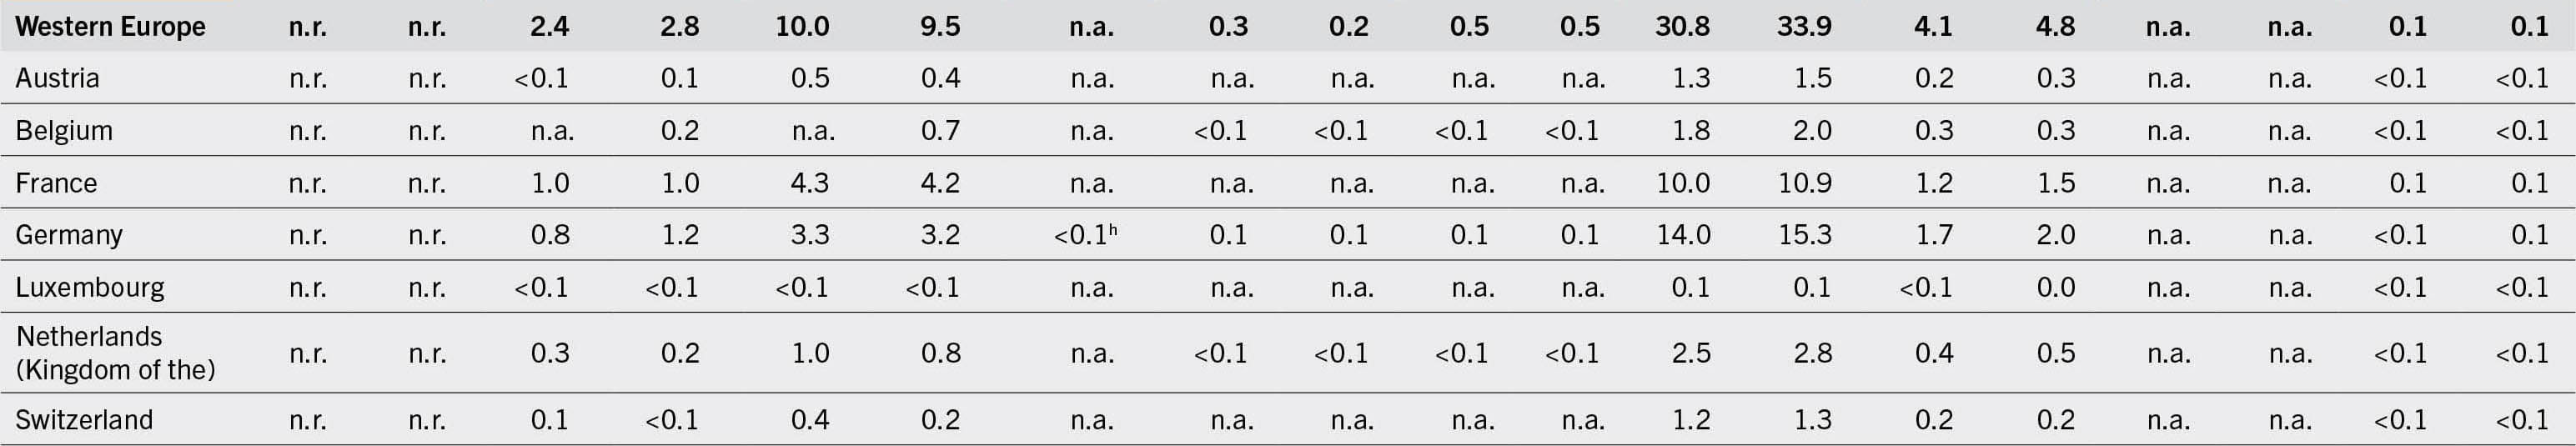
Table A1-1 (Continued12): Long Description The data is represented as regions/subregions/countries/territories: 2004-06, 2020-22 values for the prevalence of undernourishment in the total population, 2014-16, 2020-22 values for the prevalence of severe food insecurity in the total population, 2014-16, 2020-22 values for the prevalence of moderate or severe food insecurity in the total population, 2022 values for the prevalence of wasting in children (less than 5 years), 2012 and 2022 values for the prevalence of stunting in children (less than 5 years), 2012 and 2022 values for the prevalence of overweight in children (less 5 years), 2012, 2016 values for the prevalence of obesity in the adult population (greater than or equal to 18 years), 2012, 2019 values for the prevalence of anemia in women(15 to 49 years), 2012, 2021 values for the prevalence of exclusive breastfeeding among infants (0 to 5 months), and 2012, 2020 values for the prevalence of low birthweight. Western Europe: less than 2.5, less than 2.5, 1.3, 1.4, 5.2, 4.9, not available, 2.8, 2.6, 5, 5.1, 20.1, 21.7, 9.6, 11.6, not available, not available, 7, 6.8. Austria: less than 2.5, less than 2.5, 1.1, 1.6, 5.5, 4.3, not available, not available, not available, not available, not available, 18.4, 20.1, 11.5, 13, not available, not available, 6.7, 6.3. Belgium: less than 2.5, less than 2.5, not available, 1.5, not available, 5.8, not available, 2.8, 2.4, 3.6, 4, 20.7, 22.1, 11.3, 13.6, not available, not available, 7, 6.8. France: less than 2.5, less than 2.5, 1.6, 1.6, 6.8, 6.6, not available, not available, not available, not available, not available, 20.1, 21.6, 8.8, 10.6, not available, not available, 7.5, 7.4. Germany: less than 2.5, less than 2.5, 1, 1.4, 4.1, 3.8, 0.4h, 1.5, 2.1, 3.4, 3.1, 20.7, 22.3, 9.6, 11.7, not available, not available, 6.9, 6.7. Luxembourg: less than 2.5, less than 2.5, 1.8, 0.6, 4.7, 2.7, not available, not available, not available, not available, not available, 20.9, 22.6, 9, 10.2, not available, not available, 7.5, 7.7. Netherlands (Kingdom of the): less than 2.5, less than 2.5, 1.5, 1.4, 5.7, 4.5, not available, 1.5, 1.6, 4.1, 5.1, 18.6, 20.4, 10.9, 12.8, not available, not available, 6.1, 5.7. Switzerland: less than 2.5, less than 2.5, 1.5, 0.6, 4.8, 2.1, not available, not available, not available, not available, not available, 18, 19.5, 9.6, 11.3, not available, not available, 6.4, 6.4.
NOTES:
1. Regional estimates are included when more than 50 percent of population is covered. To reduce the margin of error, estimates are presented as three-year averages.
2. FAO estimates of the number of people living in households where at least one adult has been found to be food insecure.
3. Country-level results are presented only for those countries for which estimates are based on official national data (see note b) or as provisional estimates, based on FAO data collected through the Gallup
© World Poll, Geopoll or Kantar for countries whose national relevant authorities expressed no objection to their publication. Note that consent to publication does not necessarily imply validation of the estimate by the national authorities involved and that the estimate is subject to revision as soon as suitable data from official national sources are available. Global, regional and subregional aggregates are based on data collected in approximately 150 countries.
4. The estimates referring to the middle of the projected ranges for the years 2020 to 2022 were used to calculate the three-year averages.
5. For regional estimates, values correspond to the model predicted estimates for 2022. For countries, the latest data available from 2016 to 2022 are used.
6. Regional estimates are included when more than 50 percent of population is covered. For countries, the latest data available from 2005 to 2012 are used.
7. Regional estimates are included when more than 50 percent of population is covered. For countries, the latest data available from 2015 to 2021 are used.
* Wasting under five years of age regional aggregates exclude Japan.
** The Northern America wasting estimates are derived applying mixed-effect models with subregions as fixed effects; data were available only for the United States of America, preventing the estimation of standard errors (and confidence intervals). Further details on the methodology are described in De Onis, M., Blössner, M., Borghi, E., Frongillo, E.A. & Morris, R. 2004. Estimates of global prevalence of childhood underweight in 1990 and 2015.
Journal of the American Medical Association , 291(21): 2600–2606. Model selection is based on best fit.
a. Consecutive low population coverage; interpret with caution.
b. Based on official national data.
c. For years when official national data are not available, the estimates are integrated with FAO data. See
Annex 1B for further details.
d. Data informing the 2020 food insecurity estimates come from a national COVID-19 impact assessment survey with a reference period of 3 months; therefore, comparability with the rest of the series may be affected.
e. Based on official national data collected in 2019–2022 through EU statistics on income and living conditions.
f. Most recent input data are from before 2000, interpret with caution.
g. The UNICEF-WHO low birthweight estimates are derived through standard methodology applied to all countries to ensure comparability and are not the official statistics of the Government of India. India’s most recent national official low birthweight prevalence is 18.2 percent from the 2019–2021 National Family Health Survey–5 (NFHS-5), which is used as the basis of the UNICEF-WHO global estimation model to support cross-country comparability.
h. This estimate has been adjusted because the original estimate did not cover the full age range or the data source was only representative of rural areas.
<2.5 = prevalence of undernourishment less than 2.5 percent; <0.5 = prevalence of severe food insecurity less than 0.5 percent.
n.a. = data not available; n.r. = not reported.
SOURCES: Data for undernourishment and food insecurity are from FAO. 2023. FAOSTAT: Suite of Food Security Indicators. In:
FAO . [Cited 12 July 2023].
www.fao.org/faostat/en/#data/FS ; data for stunting, wasting and overweight are based on UNICEF, WHO & World Bank. 2023.
UNICEF-WHO-World Bank: Joint child malnutrition estimates - Levels and trends (2023 edition) . [Cited 27 April 2023].
https://data.unicef.org/resources/jme-report-2023 ,
www.who.int/teams/nutrition-and-food-safety/monitoring-nutritional-status-and-food-safety-and-events/joint-child-malnutrition-estimates ,
https://datatopics.worldbank.org/child-malnutrition ; data for obesity are based on WHO. 2020. Global Health Observatory (GHO) data repository. In:
WHO . [Cited 28 April 2020].
https://apps.who.int/gho/data/node.main.A900A?lang=en ; data on anaemia are based on WHO. 2021. Global anaemia estimates, Edition 2021. In:
WHO | Global Health Observatory (GHO) data repository . [Cited 20 April 2023].
www.who.int/data/gho/data/themes/topics/anaemia_in_women_and_children ; data for exclusive breastfeeding are based on UNICEF. 2022. Infant and young child feeding. In:
UNICEF . [Cited 6 April 2023].
https://data.unicef.org/topic/nutrition/infant-and-young-child-feeding ; and data for low birthweight are from UNICEF & WHO. 2023.
Low birthweight joint estimates 2023 edition . [Cited 12 July 2023].
https://data.unicef.org/topic/nutrition/low-birthweight ;
www.who.int/teams/nutrition-and-food-safety/monitoring-nutritional-status-and-food-safety-and-events/joint-low-birthweight-estimates