- ➔ Growing urbanization is a megatrend that, combined with changes in incomes, employment and lifestyles, is driving changes throughout agrifood systems across the rural–urban continuum, from food production, food processing, food distribution and procurement, to consumer behaviour.
- ➔ These changes represent both challenges and opportunities to ensure everyone has access to affordable healthy diets. Challenges include the increasing availability of cheap, energy-dense and highly processed foods and the exclusion of small farmers from formalizing value chains. But there are also opportunities for increased employment along the food value chains and improvements in the variety of nutritious foods.
- ➔ The centrality of large cities to the transformation of agrifood systems is challenged by the fact that, due to urbanization, nowadays one-fourth of the global population live in peri-urban areas of intermediate and small cities and towns, which can serve as important nodes in strengthening rural–urban linkages and the functioning of value chains.
- ➔ Moreover, with the convergence of high food purchases in both peri-urban and rural areas, where almost half of the global population live, markets in these areas are a significant driver of agrifood systems transformation.
- ➔ Urbanization is often associated with a diversification of diets, including increased consumption of dairy, fish, meat, vegetables, fruits and legumes – foods that can contribute to a healthy diet.
- ➔ But there are challenges: i) the availability of vegetables and fruits, in particular, is insufficient to meet the daily requirements of a healthy diet in almost every region of the world; and ii) urbanization contributes to the spread of convenience, pre-prepared and fast foods, often energy dense and high in fats, sugars and/or salt, which are increasingly abundant and also cheaper.
- ➔ The increased demand for high-value crops, such as fruits and vegetables and processed products, including in rural areas, has led to significant growth in longer, more formal and complex food value chains, providing greater income opportunities for off-farm employment, especially for women and youth.
- ➔ Supply-side factors, including globalized technology in food production, transportation and marketing, coupled with an increase in demand for readily available foods, have contributed to a substantial expansion of supermarkets, hypermarkets, food deliveries and other convenience retailers. However, these are also associated with increased supply and spread of energy-dense and highly processed foods.
- ➔ As urban areas and rural areas become more interlinked, rural producers often have better access to agricultural inputs and services, allowing for improved productivity, which typically increases income levels. However, there are also risks that small-scale producers in peri-urban areas may lose their lands to urban expansion.
- ➔ Overall, access to affordable healthy diets and food security are better in cities than in rural areas, although this generalization is complicated by the socioeconomic disparities in diet affordability and food security that exist within urban areas and across the rural–urban continuum.
Urbanization, combined with other contextual factors such as rising incomes, employment and changing lifestyles, is driving changes throughout agrifood systems across the rural–urban continuum, including food production, food processing, food distribution and procurement, and consumer behaviour. These changes may also lead to disparities across this continuum, with both positive and negative effects on the availability and affordability of healthy diets, and in turn, on food security and nutrition outcomes.
This chapter first examines the drivers, patterns and dynamics of urbanization, through a rural–urban continuum lens. It then presents a conceptual framework to understand the pathways through which urbanization is affecting agrifood systems across the rural–urban continuum. Last, the chapter summarizes the challenges and opportunities that urbanization and the associated agrifood systems changes can pose for access to affordable healthy diets.
3.1 Drivers, patterns and dynamics of urbanization
Drivers of urbanization
Urbanization is the result of urban population growth, urban expansion (i.e. reclassification of rural areas to peri-urban or urban) and migration from rural to urban areas, as conceptualized in Figure 16. This process is fast-changing, context specific and driven by intertwined factors, including diverse economic developments (e.g. increasing agricultural productivity), policy choices, availability of natural resources, and external stressors such as conflict, climate extremes or environmental degradation.
FIGURE 16 Drivers of urbanization

Many parts of the world have rapidly urbanized since the Second World War, with the urban share of the world’s population rising from 30 percent in 1950 to 57 percent in 2021. It is projected to reach 68 percent by 2050.1 In most regions, this has been largely driven by structural transformation, which entails an economic transformation from mainly agriculture to a more diversified national economy, in the process attracting rural people to urban areas.2
The structural transformation of economies is characterized by improvements in productivity, especially of labour, and changes in the relative importance of sectors through the reallocation of production factors such as labour and capital.3 This entails four interrelated processes: i) a declining share of agriculture in gross domestic product (GDP) and employment, and a gradual shift of jobs from the primary agriculture sector to secondary and tertiary sector jobs, typically located in urban areas; ii) rural-to-urban migration; iii) the rise of a modern industrial and service economy; and iv) a demographic transition from high to low rates of births and deaths.2, 4, 5, 6
As the relationship between agriculture and the rest of the economy changes, rural transformation occurs. The latter refers to the process of inclusive and sustainable improvements in rural livelihoods following rising productivity of (smallholder) agriculture, increasing marketable surpluses, rising off-farm employment opportunities in rural areas, better access to services and infrastructure also in rural areas, and the capacity to influence policy, embedded in national processes of economic growth and structural transformation.7 This process involves a strengthening of rural–urban linkages, which connect agriculture and other activities in the rural economy to the manufacturing and service sectors as they expand into urban centres.3 Growth in non-farm sectors and shifts in the labour force out of farming are then expected to gradually contribute to land consolidation and rising farm sizes. Improvements in agricultural productivity are a necessary condition for such a process to result in reductions in rural poverty and overall improvements in living standards.
However, the theory that urbanization goes hand in hand with economic growth and structural transformation does not hold for all countries and regions. Although countries with a high share of urban population are often more prosperous than countries with a large rural population, this is not true in all cases.8 Figure 17 shows that although a trend can be seen between GDP per capita at purchasing power parity (PPP) and level of urbanization (measured by the share of the urban population), there is no one-to-one association. For example, in 2019, 91 percent of Jordan’s population was urban, but this country’s GDP per capita was relatively low at almost 10 000 PPP dollars per year. Likewise, in Gabon, 90 percent of the population was living in cities in 2019, but the country’s GDP per capita was around 15 000 PPP dollars per year. Small island countries and territories (Antigua and Barbuda, Saint Kitts and Nevis, and Aruba), as well as small landlocked countries, have lower levels of urbanization than expected considering their relatively high GDP per capita.
FIGURE 17 Gross domestic product per CAPITA and level of urbanization
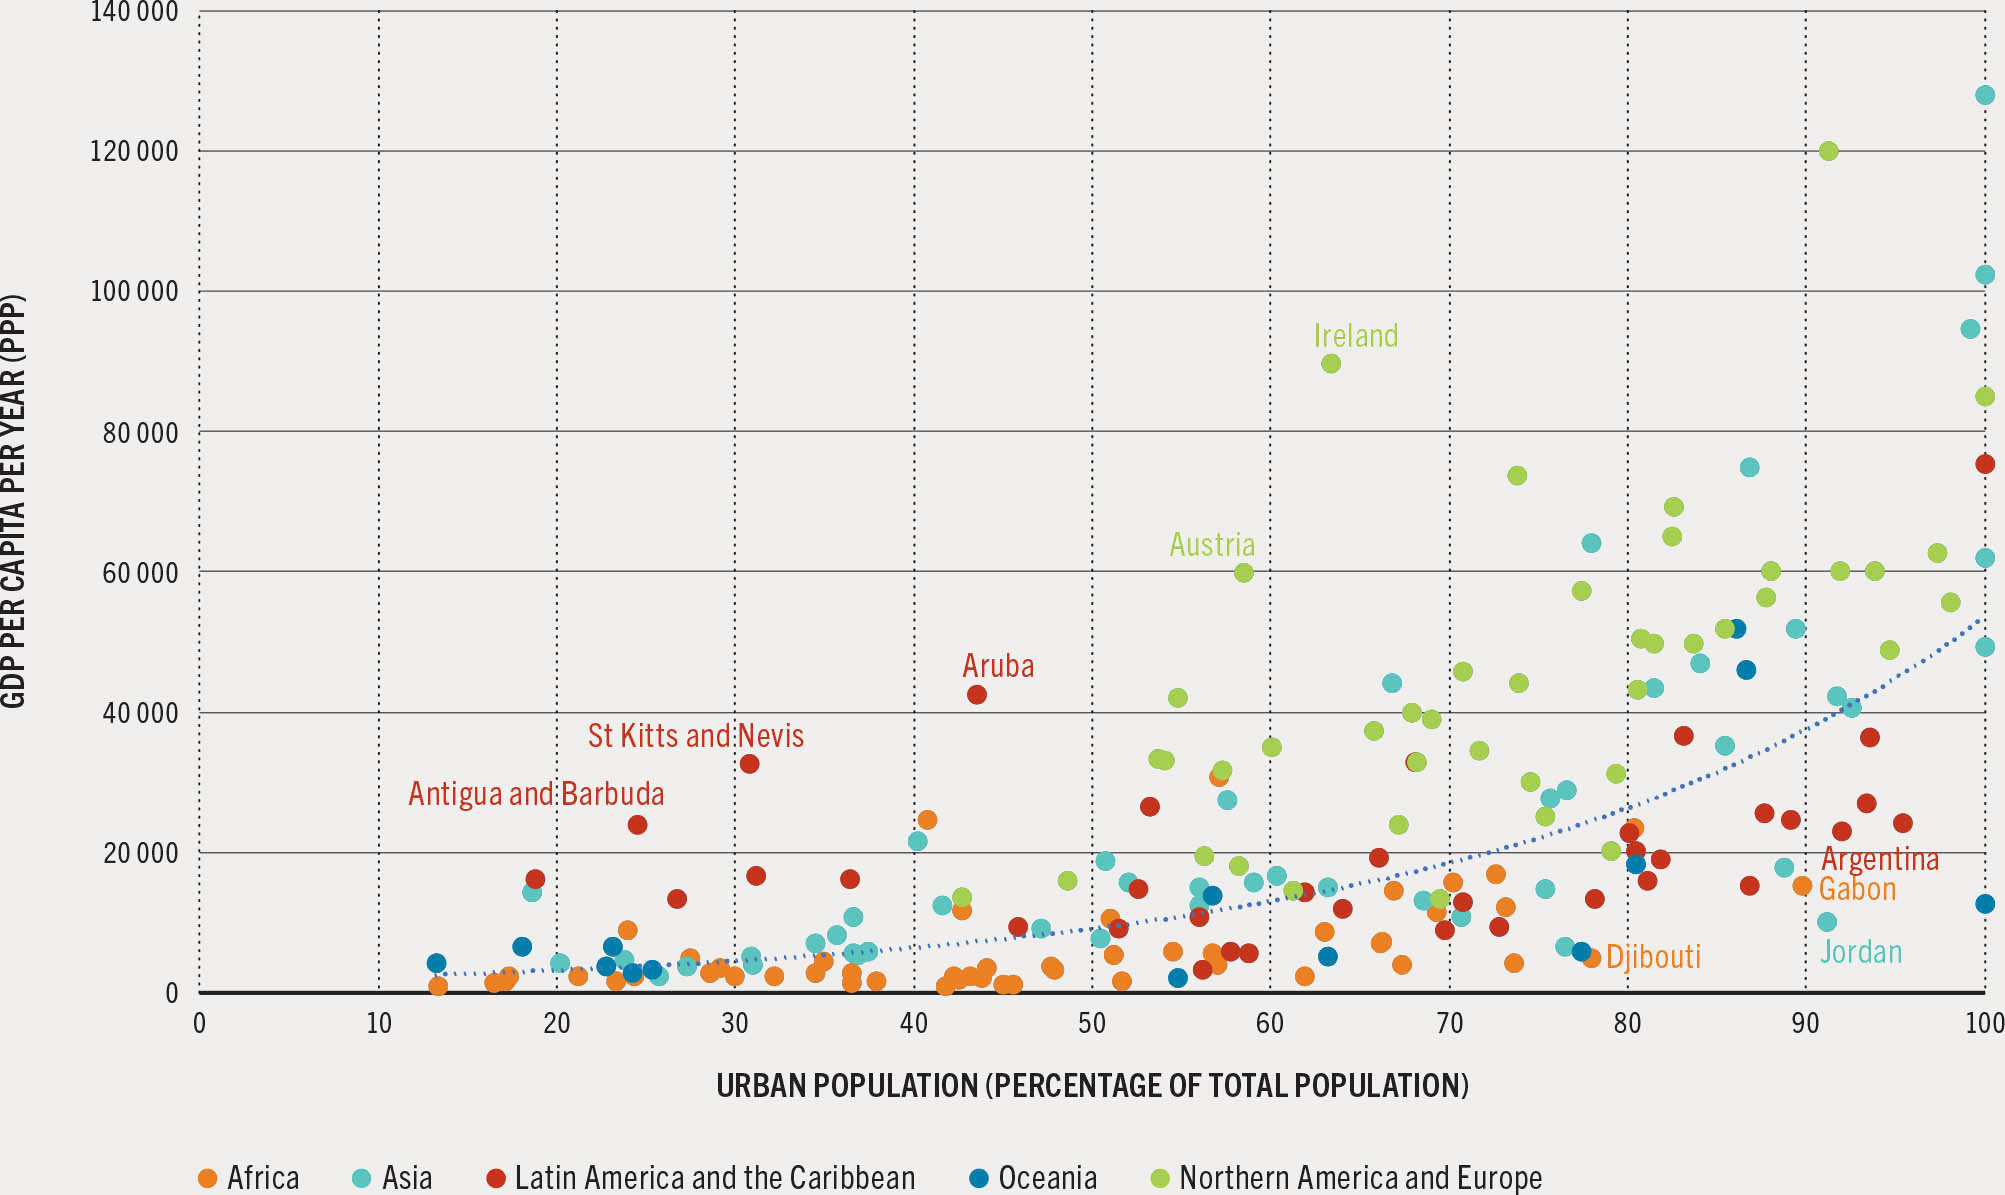
SOURCE: World Bank. 2023. DataBank. In: World Bank. [Cited 23 May 2023]. https://databank.worldbank.org
Urbanization without structural transformation and economic growth occurred in some of the poorest countries in the late twentieth century.9 As in the cases above, the increase in share of population in cities does not necessarily indicate high economic growth. Rather urbanization is associated with other “atypical” developments. First, overall population growth leads to growth in both urban and rural areas. Without increases in agricultural productivity, rural population growth results in land subdivision, unviable farming plots and a lack of livelihood opportunities in rural areas. Rural inhabitants then migrate to cities where opportunities may be limited (because of the lack of economic growth), resulting in increases in urban poverty. Second, urban population growth stretches the capacity of urban infrastructure and social and other services to the limit. This is particularly the case for rapidly growing urban areas, where investments have not kept pace with urban expansion.
Urbanization without economic growth can be linked to poor rural living conditions – including poverty, lack of employment or underemployment, lack of infrastructure, lack of access to services and food insecurity – and/or environmental degradation.10, 11, 12 Southern Asia and sub-Saharan Africa are two regions where structural transformation is lagging behind, as a result of the low productivity of subsistence agriculture and, above all, the rapid rates of population growth and urbanization.3 In sub-Saharan Africa, there is less poverty reduction alongside urbanization than is historically observed in other regions.13 Through the late 1990s, sub-Saharan Africa had the highest rate of urbanization in the world; however, this took place in the midst of lagging performances in agriculture and the broader economy.k In the late 1990s, per capita income growth in this subregion began to increase significantly, outpacing many countries around the world; still however, aspects of the economic transformation show significant divergences from urbanization driven by structural transformation elsewhere.15 For example, rural populations continue to grow as most African countries are urbanizing and farm labour is not necessarily moving to off-farm sectors of the economy.15 Moreover, urban-based households, many of whom are medium-scale investor farmers, control a sizeable share of national agricultural land and continue to invest there.
Another factor that may contribute to urbanization is climate change and environmental degradation, which can affect rural-to-urban migration movements.16, 17 Generally, in low-income rural regions, the lower the per capita income, the larger the share of the labour force employed in agriculture, forestry and fisheries.18 This means that more people in these regions depend on natural resources for their livelihoods, and are therefore more vulnerable to climate change and environmental degradation.19 If the agriculture, forestry, fisheries and land-use sectors are weakened from the effects of climate change and biodiversity loss, these populations may be compelled to migrate to urban areas in search of work.20 With the growing magnitude of climate change impacts, future rural-to-urban migration may be increasingly affected.
However, migration may be neither possible nor desirable for all affected populations. Some of the poorest and most vulnerable groups (including women, children and the elderly) can become trapped in rural areas, their mobility constrained by insufficient resources or social norms. Evidence also indicates that others may choose to remain in high-risk areas due to a strong attachment to their ancestral land and livelihoods.21 While migration to cities presents risks and opportunities, those who remain in rural areas, whether willingly or unwillingly, are disproportionately vulnerable to climate change impacts, which will have adverse implications for their future livelihoods and food security.
Where there are recurrent climate shocks, patterns of movement can become cyclical, pre-emptive and permanent because of perceived future risk. For example, evidence from Bangladesh suggests that around 22 percent of rural households affected by tidal-surge floods, and 16 percent of those affected by riverbank erosion, have migrated to urban areas.22 Evidence from sub-Saharan Africa shows that, between 1960 and 2000, nearly 50 percent of net migrationl (estimated at 5 million people) was due to changes in temperature and rainfall, which affected agricultural production and brought about a reduction in farm incomes and rural wages, thus spurring rural-to-urban movements.23
Sending one or more family members into cities to work in sectors other than agriculture, especially for poor rural households, is often important in order to reduce the risks of hunger and extreme poverty, and to cope with possible adverse shocks the household might face. For example, evidence from the Sidama District in southern Ethiopia shows that households whose members were anxious about a decrease in quality and quantity of food were more likely to decide that an adult should migrate in search of employment to support better lives for themselves and the family.24 Additional evidence from the same country confirmed these results: for households without a migrant member, the inability to feed the family compared to neighbouring households with migrant members increased by four times the propensity to send out a migrant for work.25
There is also an increasing occurrence of forced displacement from rural areas to urban areas, often as a result of disasters and/or conflict. Displaced populations are increasingly concentrating in cities, with 61 percent of the 26 million refugees,26 and two out of three internally displaced persons, residing in urban areas in 2019.27
Patterns and dynamics of urbanization
With urban expansion and improving road and communication infrastructure across ever larger parts of rural areas, the distinction between rural and urban areas is increasingly blurred. A large share of the new urban dwellers are expected to live in peri-urban areas, as well as in small cities and interconnected towns. Increasingly, rural and urban areas are less separate spaces in their own right, but rather two ends of a spectrum, connected via numerous linkages across a rural–urban continuum (Box 2), which are important for agrifood systems.
BOX 2Untangling the rural–urban continuum
Global populations are regularly categorized as living either in urban centres or in rural areas. This distinction is often attributed to data limitations but also to the practicality of the categorization, for example in national ministries which are usually divided by rural and urban mandates.28, 29 This approach also tends to focus on the rural–urban divide, with the conclusion that rural areas typically lag behind their urban counterparts.30, 31 However, this divide is challenged both in science and in policy, due to the increasing interconnectedness between various types of population agglomerations.
There is no commonly agreed upon definition of the term “urban” across countries, and thus comparability of “urban areas” across countries and regions is not always straightforward.32 This limitation carries over directly to globally reported urban population statistics by the United Nations Department of Economic and Social Affairs, which classifies areas as urban according to the criteria used by each country or territory.33 Criteria may be based on political/administrative aspects, structural and/or functional characteristics related to population density and size or the functions that cities have for their inhabitants.34
Recently, important advances were made in developing a methodology for delineating urban and rural areas for international and regional statistical comparisons.35 The UN Statistical Commission endorsed the Degree of Urbanization (DEGURBA) in March 2020 – a methodology developed by a consortium of the European Union and international agencies (Organization for Economic Co-operation and Development [OECD], World Bank, FAO, United Nations Human Settlements Programme [UN-Habitat] and International Labour Organization [ILO]). This methodology classifies the entire territory of a country across a rural–urban continuum,36 by degree of urbanization. The classification system consists of three classes – cities, towns and semi-dense areas, and rural areas – and seven subclasses for the rural and semi-dense areas, based on population size and density, using the same thresholds across the globe, and thus ensuring global comparability.37 The outcome is an open-access geospatial dataset. This official classification system is used for the first time in Chapter 2, to look at differences in SDG Indicator 2.1.2 (prevalence of moderate or severe food insecurity in the population based on the Food Insecurity Experience Scale [FIES]) among rural, peri-urban and urban populations around the world.
To explore how urbanization shapes agrifood systems, a more granular lens of the rural–urban continuum is useful. For this reason another publically available global geospatial dataset – Urban Rural Catchment Areas (URCA) – is used for the country case study analysis in Chapter 4. This newly available global geospatial dataset provides a global mapping of the rural–urban continuum,28, 38 based on the Global Human Settlement Layer.39 Like the DEGURBA classification, it places urban centres on a gradient based on population size and density, whereby city size is a proxy for the breadth of services and opportunities provided by an urban centre. But it also adds a second dimension: rural locations are assigned a gradient of their own, using the shortest travel time to urban centres of various sizes as a proxy for the cost of accessing goods, services and employment opportunities (Figure A). Thus, the URCA dataset disaggregates rural areas into multiple categories; distinguishing, for example, between locations that are less than 1 hour from an urban centre (in yellow) and those that are farther away.
Figure A Rural–urban continuum based on the Urban Rural Catchment Areas (URCA) dataset
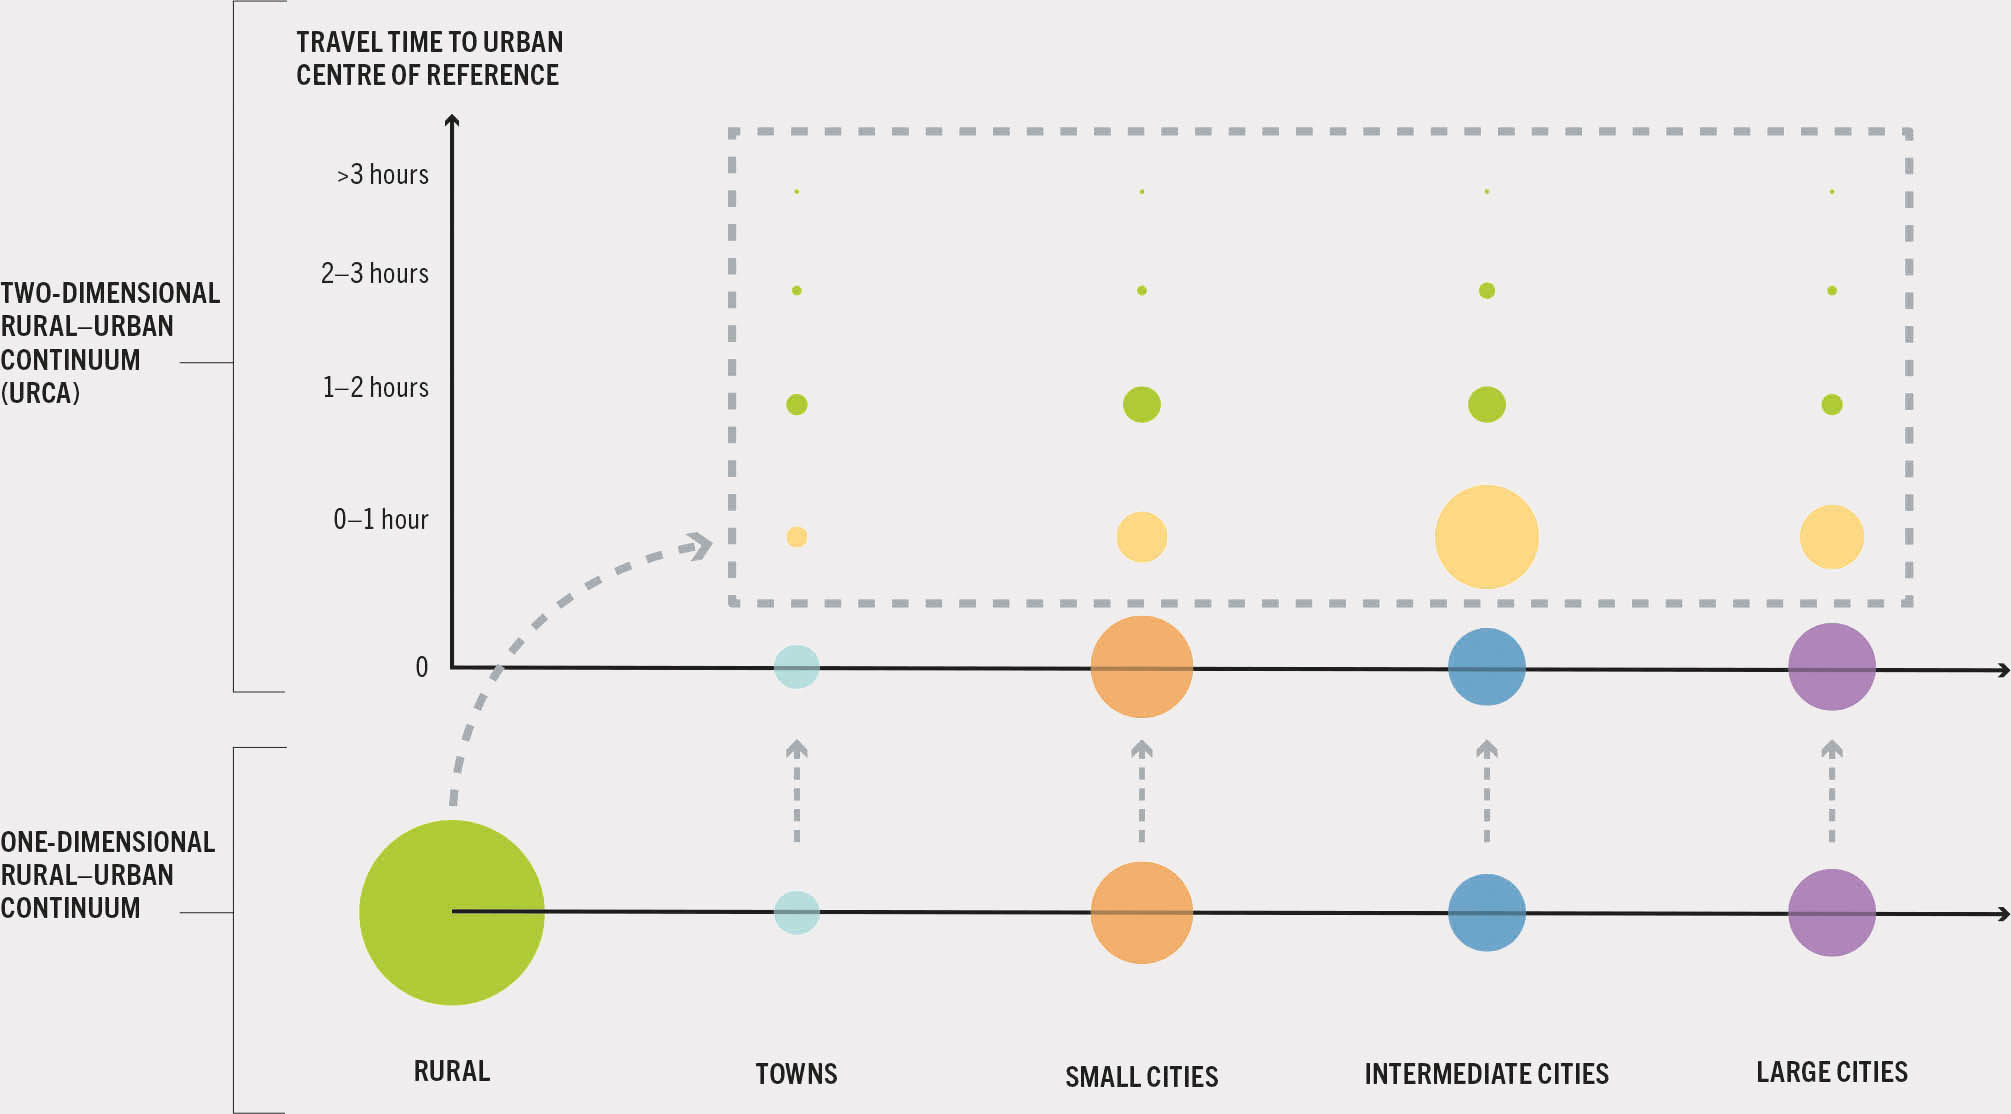
SOURCE: Adapted from FAO. 2021. Global Urban Rural Catchment Areas (URCA) Grid – 2021. In: FAO. [Cited 12 June 2023]. https://data.apps.fao.org/?share=g-3c88219e20d55c7ce70c8b3b0459001a
The URCA methodology for defining urban–rural catchment areas provides a spatial and functional representation of the connection between rural areas and urban centres, giving new insights into the degree of connectivity between rural and urban areas and the diversity of patterns in rural–urban linkages around the world. Spatial representation refers to the geographical and locational distribution of the population (i.e. what area it occurs in and how spread out it is). Functional representation entails how these areas relate to each other in terms of activities and purpose (i.e. access of rural locations to urban services and opportunities, captured by the size of the closest urban centre and the associated travel time from the rural location). This categorization, when combined with household survey data, allows for a more detailed analysis regarding consumption and production across the rural–urban continuum (see Chapter 4).
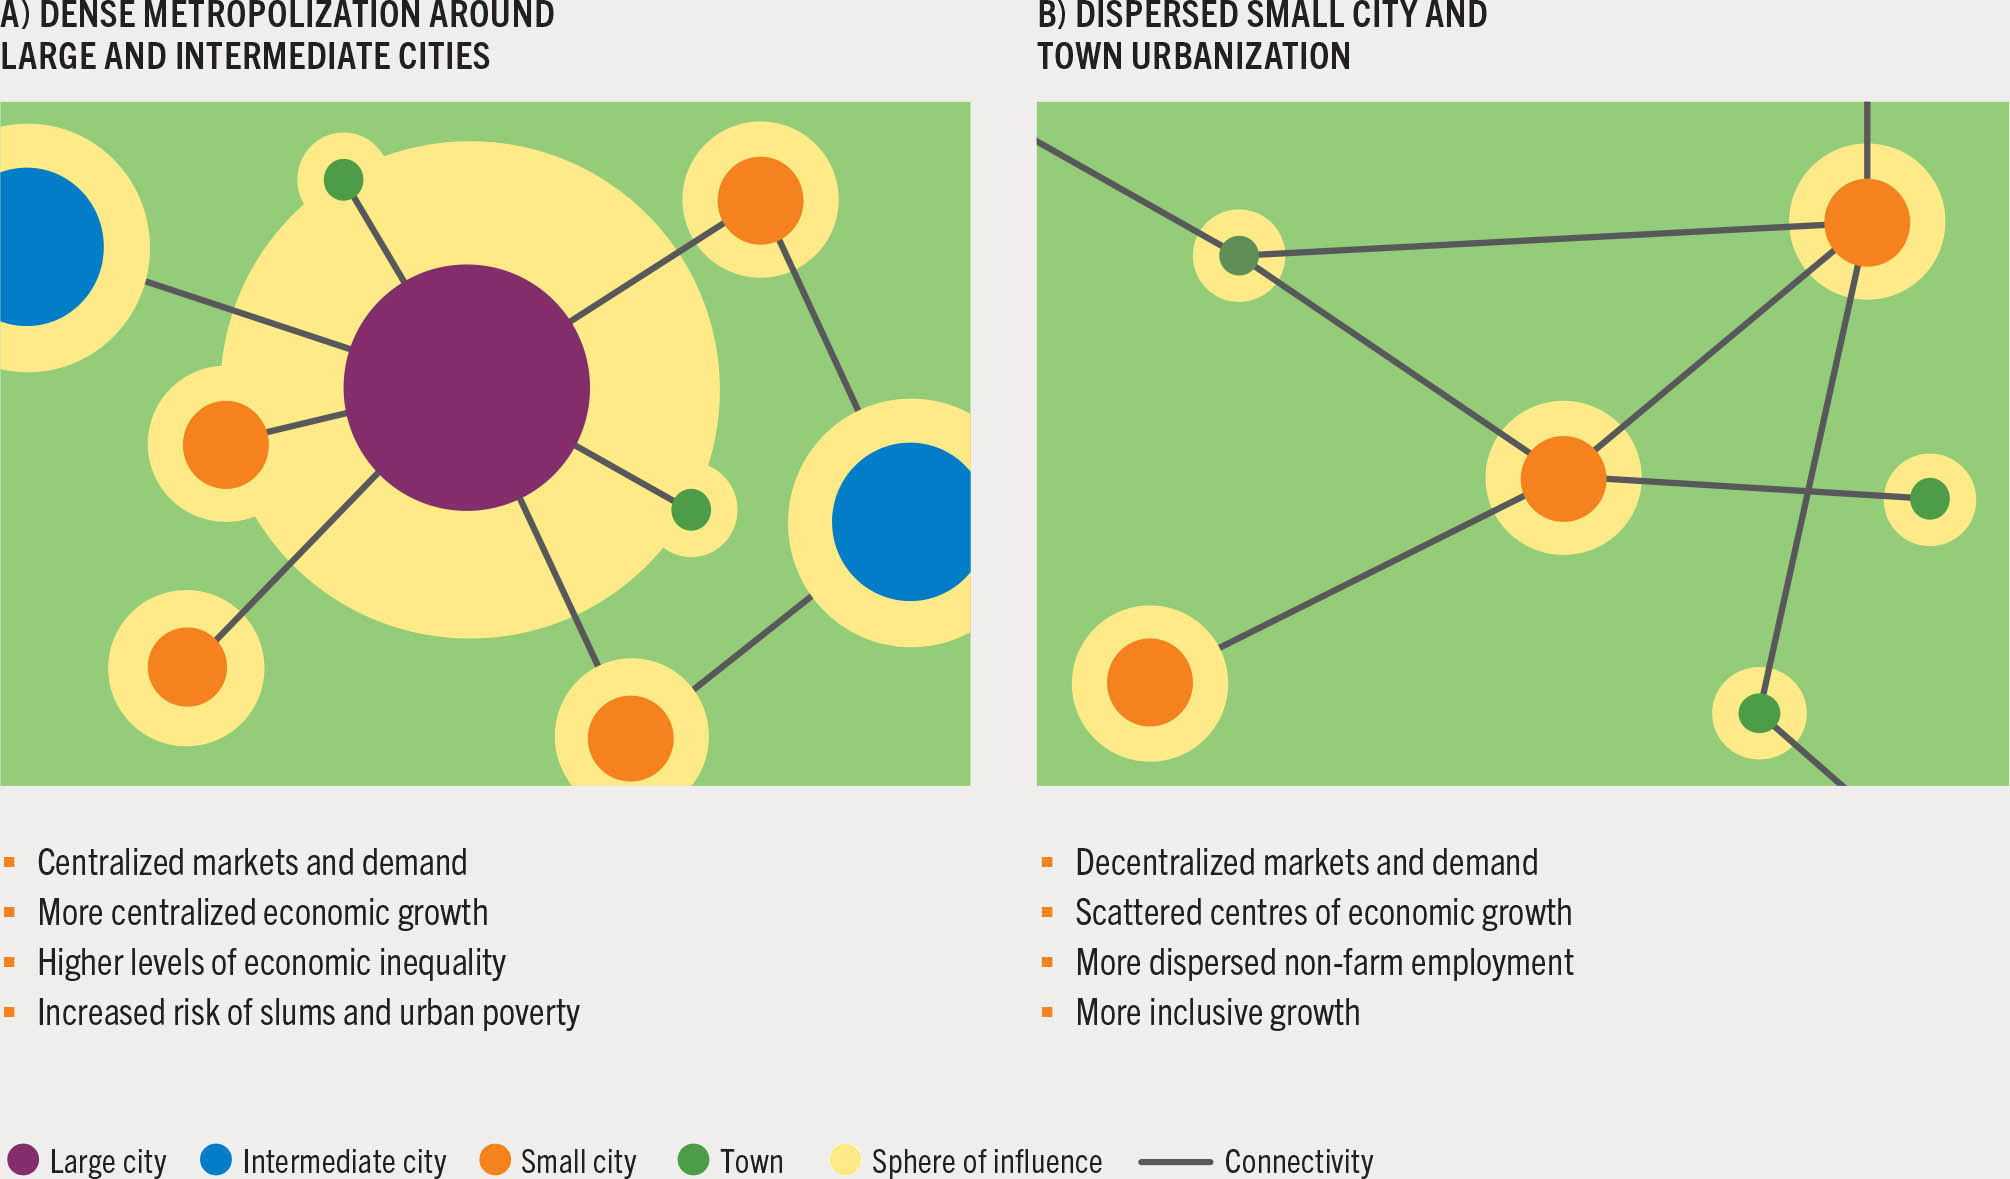
Figure 18 conceptualizes two divergent patterns of urbanization and their major impacts (see Box 3 for definitions of city sizes), which ultimately determine the availability and affordability of healthy diets.3 The degree of connectivity between rural and urban areas shapes agrifood systems, and thus the availability of affordable healthy diets, and the livelihoods of urban and rural primary producers, processors and traders.3
FIGURE 18 Patterns of urbanization
BOX 3Definitions of urban, peri-urban and rural areas in urban–rural catchment areas (URCAs)
The definition of city size and type differs widely among countries. Numerous designations are given indicating size and function, such as primary, secondary or tertiary cities, indicating the role of a city within a national context.
There is also no standard definition of peri-urban, and the term is applied to a diverse mix of informal and formal settlements around urban areas.41, 42 In general, however, peri-urban refers to the geographical edge of a city – the “urban fringe” outside the formal city limits. It is often described as the landscape interface or transition zone between urban and rural areas.
For the purposes of the discussion and analysis in Chapters 3, 4 and 5 of this report, the terminology utilizes URCA definitions to define urban, peri-urban and rural areas.
Based on combined URCA urban area subcategories, urban areas are defined according to the following population sizes:
- Large cities: >1 million people.
- Intermediate cities: 0.25–1 million people.
- Small cities: 50–250 thousand people.
- Towns: 20–50 thousand people.
Furthermore, based on URCA subcategories, peri-urban and rural areas are defined as follows:
- Peri-urban areas consist of three URCA subcategories: <1 hour to a large city; <1 hour to an intermediate city; <1 hour to a small city.
- Rural areas also consist of three URCA subcategories: <1 hour to a town; 1–2 hours to a city or town; >2 hours to a city or town.
See Annex 4 for further details on the URCA methodology.
Rural agricultural livelihoods often depend on their connection to peri-urban and urban food spaces, while cities depend on surrounding peri-urban and rural areas for food and ecosystem services. For example, in many parts of Africa, agriculture often flourishes in close proximity to urban centres through more intensive production of high-value crops such as fruits and vegetables, which are highly perishable. In this case, farmers can take advantage of this proximity to markets for both inputs and post-harvest products and services.3, 40
Whether urban growth takes place in large or intermediate and small cities or towns will affect rural populations’ access to services, markets and inputs (Figure 18). This is because intermediate and small cities, also referred to as “secondary cities”,m play a pivotal role in providing input and output market opportunities for rural populations not residing close to the large cities. Infrastructure and facilities in intermediate and small cities are important for connecting different urban centres with each other and with rural areas, thereby facilitating access to more dispersed patterns of pre-harvest and post-harvest facilities such as collection hubs, (cold) storage facilities, and distribution and processing centres.45, 46
Several studies find that the growth of intermediate and small cities may matter even more than the growth of large cities in reducing poverty nationally.47, 48, 49 Population growth in large cities seems to have little effect on poverty reduction, and even increases poverty in some cases, while decreasing levels of urban food security.50 For these reasons, several local, national and international policies have explicitly promoted the growth of such intermediate and small cities.51
As rural and urban areas represent two ends of a spectrum, a rural–urban continuum framework is therefore critical to understand the links between urbanization and agrifood systems changes and how these changes are affecting the availability and affordability of healthy diets, and in turn, food security and nutrition. With this in mind, the global Urban Rural Catchment Areas (URCA) dataset suggests that the breadth of services and opportunities available, as well as their accessibility to rural locations, are often a function of the size of nearby urban centres and the associated travel time from rural locations (see Box 2 and Annex 4 for a full description of the data and the definition of URCA categories).
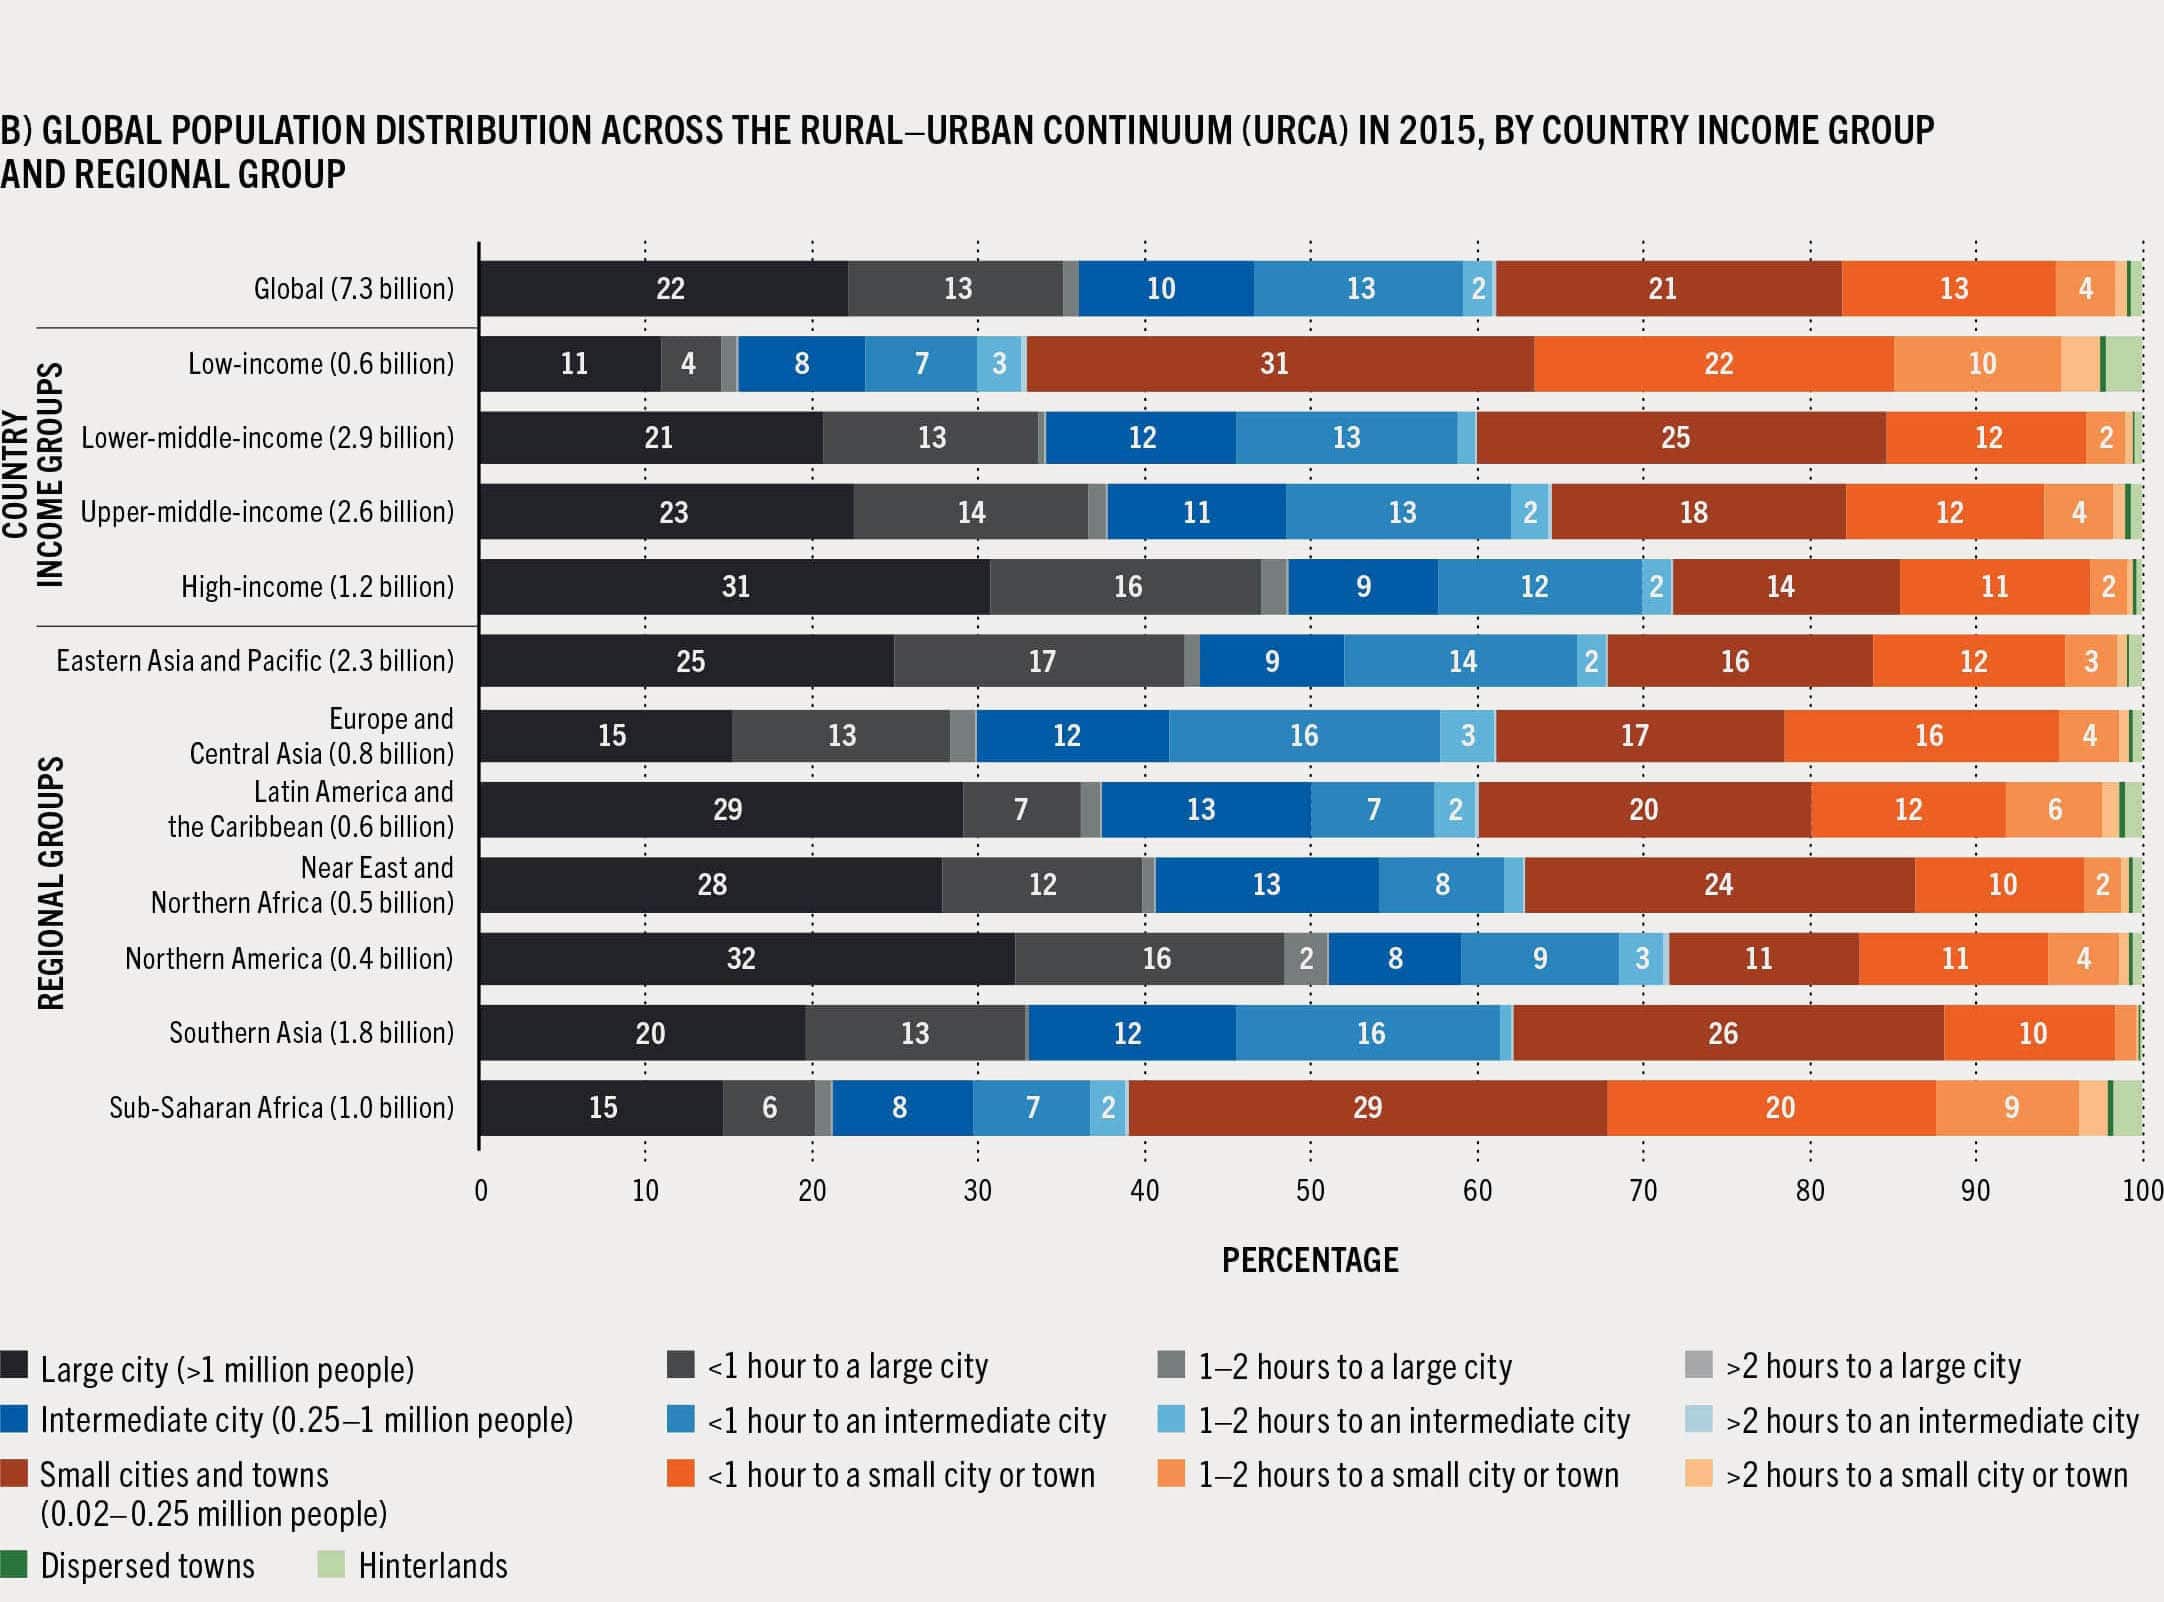
Figure 19A shows a global mapping of the URCA categories around the world and Figure 19B shows the global population distribution of URCA categories by country income group and regional group. The URCA mapping reveals disparities in access to services, with around 3.4 billion people living in peri-urban and rural locations (Figure 19) (see Box 3 for specific URCAs). Around one-fourth of the global population live in peri-urban areas (less than 1 hour to an urban centre) of intermediate and small cities and towns, which challenges the centrality of large cities to development, as well as to the transformation of agrifood systems (Figure 19B). Intermediate and small cities appear to provide catchment areas for proportionately more people gravitating around them compared to larger cities, emphasizing their importance (as conceptualized in Figure 18). Similarly, in low-income countries, 64 percent of the population live either in small cities and towns or within their catchment areas (i.e. locations that gravitate around a specific urban centre in terms of access to markets, services and employment opportunities). All told, almost half of the global population (47 percent) live in peri-urban areas (less than 1 hour to large, intermediate and small cities or towns)n and rural areas (1 to 2 hours or more to an urban centre). Given the increasing connectivity of peri-urban and rural areas and the convergence of high food purchases in both (see Section 3.2), it is clear that peri-urban and rural markets are significant drivers of agrifood systems transformation.
FIGURE 19 Global mapping and distribution of population by rural–urban continuum (URCA) in 2015