


A. Methodology for estimating the PoU for 2020, 2021 and 2022
As in previous editions of this report, due to lack of direct information on the most recent values of each of the elements that contribute to computing the prevalence of undernourishment (PoU) and number of undernourished people (NoU) (see Annex 1B), estimates referring to the most recent years are nowcasted; in other words, they are predictions of the very recent past.
As already noted in last year’s edition of this report, 2020 and 2021 were unique in many respects due to the COVID-19 pandemic and its lingering effects. This demanded special considerations when nowcasting the values of the PoU, especially with respect to estimating the likely change in the coefficient of variation (CV) and to modelling the way in which inequality in access to food contributes to rates of undernourishment. Both aspects required special treatment in consideration of the very special conditions under which food systems operated during the pandemic.
The strategy used to project values of the CV|y from 2019 to 2021 and the ranges of global PoU and NoU estimates followed the same approach as in last year’s edition of this report, while additional considerations were made for 2022. Both are described below.
Projecting CV|y up to 2021
While the values of dietary energy consumption (DEC) are nowcasted using the traditional approach based on information provided by the Markets and Trade Division of FAO, used to inform FAO Agricultural Outlooks, the traditional approach used to nowcast the CV had to be modified to reflect the peculiar conditions of 2020 and 2021. Normally, changes in CV|y (the component of the CV associated with differences in households’ economic conditions) are derived from differences in three-year averages of the prevalence of severe food insecurity based on the FIES (FIsev) that are not explained by changes in food supplies. Use of the three-year average addressed the need to control for possible excess sampling variability in country-level estimates of the FIsev (which, for most countries, is based on relatively small samples of FIES data) and is consistent with an assumption that CV|y follows a relatively stable trend. The exceptional nature of 2020 and 2021 made it difficult to maintain that last assumption. Because of that, the changes between the 2017–2019 average and the 2020 annual values of FIsev were used to nowcast the 2020 values of CV|y, and the changes between the 2020 and 2021 annual values of FIsev were used to nowcast the 2021 values of CV|y.
Another parameter that needed attention to nowcast the 2020 value of PoU was the percentage of change in FIsev (used as a proxy for the expected change in the PoU) that is attributed to CV|y. Normally, this had been assumed to be equal to one-third, based on an econometric analysis of past values of PoU, DEC and CV|y. The exceptional nature of 2020 and 2021 called into question that regularity. As no national household consumption and expenditure survey data in 2020 or in 2021 were available, there is still no empirical basis to determine how to properly modify it. The solution was to conduct a sensitivity analysis modifying the percentage of change in FIsev that is attributed to CV|y from a minimum of one-third to a maximum of one. This defined the lower and upper bounds of the estimated series for 2020 and 2021.
Special considerations for 2022
While the main effects of the COVID-19 pandemic have receded and data collection began to normalize in 2022, there is still considerable uncertainty regarding the extent of the changes in inequality in access to food that may have occurred that year. It is not yet known whether the pandemic and all other disruptive events that have affected agrifood systems worldwide in the last three years have had any persisting effect on the relative roles of demand and supply side elements in people’s access to food. This, in turn, demanded a slight modification of the approach to produce nowcasts of the CV|y, and hence of the PoU, in 2022.
In particular, the value of 33 percent as probable contribution of changes in the CV to the observed changes in the PoU was used to produce the mid-point of the estimated series, reflecting what would be a “back-to-normal” situation (see Annex 1B). Then, additional values of 50, 67 and 100 percent were used, separately for each country, reflecting possible different assumptions about the way in which CV|y might have contributed to PoU in 2022. Note however that, contrary to what was the case in 2020 and 2021, when FIES-based estimates revealed food insecurity worsening practically everywhere, the implications of assuming greater contribution of changes in the CV towards changes in the PoU are somehow opposite for the 2022 value. Considering that estimates of the prevalence of severe food insecurity showed an improvement for many countries from 2021 to 2022, for those countries we project a reduction, rather than an increase in CV|y. Combining the set of all lowest and the set of all highest country estimates, we obtain, respectively, lower and upper bounds for the global and regional series. Overall, the result is a slightly narrower range of global PoU and NoU estimates in 2022 compared to the previous two years (Table A2.1).
Table A2.1RANGES OF PoU AND NoU NOWCASTED IN 2020, 2021 AND 2022
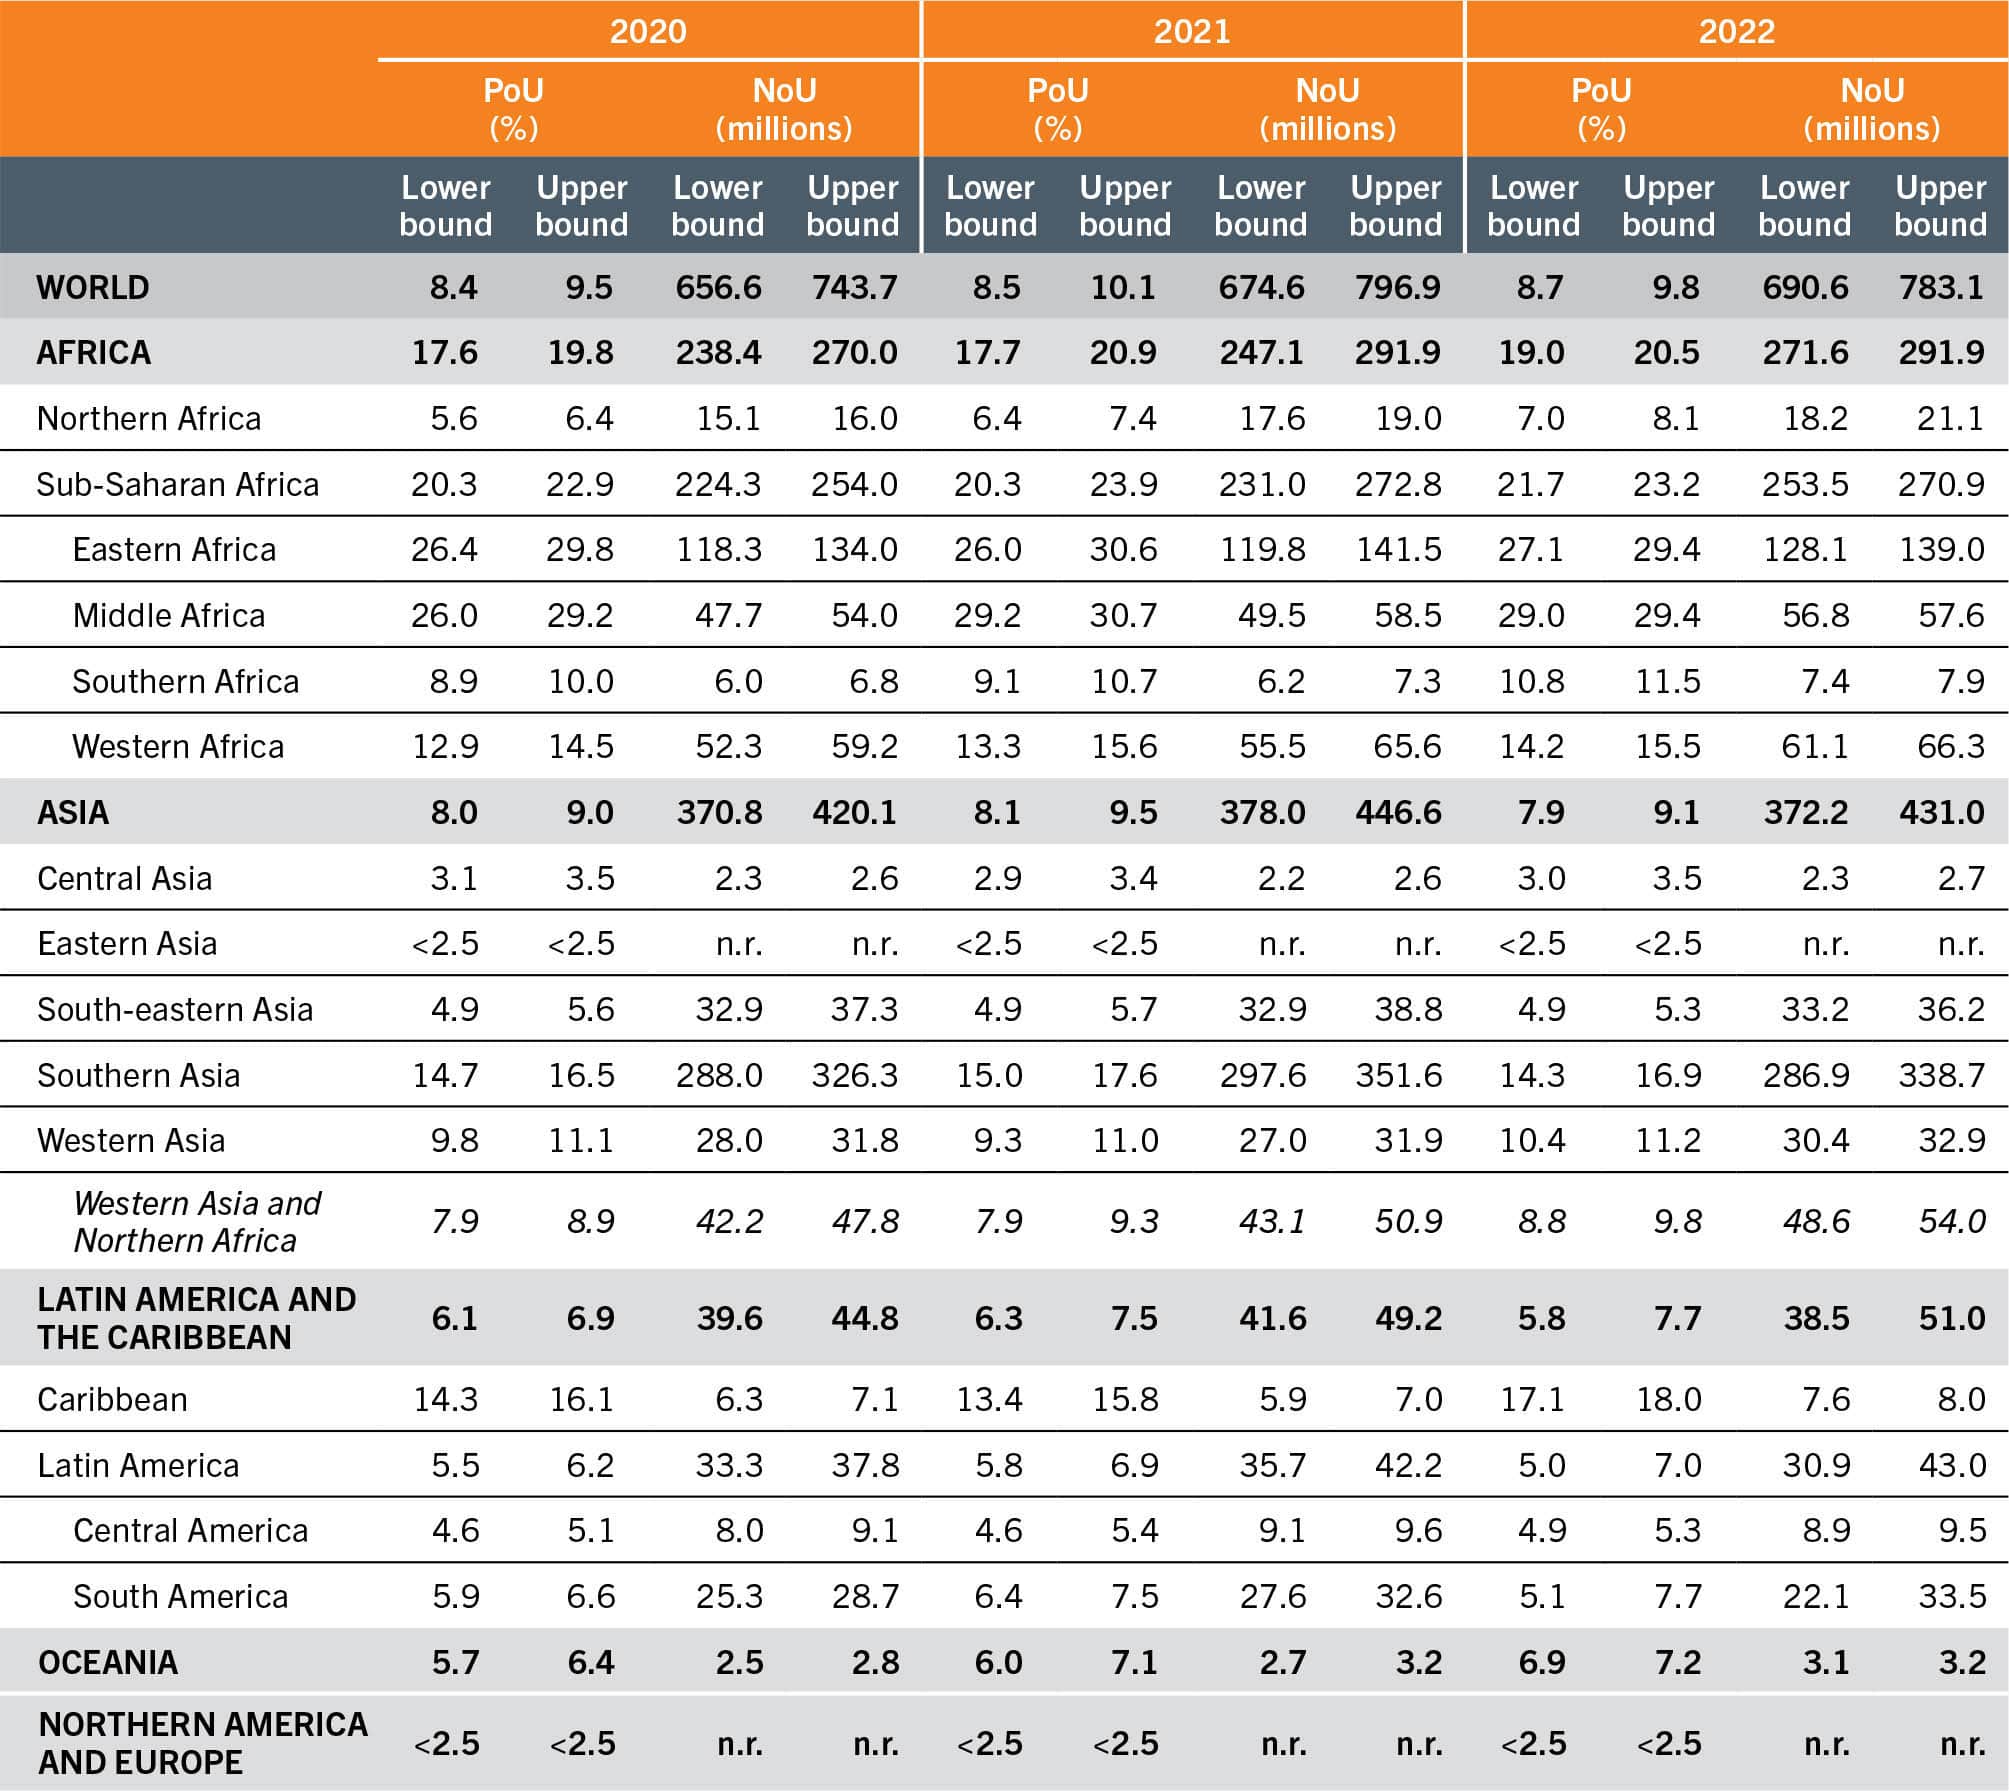
SOURCE: Authors’ (FAO) own elaboration.
Table A2.1 presents the lower and upper bounds of the PoU in 2020, 2021 and 2022 at the global, regional and subregional levels.
B. Methodology for projections of PoU to 2030
To project PoU values to 2030, we project the three fundamental variables that enter in the PoU formula (DEC, CV and MDER) separately, based on different inputs, depending on the scenario considered.
The main source of information is the output of the MIRAGRODEP recursive, dynamic computable general equilibrium model, which provides series of projected values, at the country level, for:
- real per capita GDP (GDP_Vol_pc);
- income Gini coefficient (gini_income);
- an index of real food price (Prices_Real_Food);
- extreme poverty headcount rate (that is, the percentage of the population with real daily income below USD 2.15 (x215_ALL); and
- daily per capita food consumption (DES_Kcal).
The MIRAGRODEP model was calibrated to the pre-pandemic situation of the world economy in 2018 and was used to generate projections of macroeconomic fundamentals into 2019–2030 under three scenarios: 1) “before COVID-19”, which aims to capture the implications for food availability and access (and therefore the PoU) of the world economic prospects as seen before the eruption of the pandemic by the IMF World Economic Outlook published in October 2019; 2) “before the war in Ukraine”, which does the same but considering the World Economic Outlook published in October 2021; and 3) “current prospects”, which is based on the latest World Economic Outlook published in April 2023.17 A more detailed description of the MIRAGRODEP model, as well as the assumptions used to build the various scenarios, can be found in Laborde and Torero (2023).18
In addition, we use the median variant projections of total population (both sexes), its composition by gender and age, and the crude birth rate as provided by the 2022 revision of the UN DESA World Population Prospects.4
Projections of DEC
To project the series of DEC we use the following formula:
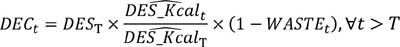
where T = 2019 for “before COVID-19”, T = 2021 for “before the war in Ukraine", and T = 2022 for “current prospects”.
In other words, we take the model projected series of DES_Kcal and adjust its level so that the value for year T matches the actual value. (This is necessary as the MIRAGRODEP model has been calibrated to an older FBS series.)
Projections of MDER
To project the MDER, we simply compute it based on the data on the composition of the population by sex and age as projected by the 2019 World Population Prospects4 (medium variant).
Projections of the CV
As explained in the methodological note on the PoU in Annex 1B, the total CV is computed as 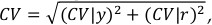 where the two components refer to variability in the per capita habitual dietary energy consumption due to differences across households in terms of income level and variability across individuals based on differences in sex, age, body mass and physical activity level. The projected values for CV in 2025 and 2030 are obtained by applying the formula above to the CV|r and CV|y projected separately. Projected CV|r is computed based on the projected population structures by sex and age as provided by the World Population Prospects (similarly to what we do for the MDER), while the projected CV|y is computed as a linear combination of relevant projected macroeconomic and demographic variables as follows:

To estimate the coefficients used in the above formula, in this edition of the report we considered alternative models that represent an improvement compared to the model used in 2022. As summarized in Table A2.2, the coefficients in the three alternative models are very similar and therefore generate very similar predictions when fed with the same series of projected independent variables obtained from the MIRAGRODEP model and from the World Population Prospects, 2022 revision.4
Table A2.2REGRESSION COEFFICIENTS FROM THREE ALTERNATIVE MODELS ESTIMATED ON HISTORICAL CV|y VALUES (2000–2018) AND COMPARISON WITH THE MODEL USED IN 2022

While the estimation strategy, based on a random-effects linear regression, remains the same as in previous years, the main differences compared to the model used to generate projections of CV|y in 2022 reside in the set of historical data used to feed the estimation model.
First, this year we used the new series of historical values of CV|y that inform the current series of PoU estimates presented in Table 1 and Table A1 of this report, which include a revision of some estimates obtained from data from food consumption surveys that had been used before but that have been reprocessed by considering improved and updated food composition tables, and values derived from the brand new analysis of 14 additional surveys (see the methodological note for the PoU in Annex 1B).
Most importantly, though, this year we use newly sourced series of historical data on real GDP per capita, income Gini coefficient, real food consumer price index (CPI), poverty headcount, crude birth rate and total population. For poverty headcount and income Gini we restricted our sample to household survey-based estimates that are published on the new Poverty and Inequality Platform (PIP) of the World Bank, which replaces both PovcalNet and the Poverty and Equity Data Portal that were phased out in March 2022. The major consequence of relying only on the household survey-based values in the series sourced from the PIP is a reduction in the number of country/year combinations for which direct estimates of income Gini and poverty headcount are available. That brings the number of data points we can use to estimate our model down to 75 from the 119 used in 2022.
In addition, all economic series available through PIP and IMF World Economic Outlook have been updated to reflect the 2017-based revision of purchasing power parity (PPP) published by the International Comparison Program (ICP).19
As there have been various data updates and the differences in the estimated coefficients between the model used in 2022 and the model used this year (Model 3) are quite relevant, leading to slightly different and more optimistic projections of reductions in CV|y, we estimated two additional intermediate models to disentangle the reasons for the different results. We first estimated a model (Model 1 in Table A2.2) using the old set of data for both dependent and independent variables but limited to the 69 country/year combinations that overlap between the 119 used in 2022 and the 75 used this year. Then, we moved to using the newly sourced data from PIP but keeping the poverty headcount values from the 2011-based PPP (Model 2), before adopting all new versions of the variables in the model we ultimately use for our projections (Model 3).
By comparing the values of the estimated coefficients in columns 3–6 of Table A2.2, we note that the main impact derives from having dropped country/year combinations that relied on interpolated or modelled poverty headcount and income Gini coefficients: when moving from the model used in 2022 to Model 1, the coefficients of real GDP per capita and of income Gini increase, both in absolute value and in the level of their statistical significance. Another noticeable effect can be linked to the updates of data to their 2023 version and the addition of six more country/year combinations: the coefficients of real GDP per capita, income Gini and of real food CPI further increase, while the one on the poverty headcount decreases in Model 2 compared to Model 1. Finally, updating the poverty headcount to the 2017-based PPP has overall negligible effects as the coefficients in Model 2 and Model 3 are very close to each other for all variables (with the partial exception of the poverty headcount, whose contribution to explaining CV|y drops further).
Our overall assessment is that CV|y projections this year are more robust. The newly estimated coefficients point to contributions of the explanatory variables in predicting the CV|y in the same direction as estimated before but the same model now fits the data considerably better, as captured by the increased r2 coefficient and increased ratios between estimated coefficients and standard errors, especially for real GDP per capita and income Gini.
The series of CV|y values predicted by the formula separately for each country for the years T + 1 to 2030 is then calibrated to the value for year T, similarly to what is done for the DES:

where T = 2019 for “before COVID-19”, T = 2021 for “before the war in Ukraine”, and T = 2022 for “current prospects”.
C. Methodology for the analysis of food insecurity by degree of urbanization and by gender
The prevalence of food insecurity can be disaggregated by respondent/household characteristics when the data are collected directly from individual respondents in nationally representative samples. In Chapter 2, food insecurity estimates are presented disaggregated by sex of the respondent (adult men or women) and by Degree of Urbanization (DEGURBA) (i.e. urban, peri-urban or rural residency).
The methodology to disaggregate the indicator by any individual or household characteristics is as follows:
- The cross-country comparable probability of food insecurity for each respondent is computed at two levels of severity: moderate or severe, and severe only. The probabilities are aggregated for each category of the characteristic of interest, by computing the weighted average (using sampling weights) across all respondents in that category, obtaining the prevalence of food insecurity within that group (for example, among female respondents).
- The prevalence of food insecurity in a given category is weighted by the corresponding population (for example, the number of female adults in the country) to obtain the subregional/regional/global estimate (for example, the prevalence of food insecurity in the female adult population in Northern Africa), if reliable population data are available and if there is sufficient geographical coverage in terms of percentage of the population.
The computation of the prevalence of food insecurity by sex is possible because data are collected from individual respondents (adults aged 15 years or older) by FAO via data collection service providers (see Annex 1B). For countries for which national government survey data are used to calculate the prevalence estimates of food insecurity (see Annex 1B), it is generally not possible to disaggregate the indicator by sex, as data are collected at the household level. This year, for the first time, a protocol was developed to address this issue. Thus, in such cases, the same relative difference by sex estimated based on data collected by FAO is applied to the prevalence of food insecurity in the total population based on national data. This is an approximation, as the difference in the FAO data applies to adult respondents, and not to the whole population. However, the benefit is that the statistics by sex are consistent in terms of levels and trends with those of the overall population. The entire series was revised in this edition of the report resulting in minor updates to the levels of the prevalence of food insecurity by sex at the regional and global levels compared to the 2022 edition.
The disaggregation by DEGURBA is possible for the first time this year because Gallup© began to georeference each interview in countries collected using face-to-face mode in 2021. In 2022, countries covered by telephone interviews were also georeferenced, providing enough geographical representation to produce subregional/regional/global food insecurity estimates by DEGURBA.
Within each country, it is possible to link each georeferenced observation to the DEGURBA dataset, defining whether the observation (respondent) is located in a city, town or rural area, based on population density and size, according to internationally comparable criteria developed by EUROSTAT, ILO, FAO, OECD, UN-Habitat and the World Bank and approved at the 51st session of the UN Statistical Commission in March 2020.20 The prevalence of food insecurity is computed for each category of urbanization and then aggregated at the subregional/regional/global level using the 2020 updated DEGURBA population distribution published by EUROSTAT.21 For countries where official food insecurity statistics are informed by national data, the same approximation method described for the disaggregation by sex is applied.
As no FIES data were collected by FAO in China in 2022, and the data collected in 2021 were not georeferenced, the estimates of food insecurity by DEGURBA in China were approximated as follows: the prevalence of food insecurity for 2021 was disaggregated by area of residence as defined in the Gallup© World Poll, where respondents report if they live in: a rural area or on a farm; a small town or village; a large city or the suburb of a large city. Then, these categories were mapped to the DEGURBA by considering people living in a rural area or on a farm as part of the “rural” population, those living in a small town or village as part of the “peri-urban” population and those living in a large city and in the suburb of a large city as “urban” residents. This mapping was justified with the rationale that DEGURBA classifies areas with increasing urbanization based on population density and size. To ensure that no significant bias was induced by this approach, the same mapping was validated as accurate for other Asian countries where data were collected in 2022.
D. Methodology for the cost and affordability of a healthy diet
FAO with support from the World Bank Data Group systematically monitors the cost and affordability of a healthy diet (CoAHD) indicators and recently began to disseminate the updated series on the FAOSTAT database.22 Estimates are updated for 2021 (see sections below, Updating the cost of a healthy diet and Updating the affordability of a healthy diet). In addition, periodic revisions of the entire data series are carried out by FAO to continuously improve the methodology and provide robust estimates on the CoAHD indicators.
The cost of a healthy diet
The cost of a healthy diet is defined as the cost of the least expensive locally available foods to meet requirements for energy and food-based dietary guidelines (FBDGs) for a representative person within an energy balance of 2 330 kcal/day. The FBDGs analysed explicitly recommend food quantities for each food group and provide a wide regional representation. Although it is not selected based on nutrient content but is determined by FBDGs, this diet meets on average nearly 95 percent of nutrient needs, so it can therefore almost always be considered as nutrient adequate.
The availability and prices of items in each food group needed for a healthy diet were obtained from the World Bank-led ICP as national averages for 2017. Item definitions are internationally standardized, allowing classification by food group and calculation of the least costs to reach FBDG requirements in each country, representing an average across markets and throughout the year.19 The cost of a healthy diet indicator is calculated using a standard basket, called the Healthy Diet Basket, which consists of six food groups and reflects the commonalities across ten identified FBDGs. For a detailed description of the healthy diet and related methodology, see Herforth et al. (2020, 2022).23, 24
Affordability of a healthy diet
In this report, to determine affordability, the cost of a healthy diet is compared with country-specific income distributions that are derived from the World Bank’s PIP.25 The resulting measures of affordability include the percentage and number of people unable to afford a healthy diet in a given country, in 2021. A healthy diet is considered unaffordable when its cost exceeds 52 percent of the income in a country. This percentage accounts for a portion of income that can be credibly reserved for food, based on observations that the population in low-income countries spend, on average, 52 percent of their income on food, as derived from the 2017 ICP national accounts household expenditure data.
Based on this threshold and comparing the cost of the diet with country income distributions, we obtain the percentage of people for whom the cost of the diet is unaffordable. These proportions are then multiplied by the 2021 population in each country using the world development indicators (WDI) of the World Bank,26 to obtain the number of people unable to afford a healthy diet in a given country. For a detailed description of the affordability indicators and related methodology, see Annex 3 of FAO, IFAD, UNICEF, WFP and WHO (2020).27
Updating the cost of a healthy diet
The ICP is currently the only source of retail food price data for internationally standardized items, as part of a larger effort to compute PPP exchange rates across all countries of the world. However, these data are only available once every three to five years, which does not allow for yearly global monitoring of diet costs to guide programmes and policies. In the absence of updated food price data, in this report, the method of updating the cost indicator between ICP publication years relies on consumer price indices (CPIs) published by FAO. This dataset tracks change in monthly general and food CPIs at the national level with reference to a base year of 2015. The annual CPIs are computed as simple averages of the 12 monthly CPIs within a year. In particular, CPI data for food and non-alcoholic beverages are used to update the cost of a healthy diet in 2021 for all countries except the Central African Republic and Guyana, for which the general CPI is used. The cost of a healthy diet is estimated for the complete series (2018–2021) by multiplying each country’s 2017 actual cost, expressed in local currency units (LCU), with the CPI ratio and finally dividing by purchasing power parities:

where t = 2018, ... , 2021 and 
The cost of the healthy diet is first updated in LCU and then converted into international dollars using the WDI PPP for private consumption conversion factors,28 to compare the cost across countries and political entities. For a detailed description of the methodology, see Bai et al. (forthcoming).29
The cost of the healthy diet was computed for 169 countries and territories in 2017 and updated for 2018–2021 for all of them except Anguilla, Montserrat, and Taiwan Province of China that have information neither on CPIs nor on PPPs. Out of the remaining 166 countries and territories, there are 24 countries with missing PPP data in any year between 2018 and 2021,bg and one territory with missing CPI data (Turks and Caicos Islands). For the 24 countries, PPP imputations were applied using an Autoregressive Integrated Moving Average with External Explanatory Variable (ARIMAX) model. In line with the World Bank’s WDI methodology for PPP extrapolations, the ratio between a country’s general CPI and the CPI for the base country (in this case the United States of America) is included in the model specification as a key predictor of PPP values. Furthermore, per capita GDP and per capita household consumption expenditure are also added as external covariates, and the Holt-Winter smoothing methodology is applied to both the series to fill the gaps, if needed. The ARIMAX approach allows to estimate, for each country, several model specifications that include an autoregressive component, an integration component, a moving average, and a combination of the three. The best specification is selected when at least the estimated coefficient of the CPI ratio is statistically significant, followed by the statistical significance of the ARIMAX parameters. For countries and territories showing abnormal PPP series over time, the CPI ratio is found to be the only statistically significant coefficient to affect the variability of the PPP values. On the contrary, for countries and territories with a less volatile PPP series, the historical PPP trend plays also a role in predicting PPP values, as well as the coefficient estimates of per capita GDP and/or per capita expenditure. The ARIMAX computes the predicted values on the best specification selected for each country/territory.
For one territory with missing information on CPIs (Turks and Caicos Islands), cost imputations were applied using the average diet cost in the corresponding subregion:

Subregional cost averages were computed excluding the Turks and Caicos Islands.
A limitation of this method used to update the cost of a healthy diet in 2018–2021 is that changes in the cost depend on (food) CPIs and do not reflect item-specific changes in food prices, nor any differential changes in the price of different food groups, due to the lack of new item-level food price data for more nutritious food items. FAO is exploring how to expand reporting of item-level prices to allow more frequent and robust monitoring of the cost of a healthy diet.
Updating the affordability of a healthy diet
In this report, affordability was updated for the years 2018 to 2021. Of the 169 countries and territories with cost information in 2017, the affordability indicators were estimated for 143 with income distributions available in the PIP database. This information was updated for all countries and territories for 2018–2021, except Taiwan Province of China for which food CPIs are not available.
Through continuous updates based on incoming national surveys and data imputations, the income distributions in the PIP database25 are now available and updated for the years 2020 and 2021 in many countries and territories. To update affordability in these years, distributions in the PIP database were used for 78 of the 142 countries/territories in 2020, and for 27 in 2021. For the remaining ones (64 in 2020; 115 in 2021), affordability was estimated by the PIP team using projected distributions,30 obtained by applying the World Bank’s standard methods for nowcasting poverty.31 Finally, the proportion of people unable to afford a healthy diet, estimated using both methods, was multiplied by each country/territory’s population using the WDI of the World Bank, to obtain the number of people who could not afford a healthy diet. The latest estimates of the affordability indicators were performed on 26 April 2023. As the PIP database is currently undergoing continuous updates of income distributions, affordability estimations after this date may marginally change.
In this year’s edition, a revision of the methodology involves the affordability data series. Following the recent release of new PPP for 2017, the World Bank adopted these latest conversion factors to express its collection of monetary indicators in 2017 PPP terms, including income distributions in the PIP database.25 It implies that the indicators of affordability are no longer expressed in 2011 PPP as in previous years but rather in 2017 PPP. Shifting the base year has led to considerable variations in affordability for certain countries. Nonetheless, this change is associated with improvements in the quality of PPPs and better reflects the current economic situations worldwide.32 Specifically, for seven countries, the share of people unable to afford a healthy diet was at least 7 percentage points lower in 2021 when expressed in 2017 PPP instead of 2011 PPP (Angola, Plurinational State of Bolivia, Egypt, Iraq, Jordan, Sao Tome and Principe, and Suriname). Conversely, it was 14 and 7 percentage points higher in Ghana and Belize, respectively. The World Bank has also acknowledged large changes to the measure of poverty rates for the same countries listed, following the adoption of 2017 PPP. These were carefully evaluated and found to reflect improvements in the quality of the PPPs.32 In some of these countries, the 2017 PPPs are based on price data from a broader list of items than in the 2011 PPP round; in other countries, price data were collected for the first time in 2017, overcoming the limitation of imputed PPPs prior to this round. In the case of upper-middle-income countries such as Ghana and Belize, the cost thresholds have risen between 2011 and 2017, and hence the share and number of the population whose income falls below the thresholds (i.e. are unable to afford a healthy diet) is larger.33
E. Methodology for the rural–urban analysis of nutrition outcomes
A rural–urban analysis in Section 2.3 was carried out according to urban and rural residence as applied to four nutrition indicators using regional estimates with their confidence intervals. The analysis was performed across regions based on data availability for countries within each region.
The weighted analysis was applied using the latest available data from national surveys between 2015 and 2021. The list of countries contributing to each region is presented in Table A2.3; data sources are included in table notes.
Table A2.3Countries and territories with nutrition outcome data from national surveys between 2015 and 2021 for exclusive breastfeeding and between 2016 and 2022 for stunting, wasting and overweight that contributed to the rural–urban analysis
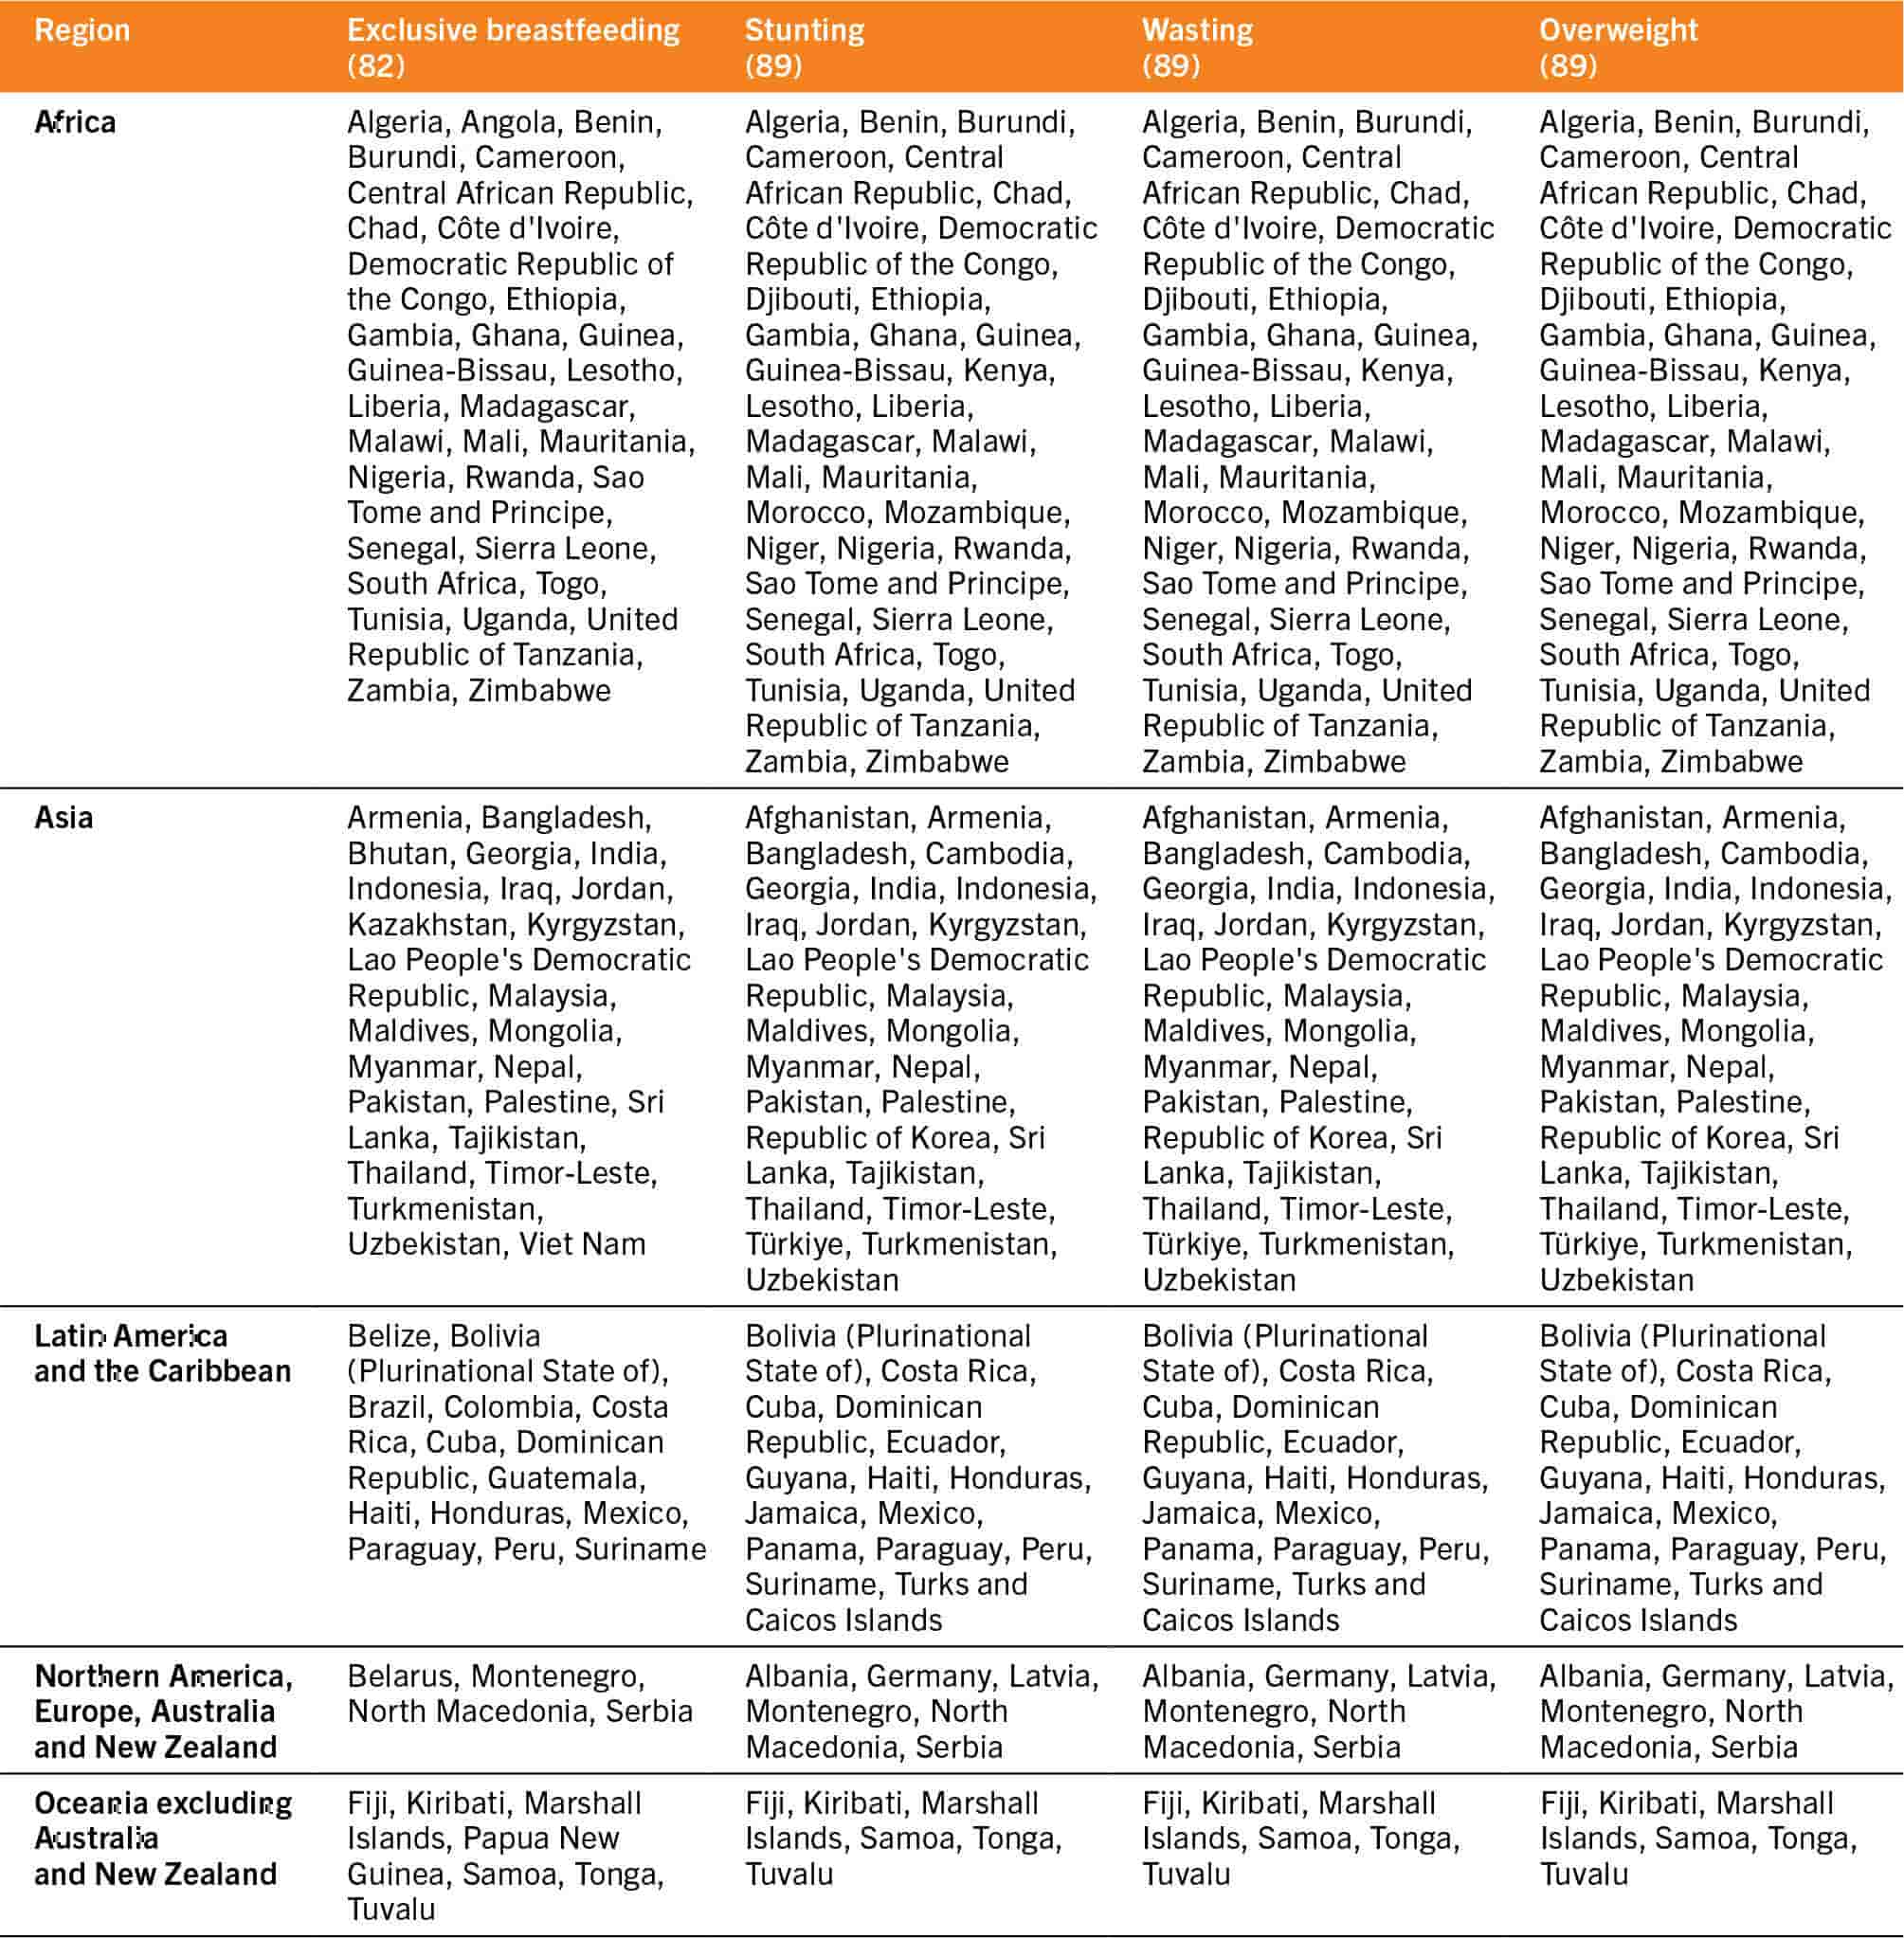
The regional urban and rural results presented are based on a population-weighted analysis of a subset of countries with disaggregated data available by place of residence using the latest available data from national surveys between 2015 and 2021 for exclusive breastfeeding and between 2016 and 2022 for stunting, wasting and overweight. The regional rural and urban estimates are presented only when the regional estimate by residence has a population coverage of 50 percent or more by rural or urban residence. Population coverage is calculated by dividing the sum of the population of children under five years for countries with at least one data point from household surveys within the specified year range by the total population of children under five years for all countries in the region.
F. Methodology for assessment of progress against nutrition targets at the regional and global levels
These methodological notes pertain to results presented in Table 6 in Section 2.3 of the report which depicts the regional and subregional assessment of progress towards the 2030 nutrition targets. Progress was assessed against the 2030 nutrition targets established by UNICEF/WHO34 and an adapted version of rules from the WHO-UNICEF Technical Expert Advisory Group on Nutrition Monitoring35 for all indicators where 2030 targets or progress assessment rules have not been established.
To determine which progress assessment category to use for each indicator and each region, first, two distinct average annual rates of reduction (AARR)bh were calculated: i) the AARR required for the region to reach the 2030 target; and ii) the actual AARR that the region has experienced to date. The value of the actual AARR experienced to date is then used to determine which progress assessment category the region is assigned, while also considering the required AARR. See Table A2.4 for AARR ranges and prevalence thresholds applied for each category and for each indicator, briefly:
- On track: regions with an actual AARR that is greater than the required AARR are categorized as being “on track” (green) to achieve the target. A static threshold for the latest prevalence, as noted for each indicator in Table A2.4, is also used to categorize regions as being “on track”; for example, any region for which the most recent overweight prevalence is below 3 percent is considered “on track”, even if their actual AARR is less than their required AARR.
- Off track: regions with an actual AARR that is less than the required AARR and for which the latest prevalence is above the “on track” static threshold noted in Table A2.4 are considered “off track”. The “off track” category is broken down into different subcategories depending on the indicator. For the indicators of child stunting, child overweight and child wasting, there are three off track subcategories: “off track – some progress” (yellow), “off track – no progress” (light red) and “off track – worsening” (dark red). For low birthweight and exclusive breastfeeding, the categories of “off track – no progress” (light red) and “off track – worsening” (dark red) are combined into one category of “off track – no progress or worsening” which is represented with an orange colour, because there is insufficient variation in the progress to date to use the two categories for these indicators.
- Assessment not possible: For the indicators based on country-modelled data (child stunting, child overweight, low birthweight), an assessment is possible for all regions because a modelled estimate exists for all countries meaning there are enough data to generate representative estimates for all regions and for all years. For indicators where country-modelled estimates are not available (child wasting and exclusive breastfeeding), assessment is not possible for regions where population coverage is less than 50 percent (see footnotes 16 and 17 to Table A2.4).
Table A2.4Rules for progress assessment against the global nutrition targets

1. For low birthweight and exclusive breastfeeding, the categories of “off track – no progress” and “off track – worsening” are combined into one category of “off track – no progress or worsening” because there is insufficient variation in current progress to split these categories for these indicators.
2. For exclusive breastfeeding, the actual target is to increase the prevalence of exclusive breastfeeding (under six months) to 70 percent by 2030; however, it has been revised here to reflect the prevalence of non-exclusive breastfeeding so that the concept of the AARR can be applied as it is for the other six targets.
3. The required AARR is based on the change in stunting prevalence corresponding to a 50 percent reduction in the number of children affected by stunting between 2012 and 2030, considering the population growth estimated by the United Nations World Population Prospects. Actual AARR is calculated using all years of data between 2012 and 2022.
4. Regions considered on track are those where the stunting prevalence point estimate or the lower 95 percent confidence interval for 2022 is below 3 percent.
5. The required AARR is based on the required change in overweight or wasting prevalence to reduce from the baseline (2012) prevalence to 3 percent by 2030. Actual AARR is calculated using all years of data between 2012 and 2022. Note that for wasting, unpublished trend estimates from the JME are used to generate the actual AARR.
6. Regions where the overweight or wasting prevalence point estimate for 2022 is below 3 percent are considered on track.
7. The required AARR is based on the change required to reduce the low birthweight prevalence by 30 percent between 2012 (baseline year) and 2030. The same AARR of 1.96 is required for all regions since the target requires a relative change (reduction by 30 percent) in the baseline value. Actual AARR is calculated using all years of data between 2012 and 2020.
8. Regions where the low birthweight prevalence point estimate for 2020 is below 5 percent are considered on track.
9. The required AARR is based on the required change to decrease the non-exclusive breastfeeding prevalence to 30 percent between 2012 (baseline year) and 2030. Actual AARR is calculated using only two estimates for the years of 2012 and 2021, where the regional averages are population weighted using the most recent estimate for each country between 2005 and 2012 for the 2012 estimate, and between 2016 to 2021 for the 2021 estimate.
10. Regions where the non-exclusive breastfeeding prevalence point estimate for 2021 is below 30 percent (i.e. where exclusive breastfeeding is ≥70 percent) are considered on track.
11. The global databases for the indicators of stunting, overweight and low birthweight are based on country-level models which provide annual estimates for all countries for generation of regional and global estimates (i.e. annual estimates are even available for countries without any household survey data, even in cases where country-modelled estimates are not released to the public and used only for generation of global and regional estimates), thus making progress assessment possible for all regions.
12. Progress assessment against the child stunting and child overweight targets is not conducted for countries which did not have any input data (e.g. household survey data) to use in the country model which were more recent than 2022, or for which modelled estimates remain pending final review.
13. Progress assessment is not possible for wasting for regions where population coverage is less than 50 percent. Population coverage is calculated by dividing the sum of the population of children under five years for countries with at least one data point from household surveys between 1990 and 2020 by the total population of children under five years for all countries in the region. Since wasting estimates are generated with a subregional model, even one year of data between 1990 and 2020 counts towards the regional population coverage.
14. Progress assessment against the child wasting target is not conducted for countries which do not have at least two data points (e.g. household surveys) between 2005 and 2022, with at least one point being more recent than 2012.
15. Progress assessment is not possible for exclusive breastfeeding where the population coverage of country survey data for the region is less than 50 percent for the 2012 and/or the 2021 estimate. For 2012, population coverage is calculated by dividing the sum of the population of children under five years for countries with at least one data point from household surveys between 2005 and 2012 by the total population of children under five years for all countries in the region. For 2021, population coverage is calculated by dividing the sum of the population of children under five years for countries with at least one data point from household surveys between 2016 and 2021.
SOURCE: Elaborated using information from: WHO & UNICEF. 2017. Methodology for monitoring progress towards the global nutrition targets for 2025 – technical report; and WHO & UNICEF. 2017. The extension of the 2025 Maternal, Infant and Young Child nutrition targets to 2030. WHO and UNICEF.
The years of data used to calculate the actual AARR experienced to date at the regional level vary by indicator as specified in the footnotes for Table A2.4. The actual AARRs for each region are calculated using a trend line comprising all estimates available between 2012 (baseline) and the latest estimate for each indicator, except for exclusive breastfeeding for which modelled estimates are not available and which is calculated using only two estimates: the baseline (2012) and the latest year available (2019). The required AARR is calculated using the baseline prevalence for the region in 2012 and the target prevalence as noted in the 2030 Maternal Infant and Young Child Nutrition targets34 (e.g. for child overweight, the required is AARR is 3.41 percent per year at the global level, which is the annual rate of change needed to go from the 2012 baseline prevalence of 5.6 percent to the targeted 3.0 percent in 2030).

