


As highlighted in Chapter 3, a thorough understanding of how urbanization is driving changes in agrifood systems that affect the availability and affordability of healthy diets is only possible through a rural–urban continuum lens. As seen in Chapter 3 and illustrated in Figure 20, food environments reflect a complex interplay among supply-side drivers including food pricing, product placement and promotion, and demand-side drivers including consumer preferences and purchasing power.
Together this complex interplay of supply and demand in agrifood systems is key to understanding how urbanization is affecting access to affordable healthy diets across the rural–urban continuum. A more nuanced georeferenced mapping of the spatial and functional connectivity across the rural–urban continuum, using the newly available FAO Urban Rural Catchment Areas (URCA) global dataset (see Chapter 3 and Box 2), thus becomes a key tool to arrive at such a thorough understanding.
This chapter contributes new evidence on how urbanization is changing food supply and demand across the rural–urban continuum, drawing from analysis utilizing the URCA data combined with georeferenced household survey data (Section 4.1). This is followed by additional analysis for selected countries that explores differences in the cost and affordability of a healthy diet (CoAHD), food insecurity, and different forms of malnutrition across the URCA-defined rural–urban continuum (Section 4.2).
4.1 Understanding food supply and demand across the rural–urban continuum
- ➔ New evidence for 11 Western, Eastern and Southern African countries shows that while high shares of food purchases among households living in urban centres are expected (78–97 percent), shares are surprisingly high across the rural–urban continuum. This is the case even for rural households living 1 to 2 hours (56 percent) and more than 2 hours (52 percent) from an urban centre.
- ➔ Own production is not the main source of food in rural areas in the 11 African countries. In fact, the average share of own production represents only 37 percent and 33 percent of total household food consumption in high- and low-food-budget countries respectively, dispelling the notion that rural populations in Africa rely primarily on subsistence farming.
- ➔ Given that rural households in the 11 African countries do not produce the majority of the food value they consume, the affordability of healthy diets is equally critical across the rural–urban continuum.
- ➔ While the diffusion of processed foods, including highly processed foods, is already advanced in Asia and Latin America, it is spreading quickly in Africa as well. In the 11 countries in Africa, rural households are consuming processed foods, including highly processed foods, across the rural–urban continuum, even in remote rural areas.
- ➔ Highly processed foods are a small proportion of total purchases and their consumption is higher in urban areas; however, results show the penetration of highly processed foods in rural areas, even those living 1 to 2 hours or more from a city or town.
- ➔ Moving across the continuum from urban to rural areas in these countries, there is an increasing household food consumption value share of staple foods and pulses, seeds and nuts, and a decreasing value share of animal source foods and food away from home. In contrast, shares of vegetables, fruits, and fats and oils are uniform across the rural–urban continuum.
- ➔ While animal source food consumption value shares are strongly driven by income across the rural–urban continuum, in contrast, shares of fruits and vegetables are driven more by access and availability.
As highlighted in Chapter 3, urbanization, combined with rising incomes, increases in the opportunity cost of time related to work, lifestyle changes and demographic shifts, is changing food demand. These factors together with many supply-side considerations, including food pricing, marketing and promotion, among others, in turn are changing agrifood systems, so there is a reinforcing compounding effect on the food produced, supplied and consumed.
Most notably, rapid urbanization is leading to rising and changing food demand, and shifts in patterns of food supply1, 2 – especially in sub-Saharan Africa and Southern Asia, the two regions exhibiting the highest urbanization rates. Projections of overall food expenditure estimate an approximate 2.5-fold increase in sub-Saharan Africa and a 1.7-fold increase in Southern Asia by 2050.1, 3, 4
An understanding of the changes occurring in food supply and demand based on empirical evidence is crucial for policymakers. This knowledge is needed to design appropriate food, agricultural and nutrition policies, as well as related sector policies such as health, city and regional planning, and education. Only through all of these policies can agrifood systems be leveraged to deliver healthy diets that are affordable to everyone across the rural–urban continuum.
While there is a substantial amount of literature that discusses the effect of urbanization on food demand,5 sound empirical evidence that looks at the full spectrum of the rural–urban continuum is still scarce and limited. To date, the majority of existing research is based on the descriptive comparison of food demand between rural and urban areas. While this research is important, this simple comparison does not reflect the reality of changing settlement patterns and demographic shifts within a rural–urban continuum.
New research suggests that the differences between urban and rural food demand may not be as acute as previously thought (see Chapter 3). However, this research does not provide an understanding of the magnitude of the differences in food demand across the full spectrum of the rural–urban continuum, nor an understanding of the location-related factors (i.e. where households live in relation to various points across the rural–urban continuum), and other household (e.g. socioeconomic) or food environment factors that may be driving these differences.
To help bridge this gap, this section presents an analysis of food demand, defined as household food consumption (at market value) across the rural–urban continuum in selected countries, applying the newly available geospatial URCA dataset. The URCA classification provides a more granular lens to explore the interplay of food supply and demand across the rural–urban continuum than the Degree of Urbanization (DEGURBA) classification used in Chapter 2, which is an official methodology for delineating urban and rural areas for international and regional statistical comparisons.
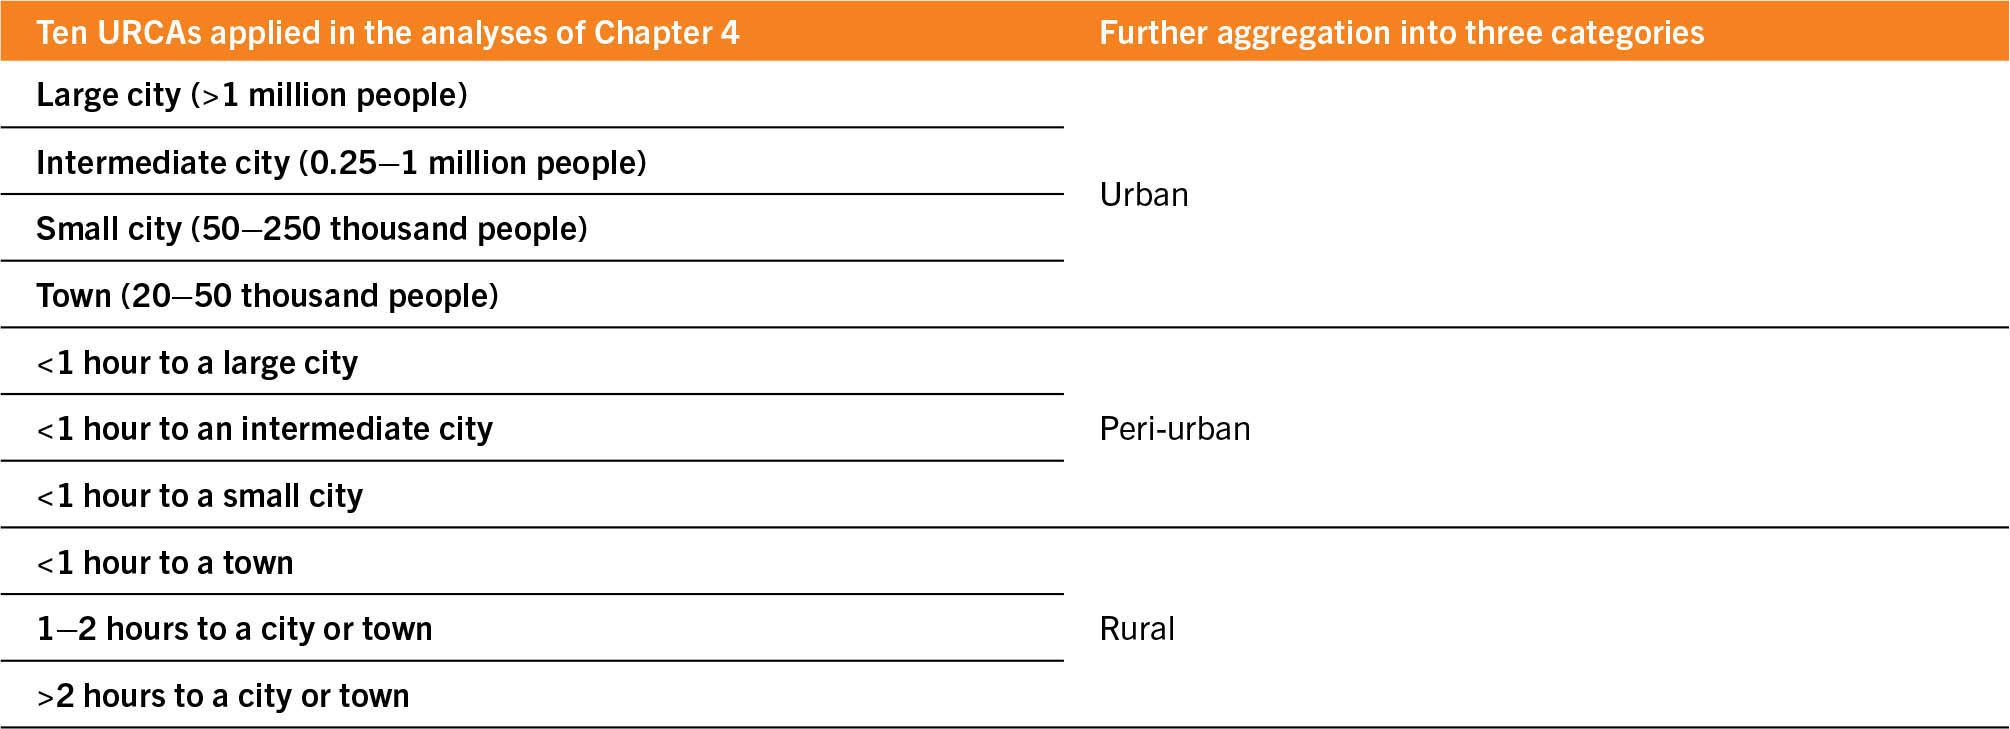
The URCA methodology defines urban centres across a rural–urban gradient based on population size and density, whereby the city size is a proxy for the breadth of services and opportunities provided by an urban centre. Uniquely, the URCA dataset also classifies rural locations using the shortest travel time to an urban centre, as a proxy for the cost of accessing goods, services and employment opportunities (see Chapter 3 and Box 2). There are 30 urban–rural catchment areas (URCAs) categories in total; however, for the purpose of the analysis in this chapter, these are further aggregated into ten categories (Table 9). To facilitate the presentation and discussion of the more complex data, some of the analysis is further aggregated into three categories for urban, peri-urban and rural areas (see Table 9).
TABLE 9URBAN–RURAL CATCHMENT AREAS (URCAs) USED IN CHAPTER 4
The URCA global geospatial dataset is mapped against latitudinal and longitudinal data of households from the most recent World Bank Living Standards Measurement Study (LSMS), making it possible to work with different categories of catchment areas across the rural–urban continuum – as defined in Box 3 in Chapter 3.
The availability of georeferenced household survey data was a major limiting factor for selection of countries for this food demand analysis, as there are currently only a handful of LSMS datasets that have latitude and longitude information which is publicly available.r All of these datasets are for Africa; hence the analysis in this section is limited to country case studies in that region. However, as an analysis of food demand across the URCA-defined rural–urban continuum, it is the first of its kind and provides insights on the importance of using a rural–urban continuum lens when analysing other regions. Given that Africa has the highest share of the total population unable to afford a healthy diet (77.5 percent in 2021) (see Chapter 2) and is lagging behind in food security and nutrition, focusing on countries of this continent is with merit in itself, especially as it has one of the highest rates of urbanization in the world. The analysis presented below also serves to highlight the need for further analysis covering other regions, which will depend on an increased availability of georeferenced survey data.
To evaluate household food consumption behaviour, georeferenced data from nationally representative LSMS surveys covering the period 2018/19 are used for Benin, Burkina Faso, Côte d’Ivoire, Ethiopia, Guinea-Bissau, Mali, the Niger, Nigeria, Senegal and Togo, and 2019/20 for Malawi.s The LSMS surveys capture household food consumption using a seven-day recall. For the food demand analysis, reported foods are aggregated into categories based on food source, food processing level and food group. Food sources are defined using four categories, the first three of which are assumed for at-home consumption, specifically food from own production, food purchased, and food received as a gift or as in-kind payment for labour. The value of food consumption from own food production and food received as a gift or in-kind is valued at the market price that households would have had to pay if they had purchased the same quantity from the market.27 The fourth category comprises all foods consumed away from home (e.g. from street vendors and in restaurants).
The classification of food items by level of food processing was adapted from the NOVA food classification system,6, 7 focusing only on those foods classified as low processed (“processed” in the NOVA classification) and highly processed. See Annex 5 for a full description of the datasets and definitions applied, including descriptions of food groups and details about food processing.
In the food demand analysis that follows, the 11 countries were classified into two groups according to their food budget, that is the market value of the average total household food consumption per capita per day: high-food-budget countries (average 2.3 PPP dollars per capita per day) and low-food-budget countries (average 1.6 PPP dollars per capita per day) (Table 10). Countries were first ranked based on average food budget and then split into high- and low-food-budget countries. Countries were split into the two groups with no reference to a benchmark, but they depict a cross-section of African countries from the perspective of different levels of development in terms of average total household food consumption, which also roughly correlates with average total household expenditure, a proxy for household income (Table 10). They fell roughly into above and below 2 PPP dollars per capita per day food budget.t, u
TABLE 10Food budgets, income levels and household food consumption shares for high- and low-food-budget countries analysed

SOURCE: Dolislager, M.J, Holleman, C., Liverpool-Tasie, L.S.O. & Reardon, T. 2023. Analysis of food demand and supply across the rural–urban continuum in selected countries in Africa. Background paper for The State of Food Security and Nutrition in the World 2023. FAO Agricultural Development Economics Working Paper 23-09. Rome, FAO.
Moreover, there is an assumption that the differences in food budgets will lead to different patterns of consumption. This is based on a well-established economic law, referred to as Bennett’s law,v, 8 which stipulates that diets become more diversified with higher levels of food consumption, income and employment. Thus, the differences in food consumption point to larger food budgets providing “room” for additions beyond staple foods with increasing expenditure on non-staple products (as Bennett’s law predicts) as well as on industrially (rather than home) processed food products that reduce the opportunity cost of time for women and men engaged in employment (see Chapter 3). Usually higher food budgets are correlated with both of these consumption changes, and the two sets of countries allow this correlation to be tested. This is of particular relevance when seeking to understand how urbanization is driving changes in agrifood systems and how this is likely to affect food demand and access to healthy diets, as we shall see next.
The two country food-budget groups add a further dimension to the analysis that relates to an ongoing debate about what happens in countries of high and low per capita food consumption: Are the latter just traditional, or are they also changing? One expects to find more diversified diets and processed foods in urban areas, as well as in places where there are higher levels of food consumption per capita, but, as we shall see below, looking at food demand across the rural–urban continuum and comparing high- and low-food-budget countries, this may not be the case as a rule. If the patterns of food demand are the same – between either urban, peri-urban and rural areas or low- and high-food-budget countries – this in itself is an important finding. Indeed, the insights and messages are stronger if one sees they are happening both across the rural–urban continuum and in high- and low-food-budget contexts.
For the 11 African countries analysed, Figure 22 shows the country population distribution across ten categories (i.e. URCAs) of the rural–urban continuum (see Table 9 for specific category grouping). While there are country exceptions in each group, in general, high-food-budget countries tend to have a larger share of the population living in large and intermediate cities and their surrounding peri-urban areas (41.5 percent) compared to low-food-budget countries (34.2 percent).
FIGURE 22 Distribution of population across ten URCA categories of the rural–urban continuum, for selected countries, 2020

SOURCE: FAO estimates based on 2020 GHS-POP dataset and FAO URCA dataset.
Furthermore, high-food-budget countries are in most cases characterized by dense metropolitan urbanization patterns, while low-food-budget countries tend to have more dispersed urbanization patterns around small cities and towns. Figure 23 provides a mapping that represents two contrasting patterns of urbanization: dense metropolitan (e.g. Nigeria) and small city and town dispersed (e.g. Burkina Faso). The maps provide a useful visual for “unpacking” the ten URCA categories (see Annex 6 for maps of other countries analysed).
FIGURE 23 Two contrasting patterns of urbanization: dense metropolitan urbanization (Nigeria) and small city and town dispersed urbanization (Burkina Faso)


As highlighted in Chapter 3, the spatial patterns and degree of connectivity of rural–urban linkages determine the impacts of urbanization on agrifood systems. The analysis presented below attempts to find empirical evidence of a “location effect”; that is to say, to test if the different URCAs across the rural–urban continuum are contributing determinants of food demand. An important limitation of this analysis, however, is that it does not completely isolate the location effect from other drivers such as food environment considerations including, inter alia, the role of industry product placement and promotion.
In the sections that follow, we explore three different aspects of food consumption, examining patterns and their drivers across the rural–urban continuum for high- and low-food-budget countries. First, food consumption patterns are analysed in terms of how households acquire food, meaning whether the food they consume is purchased, own-produced, acquired as gifts or in-kind barter, or purchased as prepared meals eaten away from home. The extent of consumption of purchased foods sheds light on the importance and reach of food supply chains, moving out from urban areas across the continuum to more remote rural areas. The conventional view is that households living in or just outside urban areas purchase most of their food, whereas households in rural areas largely produce their own food. Especially in the context of sub-Saharan Africa, there is a persistent view that households living in rural areas are subsistent farmers who produce their own food, with the exception of the landless poor who are reliant on farm labour and who purchase or barter to meet some of their food consumption needs.
Second, food consumption patterns are analysed in terms of the share of total household food consumption that is low processed and highly processed. This analysis can shed some light on the magnitude and reach of the midstream food value chains and the associated employment that this sector generates (see Chapter 3) related to both low processed and highly processed foods.w In addition, low processed foods can provide many advantages to households through enhanced shelf-life, food safety, convenience, and in some cases nutritional enhancement (e.g. fortification). On the other hand, many highly processed foods are energy dense and high in fats, sugars and/or salt, and research suggests that they may contribute to overweight and obesity as well as some non-communicable diseases (NCDs) (see Chapter 3). As already highlighted, it is expected that the consumption of both low processed and highly processed foods is higher with higher levels of food consumption and especially where income and employment are higher.
Third, household food consumption patterns are analysed examining the market value of the foods consumed by food group, which provides insights into the spread of the consumption of diverse diets among households across the rural–urban continuum. Urbanization is generally associated with a change in consumption behaviour, with urban households usually eating a more diversified diet including more expensive foods such as animal source foods and fruits (see Chapter 3). However, some studies suggest that it is higher income, rather than urbanization per se, that is causing these diet shifts.
Food purchases are a major contributor to household food consumption across the rural–urban continuum, even among the rural poor
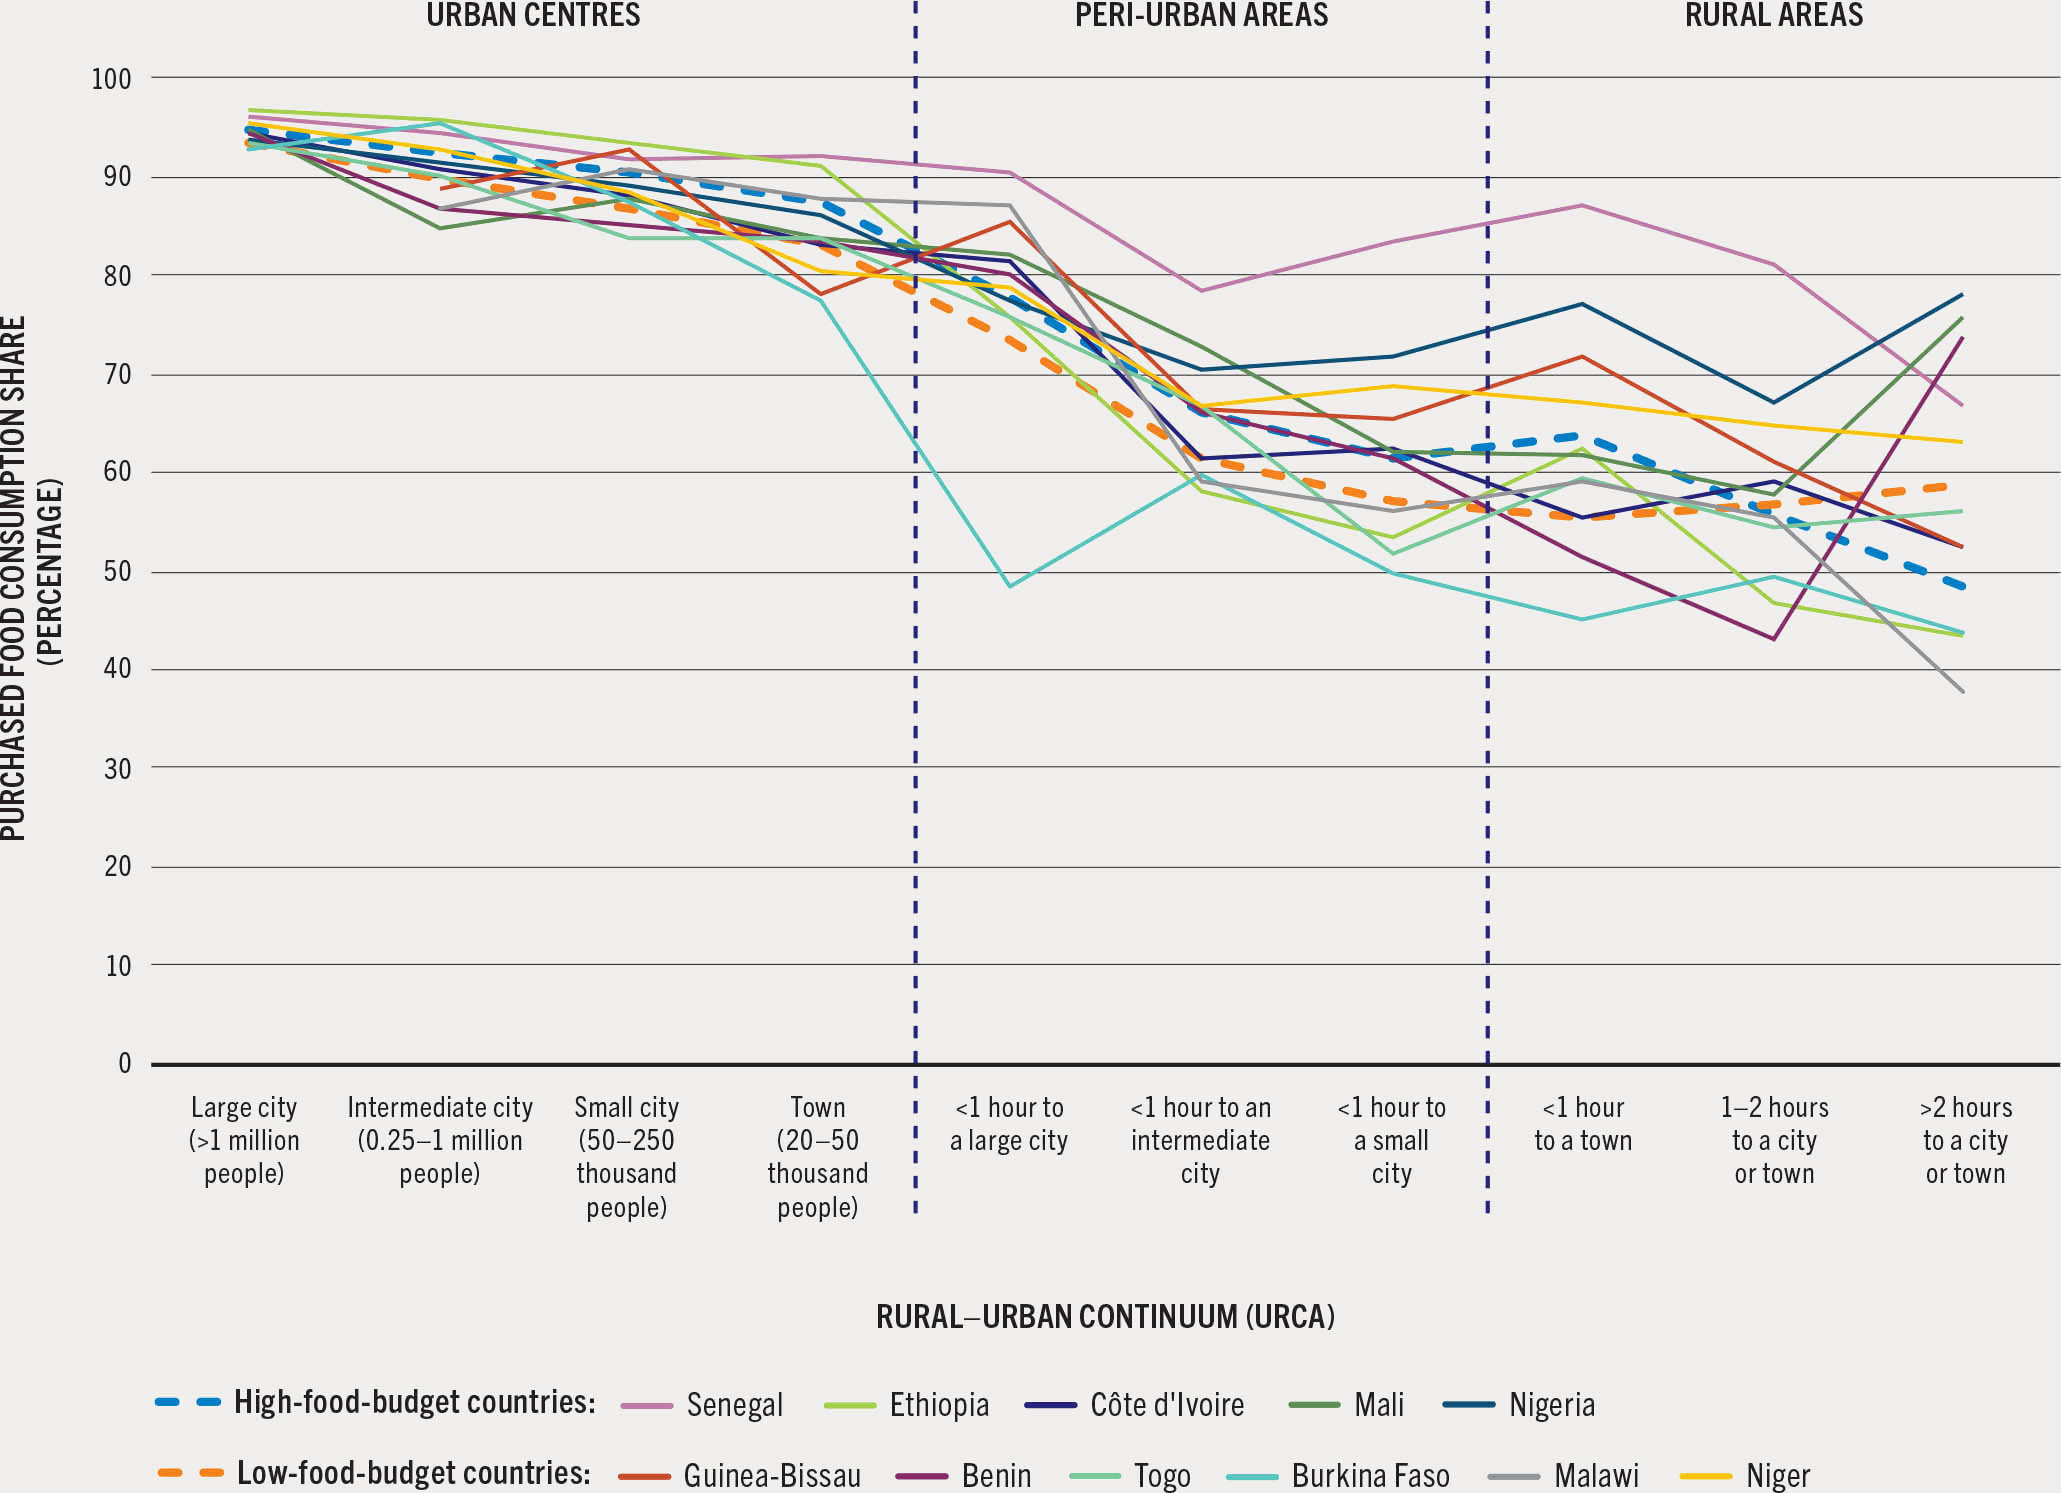
Across the 11 high- and low-food-budget African countries, food purchases form the majority of total household food consumption in value terms, including food for home consumption and food consumed away from home (Figure 24). While high shares of food purchases relative to total food consumption among households living in urban areas are to be expected (78–97 percent), shares are surprisingly high across the rural–urban continuum, even for rural households living 1 to 2 hours from a small city or town (56 percent on average) and for those living more than 2 hours from any urban centre (52 percent on average). The finding that in most of the countries analysed the “majority” of household food consumption in rural households is coming from purchases (56 percent on average in the 11 countries analysed) is a major deviation from the traditional image of rural subsistence households (Box 5).
FIGURE 24 While high food purchases among households living in urban areas are expected, they are surprisingly high across the rural–urban continuum, even for rural households
SOURCE: Dolislager, M.J, Holleman, C., Liverpool-Tasie, L.S.O. & Reardon, T. 2023. Analysis of food demand and supply across the rural–urban continuum in selected countries in Africa. Background paper for The State of Food Security and Nutrition in the World 2023. FAO Agricultural Development Economics Working Paper 23-09. Rome, FAO.
BOX 5The myth of rural subsistence farming in Africa
Especially in the context of sub-Saharan Africa, there is a persistent view that households living in rural areas are subsistence farmers who produce their own food, yet the analysis in this report indicates that this does not hold true. Using market prices, the value of food consumption from own production is estimated here, that is the value that households would pay if they acquired the same quantity of that food from the market. Findings show that, moving from urban to rural areas across the continuum, food consumption shares of own production grow, with a sharp increase starting in areas less than 1 hour from a large city (Figure A1).
And yet, own production never becomes the main source for food – not even in rural areas. In rural areas, the average share of own production represents only 37 percent and 33 percent of total consumption in high- and low-food-budget countries, respectively. The shares range from 8 percent to 50 percent in high-food-budget countries, and from 18 percent to 47 percent in low-food-budget countries (Figure A1).
These surprising findings hold true even among poor rural households (Figure A2), who obtain on average 40 percent and 36 percent of food consumption from own production in high- and low-food-budget countries, respectively. Furthermore, these shares of own production are not much higher than the shares found for peri-urban households (i.e. an average of 34 percent in both high- and low-food-budget countries). Given that rural households do not produce the majority of the food value they consume, their capacity to afford a healthy diet is a key factor to consider regarding their consumption of nutritious foods.
Figure A All households across the rural–urban continuum have food consumption shares from own food production that are less than 50 percent


SOURCE: Dolislager, M.J, Holleman, C., Liverpool-Tasie, L.S.O. & Reardon, T. 2023. Analysis of food demand and supply across the rural–urban continuum in selected countries in Africa. Background paper for The State of Food Security and Nutrition in the World 2023. FAO Agricultural Development Economics Working Paper 23-09. Rome, FAO.
Indeed, the diffusion of high levels of food purchases across the rural–urban continuum (Figure 24) confirms that food markets and supply chains are important to rural areas in both high- and low-food-budget countries. Furthermore, the average food purchase share for populations living in rural areas is only slightly lower in high-food-budget countries (55 percent) than in low-food-budget countries (57 percent), indicating a convergence across different patterns of urbanization and income levels.
As expected, food purchase shares decline moving from urban to rural areas across the continuum. The decline is slightly steeper for low-food-budget countries moving from urban to peri-urban areas (32 percent decline, versus 27 percent in high-food-budget countries), whereas moving from peri-urban to rural areas the drop is significantly higher in high-food-budget countries (18 percent on average) than in low-food-budget countries (6 percent).
While this pattern over the rural–urban continuum applies on average, there are variations between countries depending on the density of urbanization patterns. For example, there is a notable increase in purchases in areas less than 1 hour from a town in Ethiopia, Guinea-Bissau, Nigeria and Togo (Figure 24).
Another striking finding is that for four countries, there is an uptick in food purchases in the most remote rural areas (more than 2 hours travel to a city of any size): Mali and Nigeria (high-food-budget countries), and Benin and Togo (low-food-budget countries). The uptick in purchases in these areas can be explained in several ways. First, farmers in remote areas tend to be poorer, meaning households often need purchases to “smooth consumption” or compensate for poor harvests. Second, in furthest outlying rural areas (more than 2 hours travel to a city or town), local non-farm employment is scarce, as are services, and therefore households focus more on migration to bring in money, which can be used to buy food. This pattern affects both low- and high-food-budget countries.
The traditional view of a rural–urban divide formed a few decades ago, when most rural areas in Africa were much poorer and less connected to urban areas. However, more recently, the urbanization occurring in many African countries is dispersed, with growing networks of interconnected small cities and towns and increased connectivity with rural areas. This translates directly to expansive growth in off-farm employment opportunities, interconnected food markets and food supply chains; lifestyles thus change, which in turn affects how households acquire food and what foods they eat (see Chapter 3).
Looking to other regions, studies show there is substantial evidence of high levels of food purchases in rural areas, for example in Asia, including studies from Bangladesh, Indonesia, Nepal and Viet Nam.9, 10 These studies find similar patterns of food purchases in rural areas, but the convergence between urban and rural food purchase patterns is more advanced than in Africa.
When household income levels are considered, the notion that rural households in sub-Saharan Africa rely primarily on subsistence farming for food still does not hold. The findings show that food purchases represent 50 percent or more of total household food consumption (including own production valued at market prices) across all income groups in rural areas of most of the countries, which is by no means low. The main exception is Ethiopia, which drags down the average share of food purchases for high-food-budget countries (Figure 24). Ethiopia is an outlier case among the high-food-budget countries, as its pattern of urbanization “straddles” the divide between “dense metropolitan” and “small city and town dispersed” (see Figure A6.1 in Annex 6), with poorer outlier rural areas not well connected due to very poor or limited road infrastructure.11
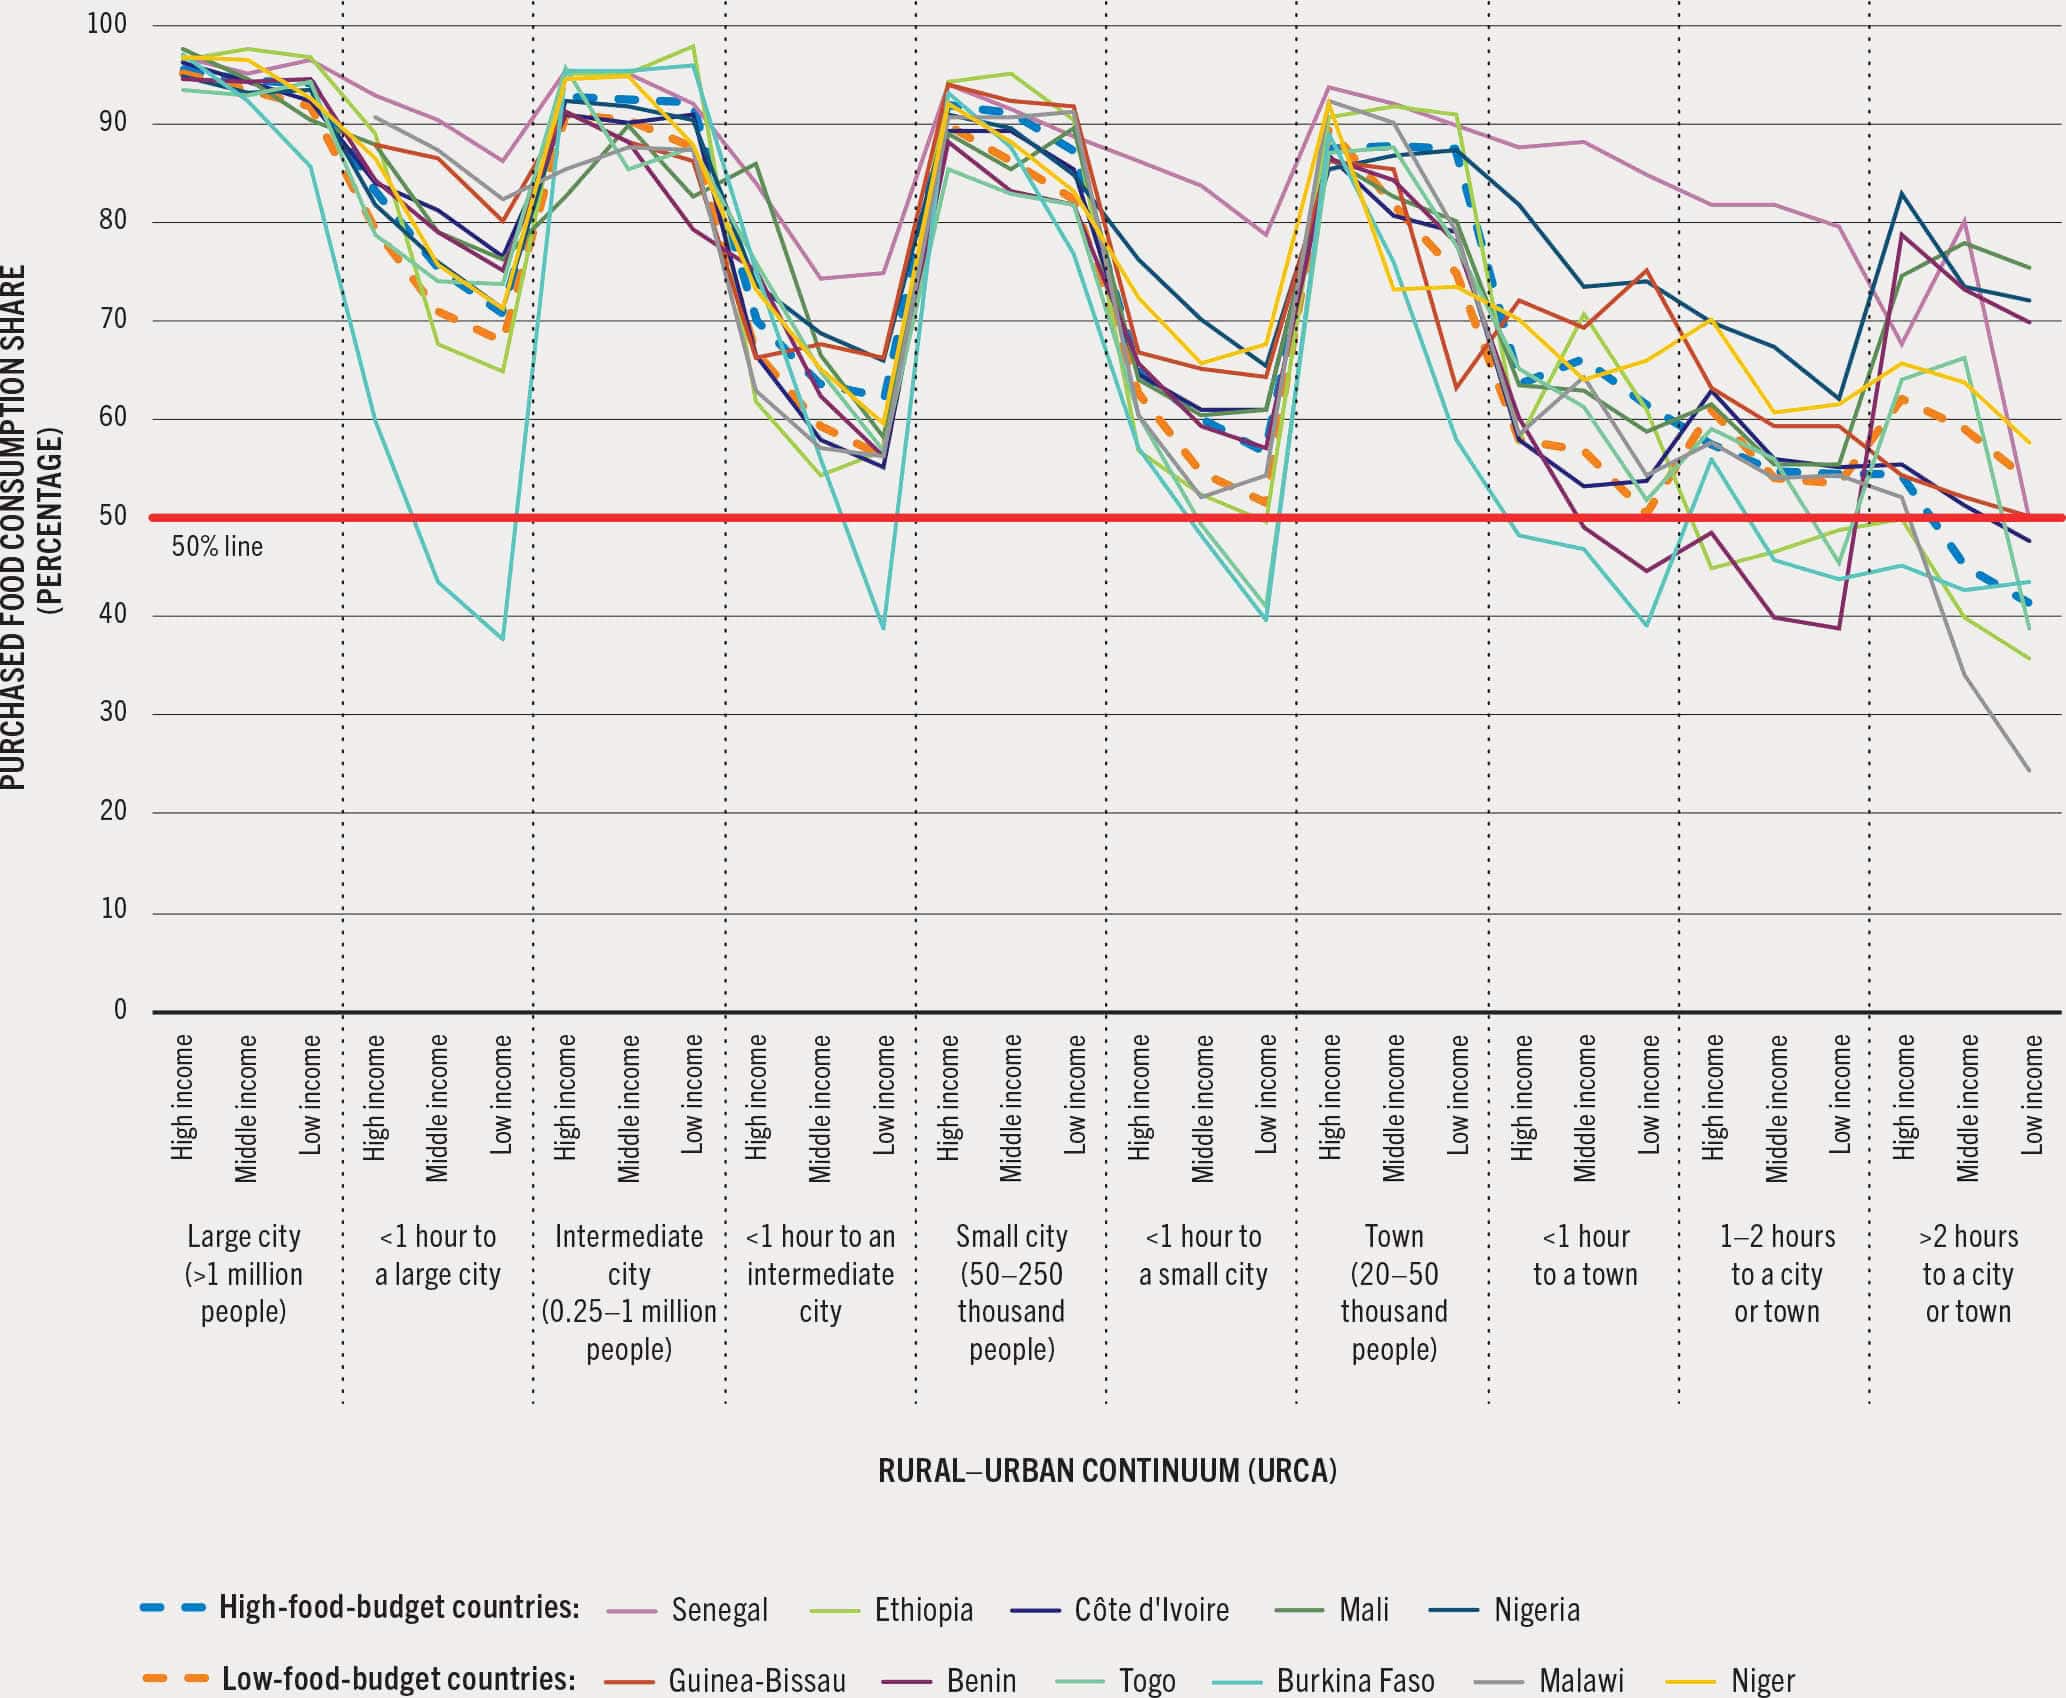
Food purchase shares of low- and middle-income households are lower overall than the shares of high-income households across the rural–urban continuum (Figure 25). The differences are small in urban areas, but become much bigger in peri-urban areas less than 1 hour from either a large city or an intermediate city. This suggests that while these households still rely on food purchases, own food production is also important (Box 5). The pattern holds for both high- and low-food-budget countries, although food purchase shares are slightly lower for the latter.
FIGURE 25 There is a marked drop in purchased food consumption shares for low- and middle-income households living in peri-urban areas, with levels similar to rural households in both high- and low-food-budget countries
SOURCE: Dolislager, M.J, Holleman, C., Liverpool-Tasie, L.S.O. & Reardon, T. 2023. Analysis of food demand and supply across the rural–urban continuum in selected countries in Africa. Background paper for The State of Food Security and Nutrition in the World 2023. FAO Agricultural Development Economics Working Paper 23-09. Rome, FAO.
In urban and rural areas, the dispersion of food purchase shares across household income groups is smaller than in peri-urban areas, indicating that household income is less of a factor driving food purchase shares for urban and rural households. The only exception is poor households in more remote rural areas (more than 2 hours travel to a city or town), whose food purchase shares are 31 percent and 15 percent less than high-income households in the same areas of high- and low-food-budget countries, respectively.
The descriptive analysis presented up until this point is backed up by an econometric analysis that looks into the determinants of food purchase shares for the high- and low-food-budget countries. Determinants include location across the rural–urban continuum, household income, non-farm employment, food prices,x age, education, marital status and gender of the head of the household, household size, and size of cultivated land, ownership of assets and animal stocks. Table A7.1 in Annex 7 presents the full econometric results. Here we highlight some of the key findings from this analysis.
For both country food-budget groups, there is statistical confidence about the location effect across the rural–urban continuum; that is, the farther from a large city, the lower the share of purchases in total household food consumption. As observed in the descriptive analysis, this pattern is fairly smooth and continuous.
Holding all other factors constant, the effect of income on the food purchase share is positive in both sets of countries (excluding Ethiopia, which shows a negative effect), with a somewhat higher effect in low-food-budget countries – according to the supplementary econometric analysis. This can be interpreted as meaning that households “start purchasing” at lower income levels in high-food-budget countries; that is, the transition of diets in the form of purchasing has spread more into lower-income households in that group of countries. This coincides with the findings of other studies.12
In both country food-budget groups, furthermore, more non-farm employment (and hence non-farm income) leads to a higher food purchase share. This was found reliably in all country cases and when controlling for gender (except Guinea-Bissau). Male rural non-farm employment shows a somewhat stronger effect in low-food-budget countries (for the reason noted above). The effect is present but less supported for female employment in both high- and low-food-budget countries.
Another important result is that education of the head of the household, particularly secondary schooling, even when controlling for income, is correlated with a higher household food purchase share. The result is particularly strong in high-food-budget countries. This may reflect a variety of factors such as greater opportunity cost of time (for home production) in the types of jobs held by the more educated. In addition, when accounting for gender, there is a positive effect for female-headed households in high-food-budget countries, excluding Malawi. This could again be linked to opportunity cost of time for women in these households to do both their own farming and home processing of food, versus buying food to free up time for home chores and management.
Furthermore, results show that the larger the household size the lower the household food purchases, in both high- and low-food-budget countries. This is presumably because having their own labour allows households to substitute purchased food with their own production, for example in processing and farming. This is reinforced with the expected negative effect on food purchases of ownership of farmland and animal stocks.
There is a diffusion of processed foods and food away from home across the rural–urban continuum, but it is higher in urban areas
In all regions, there has been diffusion of purchased processed foods, as well as food away from home (e.g. prepared food from vendors or in restaurants), in urban and rural areas. Over centuries, small- and large-scale processing of staple foods (e.g. polished rice, wheat and maize flour, edible oils) have introduced essential time- and energy-saving innovations, presenting opportunities for nutritional enhancement such as food fortification. Food processing has continued to grow, expanding to prepared foods, both at small scale (often unpackaged and unbranded) and at very large scale (packaged and branded). While the diffusion of processed foods, including highly processed foods, is already advanced in Asia9 and Latin America,13 it is spreading quickly in Africa as well.14
Increasing numbers of women are working outside the home in both urban and rural areas, while men and women are increasingly commuting to work in urban areas and going to off-farm jobs in rural areas. These factors may prompt a rise in purchases of prepared food from food service enterprises, due to reduced time availability for home processing (e.g. hand-pounding grains) and food preparation. The dynamics of supply and demand for processed foods, however, are complex. There has been a surge on the supply side, with small and medium enterprises and large private companies alike making massive aggregate investments in all types of processed foods (from minimally to highly processed) in response to demand.14 At the same time, aggressive marketing and relatively low pricing – and even interference in policies to curb consumption of highly processed foods and sugar-sweetened beverages – are driving up consumption.
There is a critical role for minimally and low processed foods as part of a healthy diet; in addition, they are a major and growing source of employment across the rural–urban continuum (see Chapter 3). On the other hand, there is growing evidence of the role of highly processed foods in the development of overweight, obesity and related NCDs (see Chapter 3). Many countries now seek to curb consumption through targeted interventions (e.g. bans in schools) and population-based policies (e.g. taxation and front-of-pack labelling) (see Chapter 5). Recent studies in Africa show that the expansion of food supply chains in the processing sector (processing, wholesale, transport and retail) provides a major source of employment across the rural–urban continuum, especially for women and youth.12 Latest estimates indicate that 20 percent of rural employment and 25 percent of urban employment are in agrifood systems jobs such as wholesale and processing.12 Unfortunately, few of these studies provide sufficient disaggregation of product portfolios to assess the balance of potential benefits and harms to healthy diet goals.
Examining the household consumption of both low processed and highly processed foods and food away from home provides insights into food demand across the rural–urban continuum. The demand for processed foods of all types in Africa is expected to continue to rise over the next decades with urbanization, the continued rise in rural non-farm employment and the concomitant effects on cost savings of food preparation and thus demand for convenience foods. Increased commuting to work is also raising the opportunity cost of time for both men and women, with meals and snacks purchased at roadside stalls, restaurants and market kiosks. Evidence shows that this process has already been seen in other developing regions.15, 16
In the analysis that follows, all food items were classified by level of food processing based on the four main groups in the NOVA food classification system. Unprocessed and minimally processed foods (group 1) were then excluded from the analyses in this section. Groups 2 and 3 were combined as one group, referred to as “low processed”, and group 4 was maintained as highly processed. See Annex 5 for an explanation and full description and sources of the processing categories applied. In addition to these two categories, food away from home was made a separate, single category, because there is insufficient information to identify the extent of processing for all items involved and it is therefore not possible to accurately categorize such food.
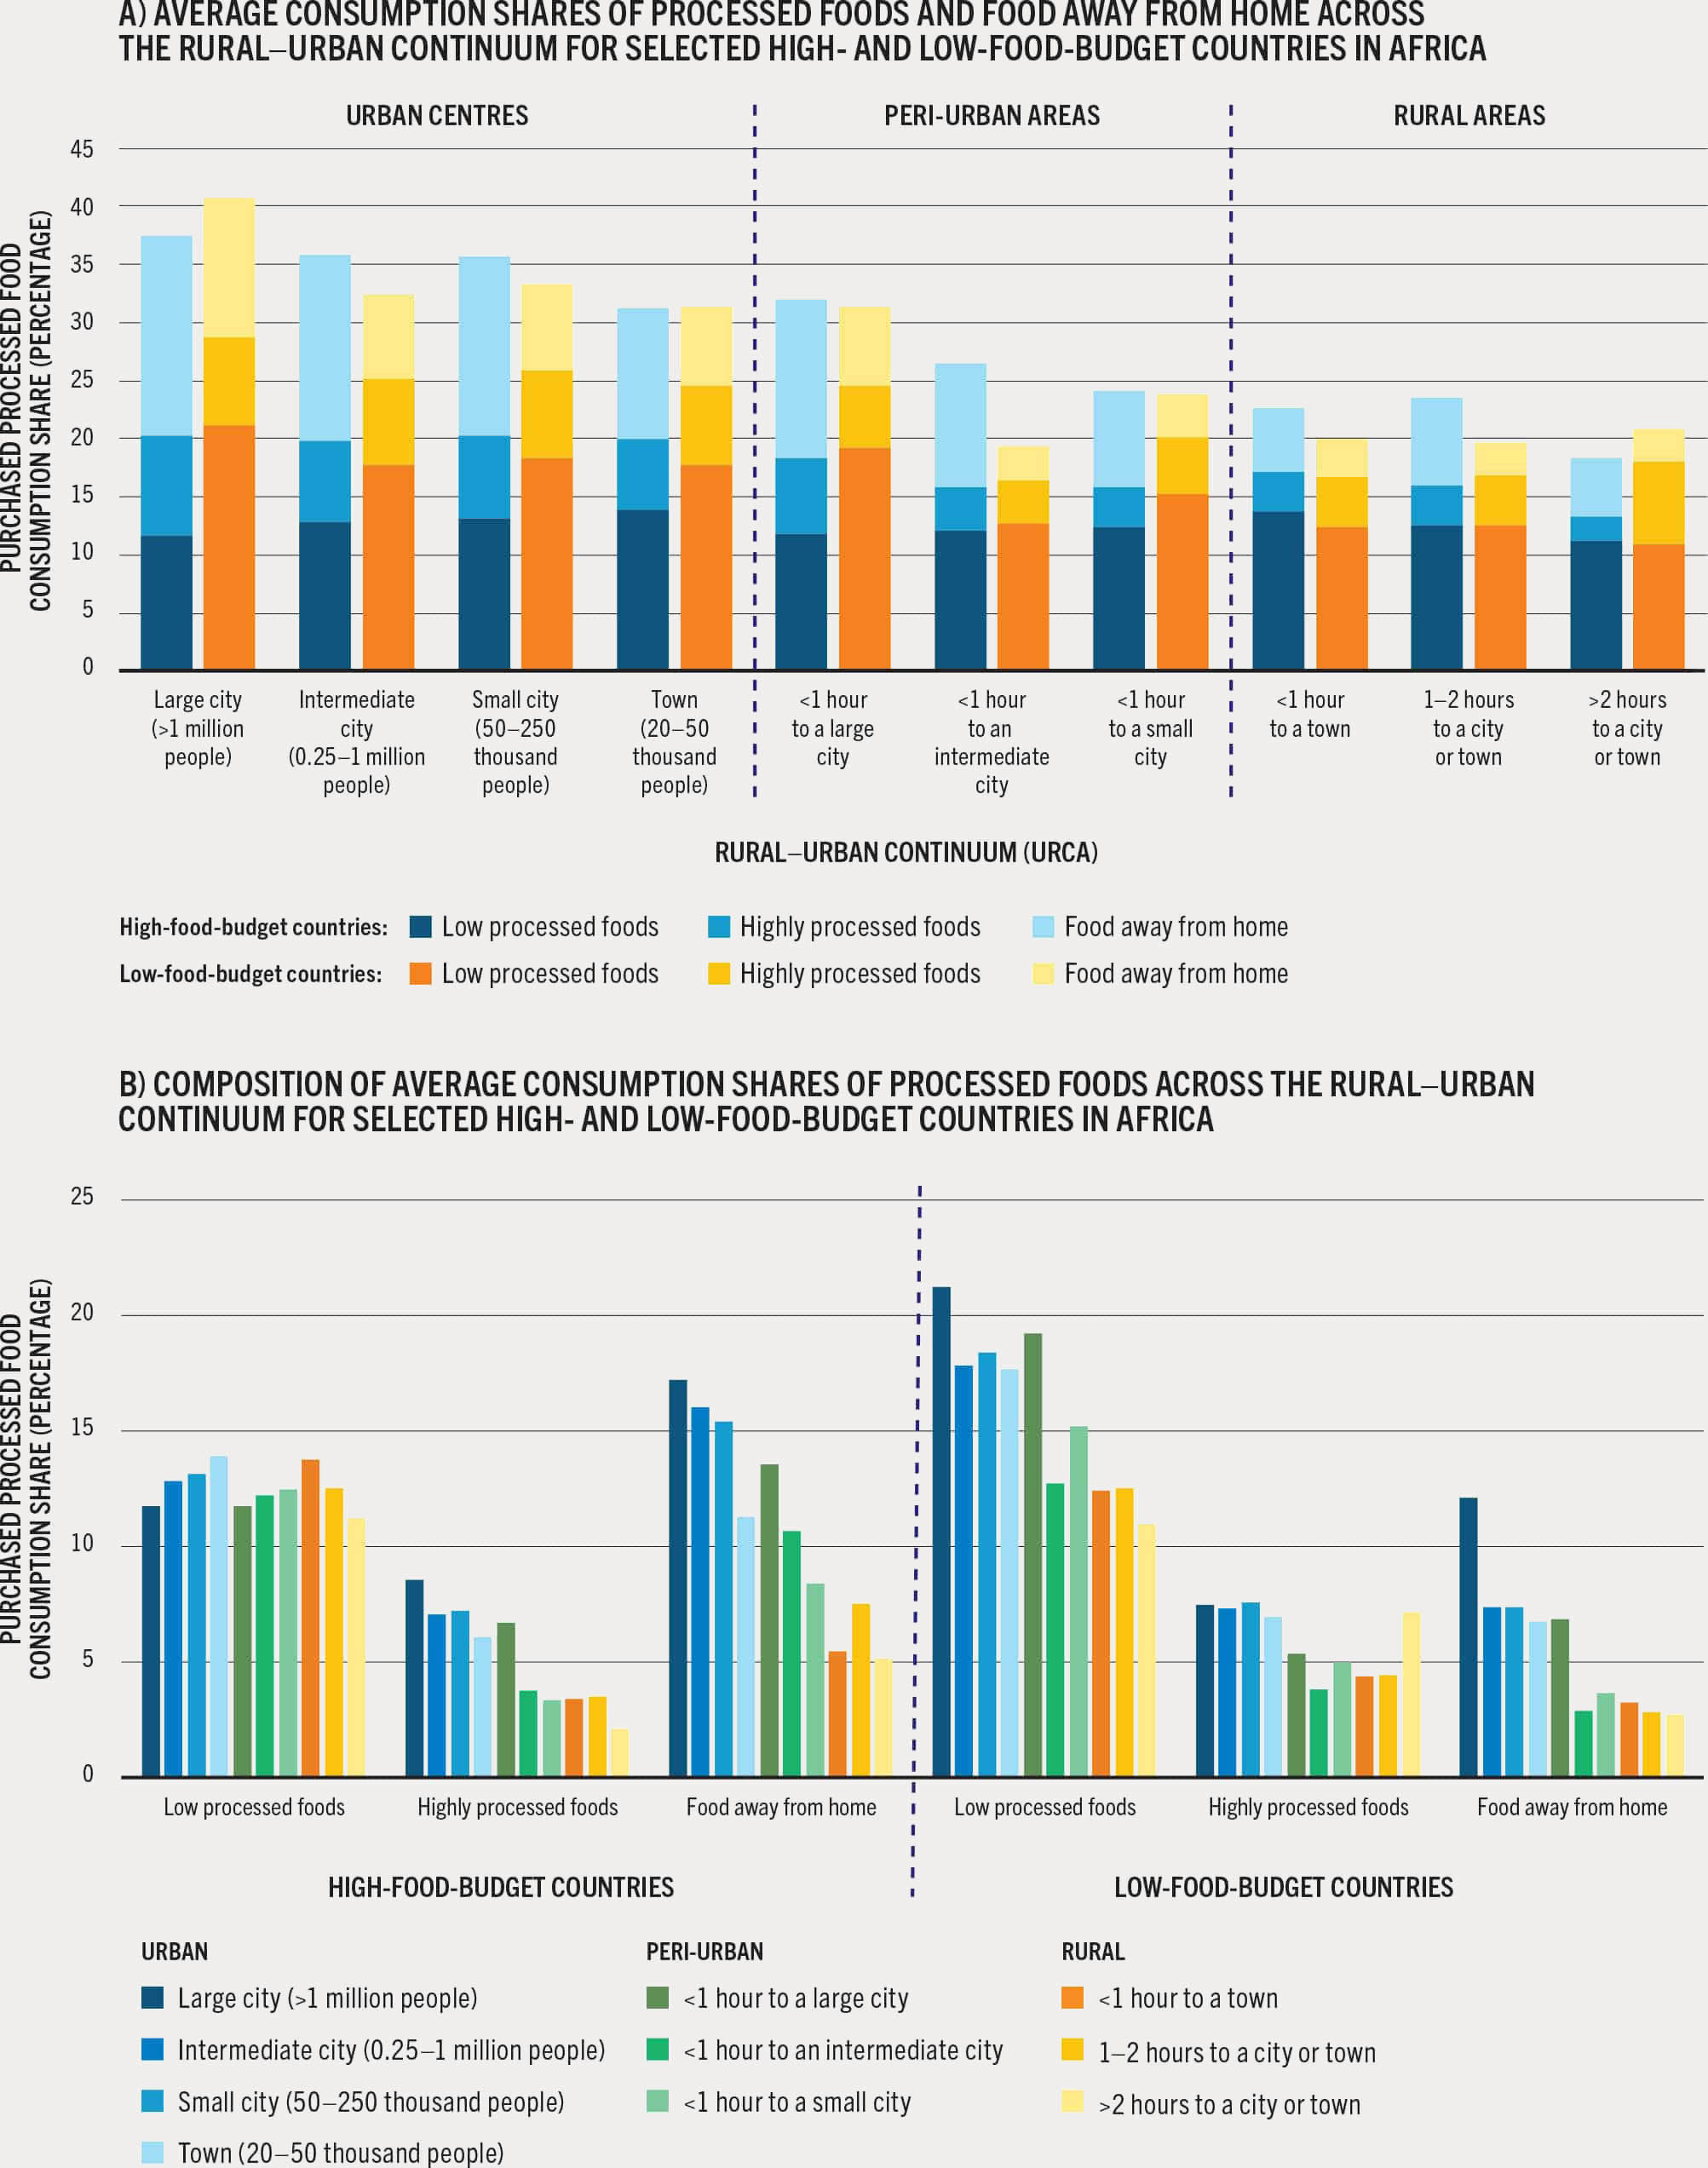
The diffusion of processed foods across the continuum is similar and quite extensive for both high- and low-food-budget countries Figure 26A). The exception to this is in areas less than 1 hour from intermediate cities of low-food-budget countries, where the share is much lower if compared to the same catchment areas of high-food-budget countries. On average, the share of total processed foods and food away from home is 29 percent in high-food-budget countries, and 25 percent in low-food-budget countries. Even households living in rural areas 1 to 2 hours or more from a city or town are consuming processed foods and food away from home.
FIGURE 26 In the 11 countries in Africa, rural households are consuming processed foods, including highly processed foods, even those living 1 to 2 hours or more from a city or town
SOURCE: Dolislager, M.J, Holleman, C., Liverpool-Tasie, L.S.O. & Reardon, T. 2023. Analysis of food demand and supply across the rural–urban continuum in selected countries in Africa. Background paper for The State of Food Security and Nutrition in the World 2023. FAO Agricultural Development Economics Working Paper 23-09. Rome, FAO.
While the consumption of processed foods and food away from home is higher in cities and towns, in terms of consumed value shares, it only declines gradually moving into peri-urban areas; however, there is a more abrupt drop in peri-urban areas of intermediate cities in low-food-budget countries (Figure 26A). Evidence of a smooth and gradual diminishing share along the continuum dispels the notion of a sharp rural–urban divide in the consumption of processed foods.
Looking at low processed and highly processed foods separately, we find that in both sets of countries, highly processed foods account for a small proportion of total consumption (Figure 26B). However, the shares are slightly higher in peri-urban areas of small cities and towns and rural areas of low-food-budget countries compared to the same areas in high-food-budget countries. The shares of highly processed foods are also found to be greater in urban areas than in rural areas, in both sets of countries. The results highlight the penetration of highly processed foods into rural areas, even those living 1 to 2 hours or more from a city or town. Highly processed foods are primarily packaged with extended shelf-life,17 which may enhance their spread to more remote rural areas given their storability.
In both sets of countries, the consumption value shares of low processed foods are higher compared to highly processed foods, but in urban and peri-urban areas of low-food-budget countries the difference is much greater. This is not unlike the pattern seen in other countries with initial higher penetration of low processed rather than highly processed foods.14
However, there is a marked difference in the food consumption shares (at market value) of both low processed and highly processed foods and food away from home between high- and low-food-budget countries. To more clearly see these differences, Figure 27 shows the difference between the food value shares of the two categories of processed foods and food away from home comparing high- and low-food-budget countries.
FIGURE 27 In the 11 countries in Africa, low processed and highly processed food consumption shares are higher across the rural–urban continuum in low-food-budget countries, while shares of food away from home are higher in high-food-budget countries
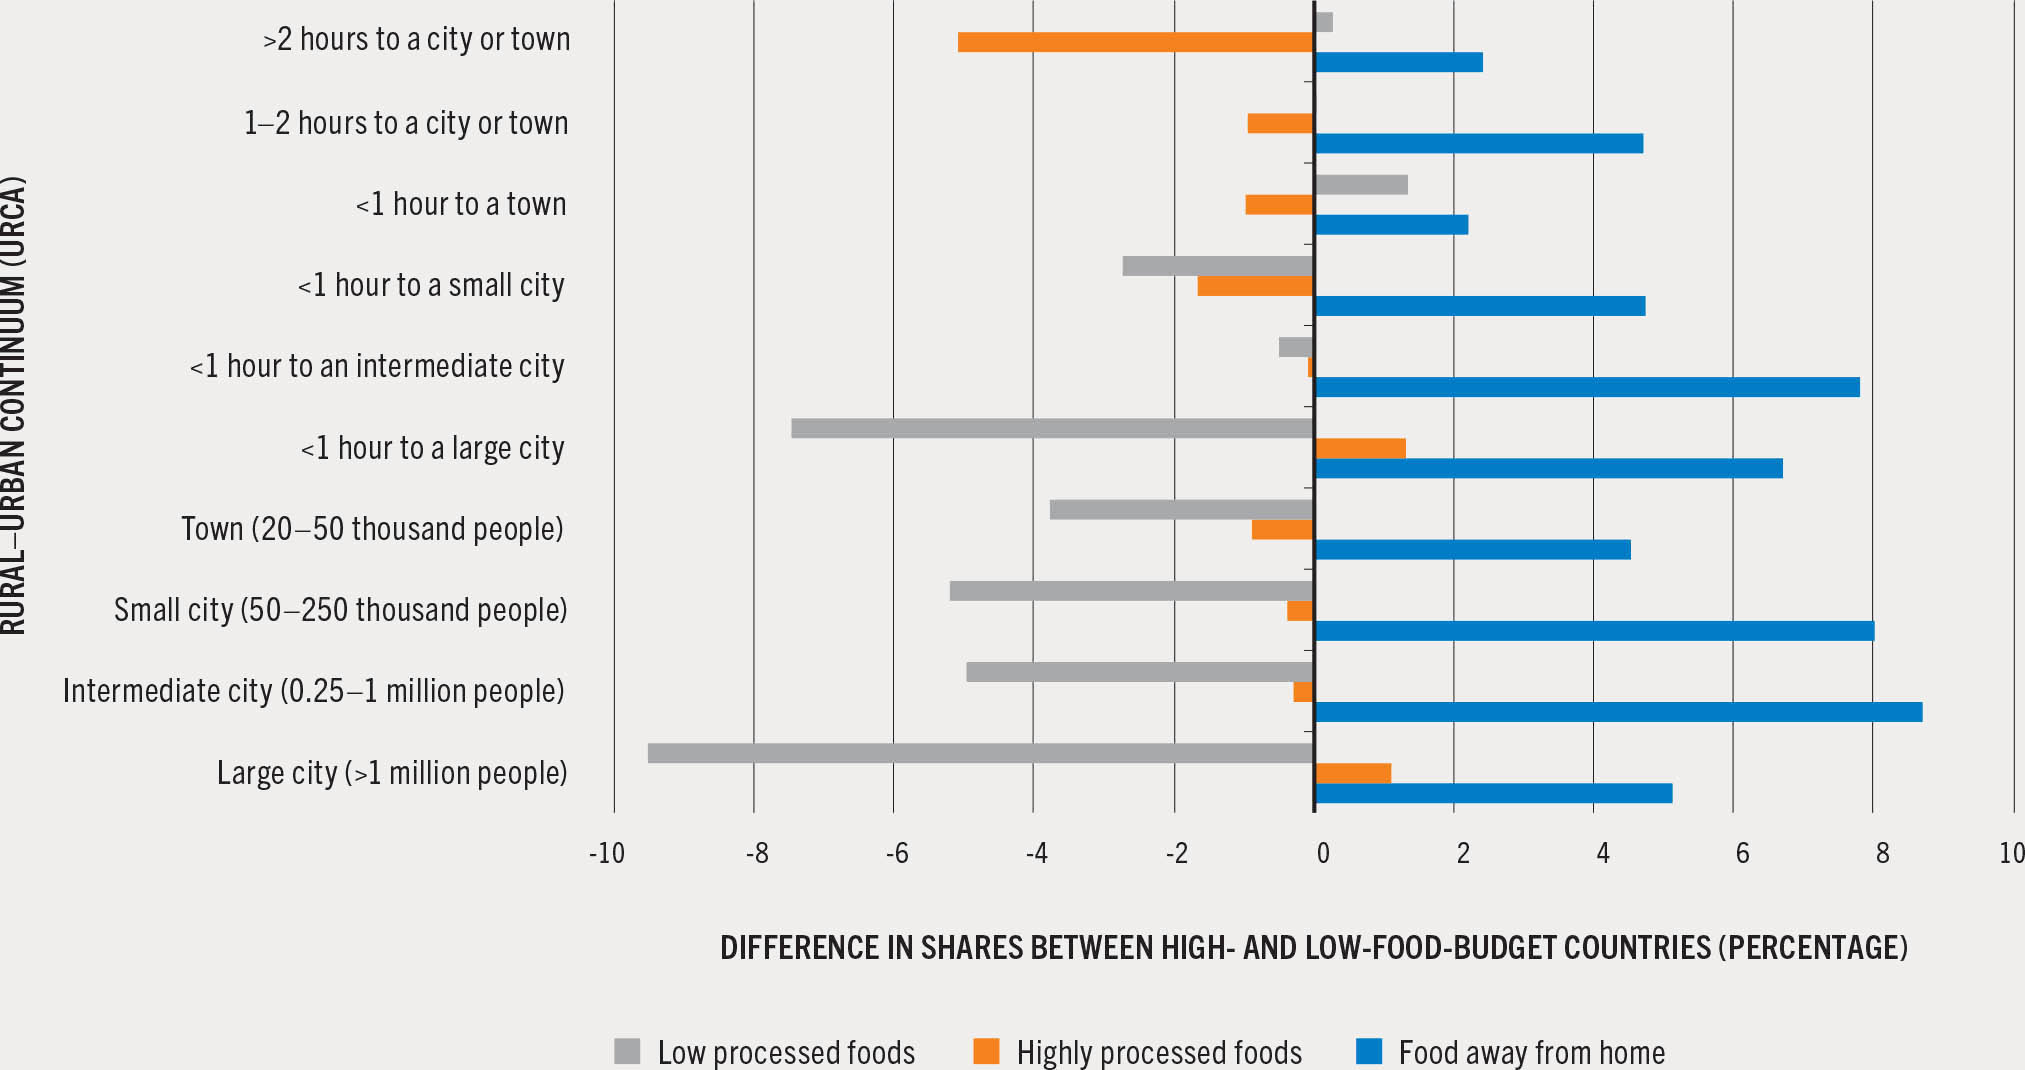
SOURCE: Dolislager, M.J, Holleman, C., Liverpool-Tasie, L.S.O. & Reardon, T. 2023. Analysis of food demand and supply across the rural–urban continuum in selected countries in Africa. Background paper for The State of Food Security and Nutrition in the World 2023. FAO Agricultural Development Economics Working Paper 23-09. Rome, FAO.
In low-food-budget countries, low processed food consumption in urban and peri-urban areas is higher than in high-food-budget countries. Not as high – but still higher in low-food-budget countries – is the share of highly processed foods in all areas, except large cities and their surroundings. This is surprising because, as highlighted earlier, it is expected that highly processed foods would be greater in high-food-budget countries. On the other hand, food away from home is higher as a share of total household food consumption in high-food-budget countries (Figure 27). This could suggest that there is more off-farm employment in rural areas of high-food-budget countries. This makes sense as food away from home is correlated with working outside the home and commuting within cities or from rural to urban areas or other rural areas (see Chapter 3). Such employment patterns emerge with development and urbanization, both correlated with high-food-budget countries.
As was done for food purchases, an econometric analysis was undertaken to look into the determinants (i.e. location effect of each URCA, household income, non-farm employment, etc.) of the share of purchases of highly processed foods as a value share of total household food consumption. Table A7.2 in Annex 7 presents the statistically significant results, of which the key points are highlighted below.
Holding other factors constant, the effects of location across the rural–urban continuum corroborate the descriptive findings: the farther from a large city, the smaller the share of highly processed foods in total household food consumption for high-food-budget countries, except for more remote areas in low-food-budget countries. The finding on the location effect is similar to that observed for the United Republic of Tanzania (not included in this analysis), according to a study using detailed household budget survey data with urban, peri-urban and rural gradations.17 It is also similar to findings for rural and urban areas in Bangladesh, Indonesia, Nepal and Viet Nam.9
The pure effect of income is associated with a higher share of highly processed foods in both country food-budget groups, but with a greater impact in low-food-budget countries (Table A7.2 in Annex 7). This corroborates findings from other recent studies in Africa, for example in Uganda and the United Republic of Tanzania.17 In both high- and low-food-budget countries, more non-farm employment leads to a higher share of highly processed foods in total household food consumption. This finding is particularly true for male non-farm employment, as the effect is found to be statistically significant in 8 out of the 11 countries analysed. The effect for female non-farm employment is similar to that for male non-farm employment in high-food-budget countries, but is not statistically significant in low-food-budget countries.
All other things equal, the primary schooling of the household head is significantly correlated with a greater consumption value share of highly processed foods in only three countries, while the household head being female is correlated with a greater share in most high-food-budget countries, except for a dampening effect in Ethiopia (Table A7.2 in Annex 7). In the former, this is supported by other studies showing that women substitute processed foods for meal preparation to free up time for other household chores, as well as off-farm work.14 But in poorer countries, it could be that women managing the household alone have less time (and therefore less access) to buy these foods. However, these results require further exploration. Finally, larger households have a lower share of highly processed food purchases in some of the high-food-budget countries, whereas the effect is mixed in low-food-budget countries (Table A7.2 in Annex 7). The higher the dependency ratioy in both country food-budget groups, the higher the share of highly processed foods purchased.
Household food consumption by various food groups varies over the rural–urban continuum, driven by patterns of urbanization, income and non-farm employment
Urbanization is implicitly associated with shifts in household food consumption, in which urban households purchase a more varied diet, one that is less dominated by staple foods and comprises a larger variety of foods from other food groups, including more expensive foods such as meat and dairy (see Chapter 3). However, some studies suggest that it is higher income in urban areas, rather than urbanization per se, that is causing these shifts.18 This section provides further analysis of these issues.
All food items are categorized into eight food groups: i) staple foods including cereals, roots, tubers, plantains and their products; ii) pulses, seeds, nuts and their products; iii) animal source foods including milk, eggs, meat, fish, shellfish, insects/grubs and all their products; iv) vegetables and their products; v) fruits and their products; vi) fats and oils; vii) sweets, condiments and beverages; and viii) meals eaten outside the home (food away from home). See Table A5.5 in Annex 5 for definitions of food group aggregates. Given the number of food groups to be analysed, the ten URCA categories are further aggregated into three categories – urban, peri-urban and rural – to facilitate the presentation of some figures (see Table 9).
Looking at household food composition in terms of the value shares of food consumption by food group, a diet transition is clearly occurring across the rural–urban continuum (Table 11). This involves a diversification of diets at the household level, including the consumption of more expensive food items, like animal source foods and fruits. This suggests the transition is also occurring in rural areas, though lagged and to a lesser extent than in urban and peri-urban areas.
TABLE 11In the 11 countries in Africa, a diet transition at the household level is occurring across the rural–urban continuum and in high- and low-food-budget countries – even in rural areas, though lagged and to a lesser extent than in urban and peri-urban areas

SOURCE: Dolislager, M.J, Holleman, C., Liverpool-Tasie, L.S.O. & Reardon, T. 2023. Analysis of food demand and supply across the rural–urban continuum in selected countries in Africa. Background paper for The State of Food Security and Nutrition in the World 2023. FAO Agricultural Development Economics Working Paper 23-09. Rome, FAO.
Interestingly, in this small group of countries in Africa, there are no major differences between high- and low-food-budget countries. This might suggest a convergence in the diet transition occurring across the set of countries. The finding that consumption value shares of non-staple foods are similar in the two food-budget groups is somewhat paradoxical. This could be because in both sets of countries, low-cost non-staple foods – such as vegetables or pulses – are accessible and also desired by households. Another study in Senegal19 found that household expenditure shares were similar in urban and rural areas, but the absolute levels of expenditure were lower in rural areas and among the poor. This may be similar to saying that low-cost pulses figure largely in the diets of the poor. The findings do not negate Bennett’s law,z but make its slope more gradual.
Staple foods as a share of household food consumption in value terms are on average 30 percent (high-food-budget countries) and 28 percent (low-food-budget countries) in urban areas (Figure 28). Note that this share is just slightly above the share of 25 percent in Asian cities.9
FIGURE 28 In the 11 countries in Africa, the share of staple foods represents a minority of total household food consumption in value terms, and rises as income falls across the rural–urban continuum in both high- and low-food-budget countries
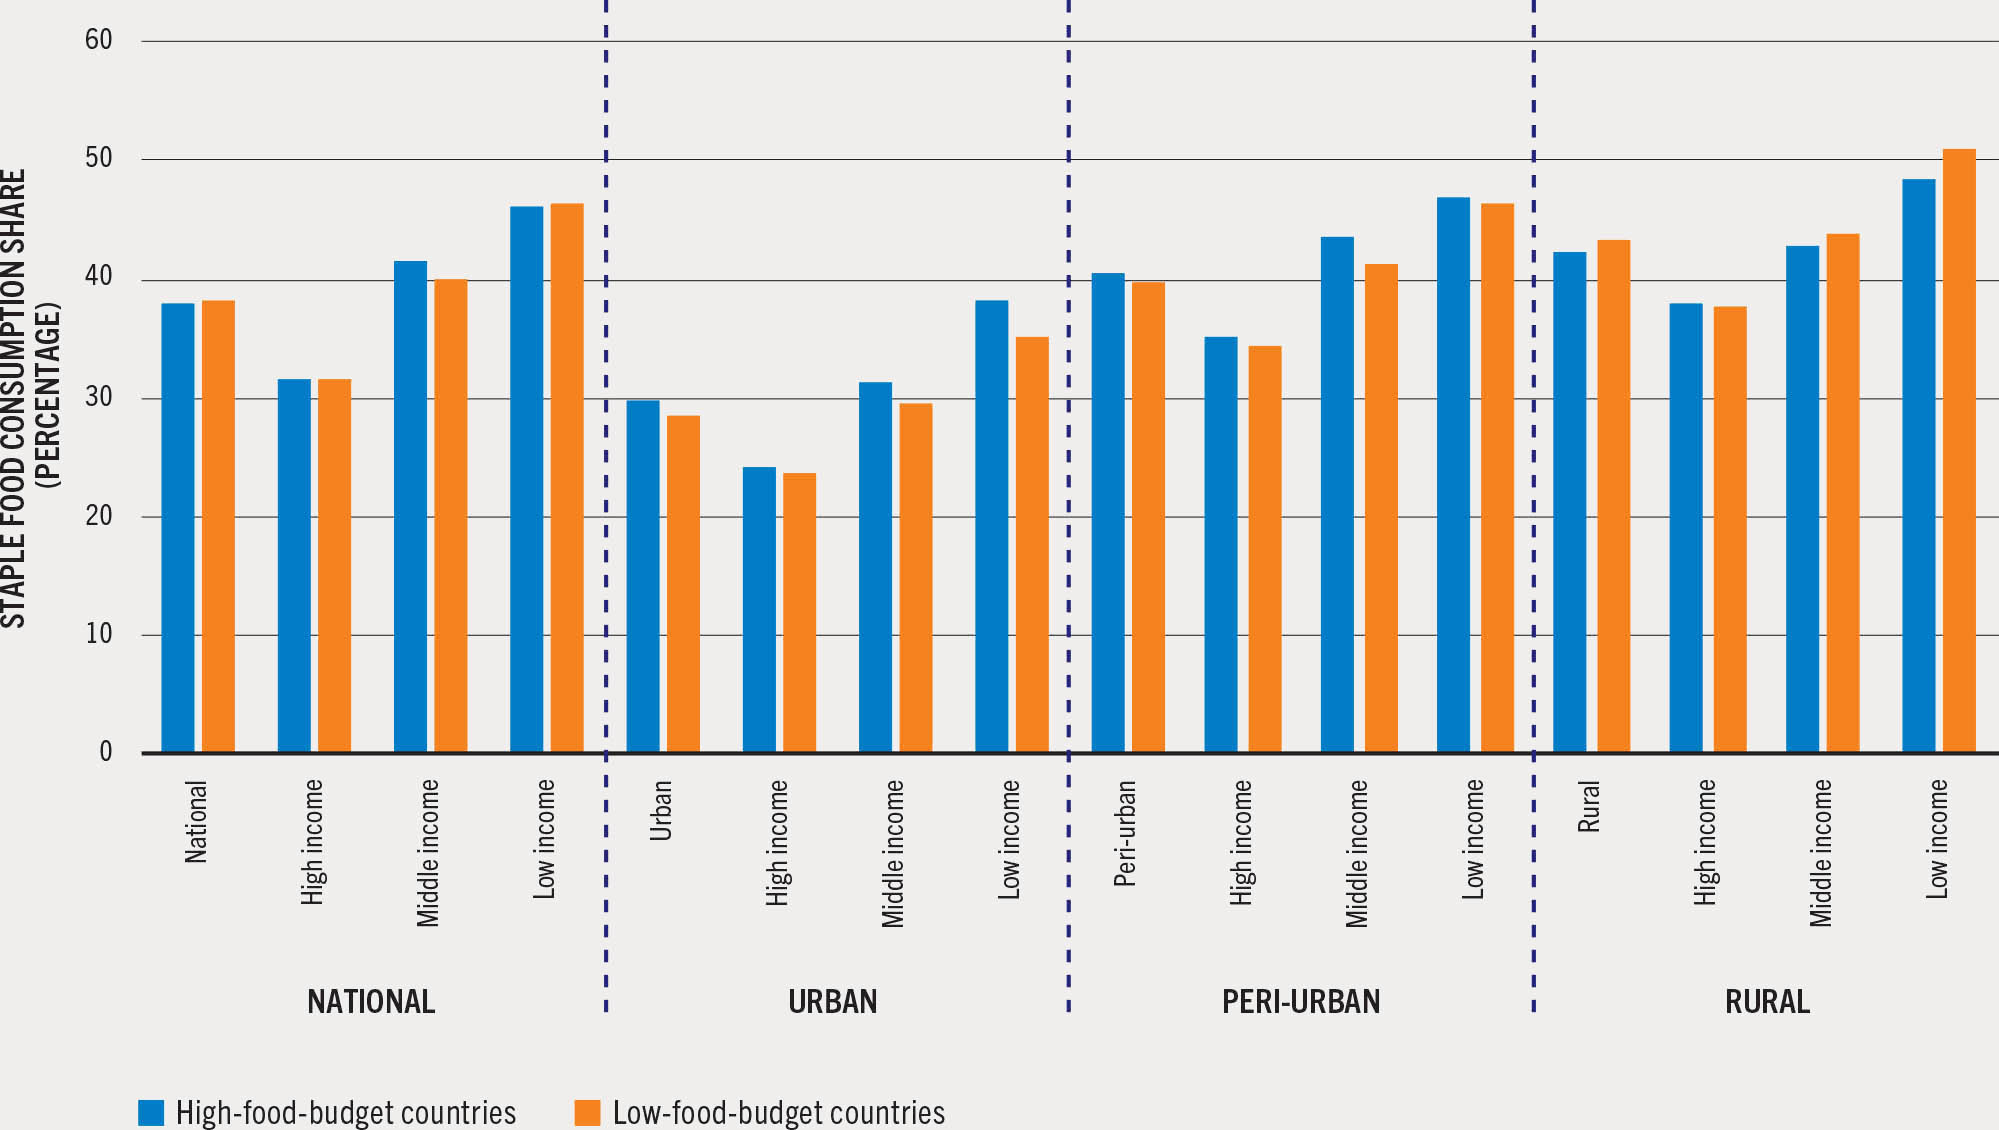
SOURCE: Dolislager, M.J, Holleman, C., Liverpool-Tasie, L.S.O. & Reardon, T. 2023. Analysis of food demand and supply across the rural–urban continuum in selected countries in Africa. Background paper for The State of Food Security and Nutrition in the World 2023. FAO Agricultural Development Economics Working Paper 23-09. Rome, FAO.
Consumption value shares of staple foods, including market-valued own-produced staple foods, are similar in peri-urban and rural areas, but roughly 12 percentage points higher than in urban areas. The average share of staple foods in total houseold food consumption is similar in high- and low-food-budget countries: 41 percent and 40 percent (respectively) in peri-urban areas, and 42 percent and 43 percent (respectively) in rural areas.
As expected, following Bennett’s law, as household income rises the share of staple foods in total household food consumption falls (Figure 28). This holds true across the rural–urban continuum, whether looking at urban, peri-urban or rural aggregate categories (as shown in Figure 28) or at more disaggregated URCA categories (not shown).
Overall, the value shares of staple foods comprise a minority of total household food consumption, not only in urban areas but across the rural–urban continuum. It is striking that the diversification of household food consumption, which is the inverse of dependence on staple foods, is similar in urban areas of both country food-budget groups. Furthermore, the ratio of the shares of staple foods in rural areas to urban areas is nearly the same in high- and low-food-budget countries (1.4 and 1.5, respectively), suggesting an intercountry convergence.
The smaller staple food shares in urban areas are generally offset by larger shares of animal source foods and food away from home (Figure 29A). This is expected, as urbanization is generally associated with urban households procuring more varied foods, including more expensive foods such as meat, but also eating outside the home more often. With this analysis, however, as previously mentioned, it is not possible to assess the types of foods consumed away from home, whether they contribute to diversity, and their level of processing.
FIGURE 29 In the 11 countries in Africa, animal source foods and food away from home substitute staple foods, moving from rural to urban areas

SOURCE: Dolislager, M.J, Holleman, C., Liverpool-Tasie, L.S.O. & Reardon, T. 2023. Analysis of food demand and supply across the rural–urban continuum in selected countries in Africa. Background paper for The State of Food Security and Nutrition in the World 2023. FAO Agricultural Development Economics Working Paper 23-09. Rome, FAO.
In urban areas, on average across the countries analysed, animal source food consumption value shares (which include milk, eggs, meat, fish, shellfish and insects) are 40 percent higher than in peri-urban areas and 44 percent higher than in rural areas. Looking at low-food-budget countries, the share in urban areas is 1.5 times higher than in peri-urban areas and 1.6 times higher than in rural areas. For high-food-budget countries, the differences are smaller: urban shares are 1.4 times higher than peri-urban and rural (not shown here, see Figure A7.1A in Annex 7). There is also a notable decrease in value shares of pulses, seeds and nuts in urban areas compared to peri-urban areas and rural areas (40 percent and 47 percent lower than in peri-urban and rural areas, respectively) (Figure 29A). This finding is typical, as these items are cheaper sources of nutrient-rich foods, but tend to be supplanted by animal source foods (if only by milk in partially vegetarian countries such as India) as people’s incomes increase.
Animal source foods and food away from home increasingly substitute staple foods, moving from rural to urban areas across the continuum
Across all countries, shares of food away from home are higher in urban areas, and decline steeply moving to peri-urban and rural areas (Figure 29). On average, shares are 1.6 times higher in urban areas than in peri-urban areas, and 2.6 times higher than in rural areas. This pattern is stronger in low-food-budget countries, with urban shares 2.4 times higher than in peri-urban areas, and 3.2 times higher than in rural areas (see Figure A7.1B in Annex 7).
A more disaggregated look at the consumption value shares by food group shows that on average across all countries, there is no abrupt rural–urban divide across the continuum (Figure 29B). Again, this is a surprise, as it is generally assumed there is a marked difference between urban and rural areas. Moving across the continuum from urban to rural areas (Figure 29B), there is an increasing share of staple foods and pulses, seeds and nuts, and a decreasing share of animal source foods and food away from home. In contrast, shares for vegetables, fruits, and fats and oils are fairly uniform across the rural–urban continuum. Although there are some variations, sweets, condiments and beverages also are uniform (see Table 11 for disaggregated values by high- and low-food-budget countries).
An econometric analysis of the determinants of consumption of the different food groups provides further insights. For example, the determinants of consumption of animal source foods and food away from home corroborate the descriptive trends. Increases in the share of consumption of animal source foods in household food consumption are mainly driven by statistically significant increases in income (see Table A7.3 in Annex 7).
For the shares of food away from home, the effect of income is mixed across high- and low-food-budget countries, but it shows an average higher consumption share as income increases when all countries are pulled together (Table A7.4 in Annex 7). However, in both country food-budget groups, more male non-farm employment leads to a higher share of food away from home and the effect is higher in high-food-budget countries than in low-food-budget countries. This may reflect employment that is more spatially dispersed, with longer commutes, and thus a greater need for food away from home. It may also be the case that in some high-food-budget countries, restaurants and vendors (i.e. food services) that prepare meals (for food away from home) are more plentiful.
The location effect across the rural–urban continuum is present and statistically significant in low-food-budget countries. In this case, the consumption value share of food away from home is much greater in large cities than in towns, but decreases incrementally in peri-urban areas the larger the size of the closest city, and decreases moving from towns to rural areas, with the largest decrease occurring in areas 1 to 2 hours from any urban centre. The location effect is statistically significant for fewer URCA categories in high-food-budget countries. It shows a greater consumption of food away from home in large and intermediate cities compared to towns, and a decrease in rural areas, with the largest drop occurring in areas more than 2 hours from any urban centre. These results corroborate the descriptive findings: the larger the urban city, the higher the share of food away from home in total consumption; the greater the distance from a large city, the smaller the share (Table A7.4 in Annex 7). The consumption of food away from home is often linked to commuting for work; therefore these patterns reflect how much farther workers have to commute from home in cities compared to rural areas.
In contrast to animal source foods and food away from home, the analysis of the determinants of the share of vegetables in total household food consumption suggests that this consumption is driven more by access and availability than by income. The effect of income on vegetable consumption is mixed, but overall negative and statistically significant, indicating a reduction in vegetable consumption shares as income increases (Table A7.5 in Annex 7).
For household consumption, shares of animal source foods are driven by income, while shares of fruits and vegetables are determined by access and availability.
On the other hand, considering all countries together, there are statistically significant location effects on the share of vegetables in total household food consumption across the rural–urban continuum – after controlling for income. Large, intermediate and small cities and areas less than 1 hour from large and intermediate cities have higher shares of vegetable consumption than do towns (Table A7.5 in Annex 7). For low-food-budget countries, there is also a notable decrease in the share of vegetable consumption in rural areas. These findings may reflect the presence of major horticultural commercial zones near cities, or in well-watered areas near highways and rivers, in both low- and high-food-budget countries.
In both high- and low-food-budget countries, the effect of non-farm employment is mostly non-significant (Table A7.5 in Annex 7). However, if the household is headed by a woman, there is a positive effect on the share of vegetable consumption in both country food-budget groups. Since the effect of income is taken into consideration at the same time, this can be interpreted as an indication that female diet choices for households make a difference, as women, for example, choose food with greater nutrient and vitamin content.

