


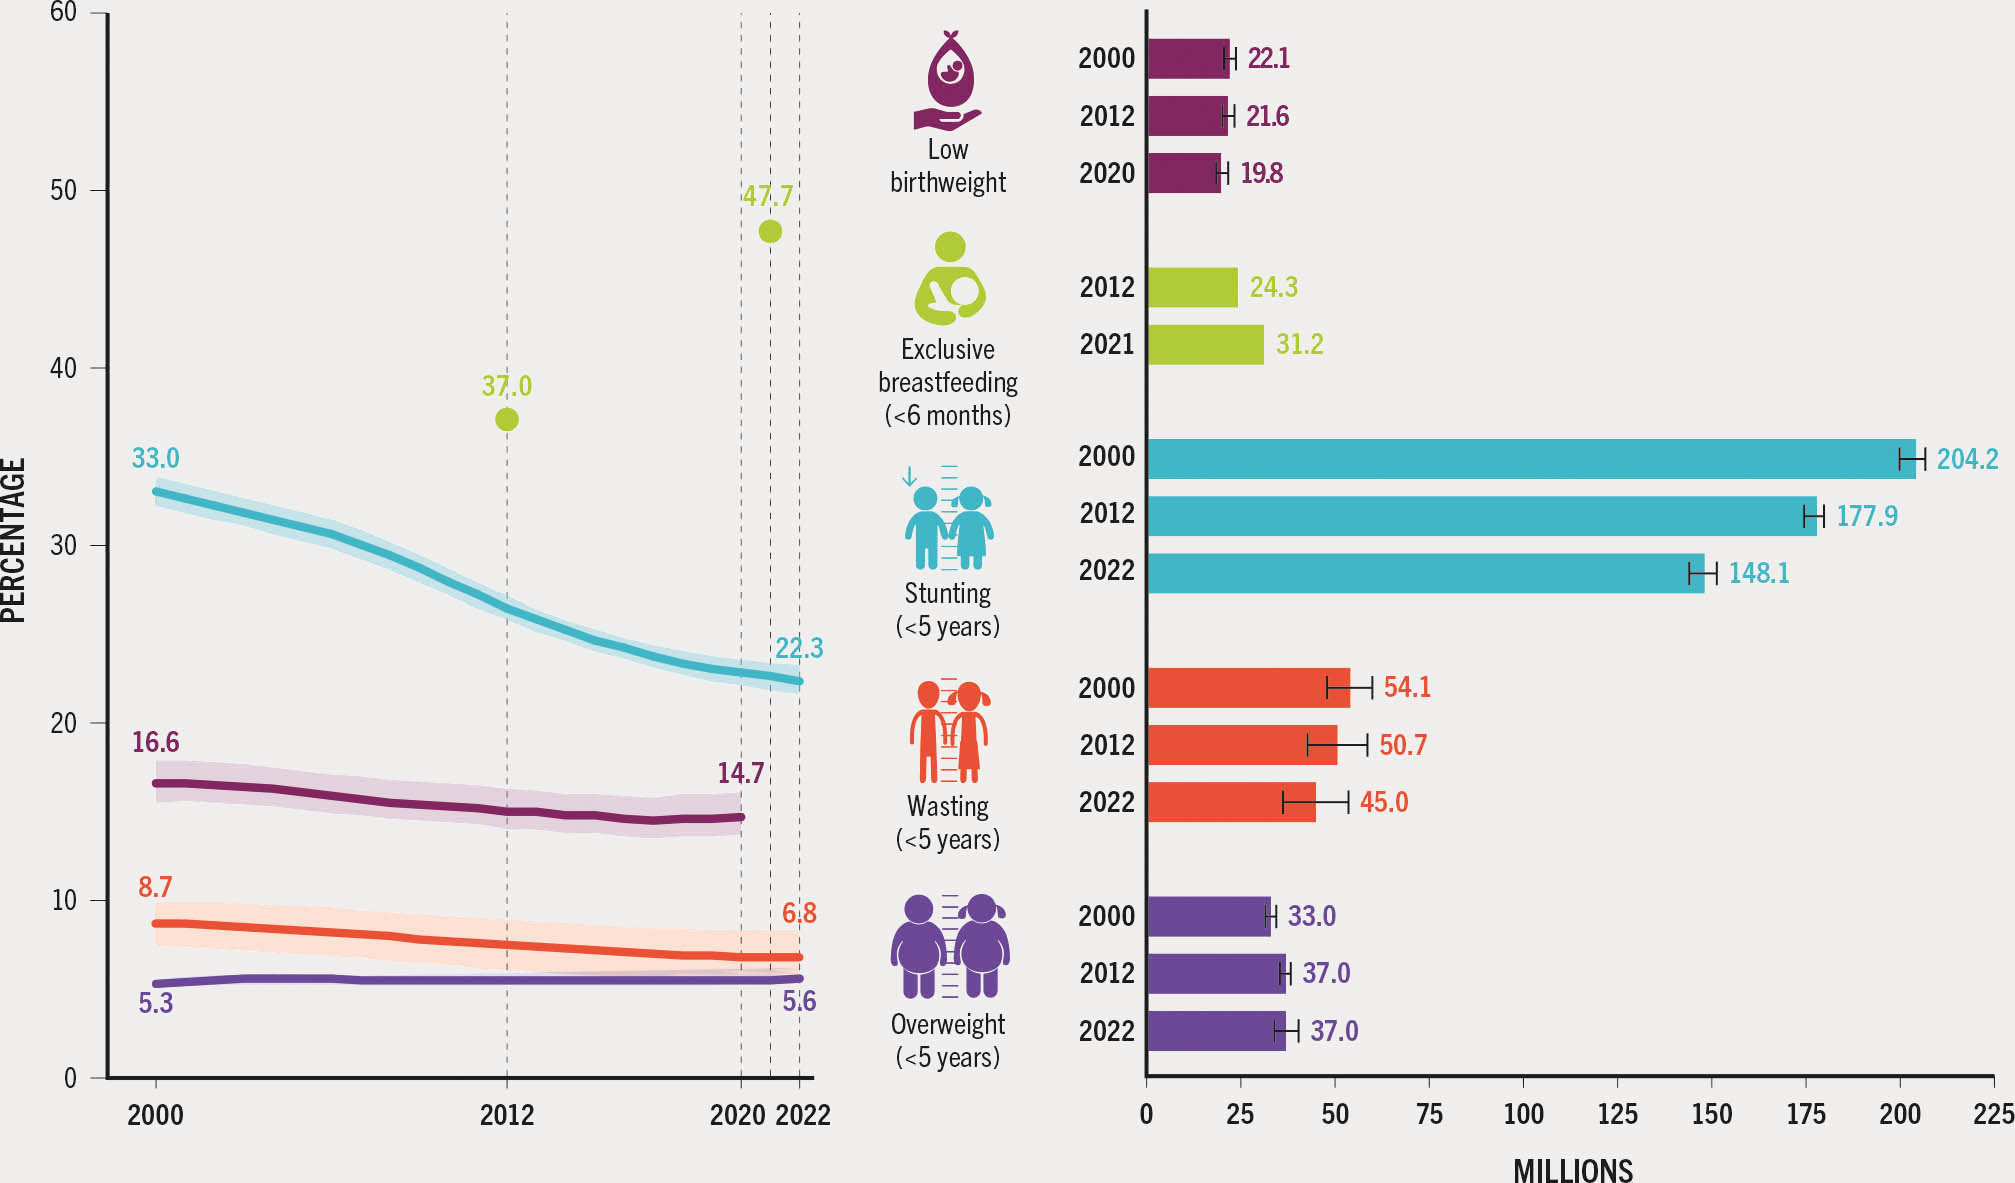
- ➔ Worldwide in 2022 among children under five years of age, an estimated 148.1 million (22.3 percent) were stunted, 45 million (6.8 percent) were wasted and 37 million (5.6 percent) were overweight.
- ➔ Global stunting prevalence was 1.6 times higher and wasting prevalence 1.4 times higher in rural versus urban areas. The prevalence of overweight was only slightly higher in urban children (5.4 percent) compared to rural children (3.5 percent).
- ➔ There has been steady progress in reducing stunting since 2012, but the world is still not on track to achieve the 2030 target of 13.5 percent (50 percent reduction in the number of children with stunting from the baseline). In the ten years since 2012, the number of children with stunting declined by nearly 30 million.
- ➔ Reduction in wasting is making some progress but global prevalence is more than twice the 2030 target. Wasting among children was highest in low- and lower-middle-income countries (94 percent of the global burden).
- ➔ Globally, the majority of overweight children (77 percent) lived in lower-middle- and upper-middle-income countries in 2022. In terms of progress towards the 2030 target of less than 3 percent prevalence, no regions were on track and only Northern America and Europe made some progress towards the target.
- ➔ Globally, there has been no significant change in low birthweight over the last two decades – 16.6 percent in 2000 compared with 14.7 percent in 2020 – and no region is on track to attain the 2030 target of a 30 percent reduction since the 2012 baseline. Data gaps present a challenge to the global monitoring of low birthweight, as nearly one in three newborns in the world were not weighed at birth in 2020.
- ➔ Steady progress has been made on exclusive breastfeeding, with 47.7 percent of infants under six months of age exclusively breastfed worldwide in 2021, up from 37.0 percent in 2012. An estimated 75 percent of exclusively breastfed infants live in low- or lower-middle-income countries.
- ➔ Conflict, climate change and rising food prices, along with the persisting effects of the COVID-19 pandemic, all threaten progress towards achieving the 2030 global nutrition targets. Coordinated efforts are needed to eliminate malnutrition in all its forms.
The importance of nutrition and reporting on the Sustainable Development Goals
Nutrition is mentioned specifically in SDG 2 but it is central to the achievement of all 17 SDGs, specifically those related to health, education, gender equality and the climate.32 This section presents an assessment of global and regional levels and trends for global nutrition targets. There are updates on five of the six nutrition targets initially endorsed by the World Health Assembly (WHA) in 2012 to be achieved by 2025, for which extended 2030 targets were subsequently proposed by the World Health Organization (WHO) and the United Nations Children’s Fund (UNICEF). Four out of the six indicators were also selected to monitor progress towards SDG Target 2.2, namely stunting, wasting and overweight in children under five years of age, and anaemia in women aged 15 to 49 years. A seventh target to halt the rise in adult obesity was adopted by the WHA as part of the Global Action Plan for the Prevention and Control of NCDs in 2013. Only the indicators for stunting, wasting, overweight, exclusive breastfeeding and low birthweight will be presented in this edition of the report, as updated data were not available for anaemia in women aged 15 to 49 years and adult obesity.
Global trends and burden of malnutrition
Conflict, climate change and the enduring secondary effects of the COVID-19 pandemic continue to affect malnutrition, birthweights and caring practices like exclusive breastfeeding. The 2022 edition of this report presented multiple pathways for the pandemic to impact child nutrition along with potential risks stemming from the war in Ukraine. Although the effects of the current crises on malnutrition are not yet fully reflected in the updates presented in this edition of the report, due either to data sparsity or to the long-term impact of some of the nutritional outcomes, negative impacts on various forms of malnutrition are expected at the global level. Any potential global consequences of the war in Ukraine on malnutrition are also yet to be measured comprehensively. The global trends in prevalence and absolute numbers for five nutrition indicators are summarized in Figure 12.
FIGURE 12 Stunting in children under five years of age and exclusive breastfeeding have improved and some progress has been made on wasting, while low birthweight and overweight in children under five years of age have not changed
SOURCES: Data for stunting, wasting and overweight are based on UNICEF, WHO & World Bank. 2023. UNICEF-WHO-World Bank: Joint child malnutrition estimates - Levels and trends (2023 edition). [Cited 24 April 2023]. https://data.unicef.org/resources/jme-report-2023, www.who.int/teams/nutrition-and-food-safety/monitoring-nutritional-status-and-food-safety-and-events/joint-child-malnutrition-estimates, https://datatopics.worldbank.org/child-malnutrition; data for exclusive breastfeeding are based on UNICEF. 2022. Infant and young child feeding. In: UNICEF. [Cited 6 April 2023]. https://data.unicef.org/topic/nutrition/infant-and-young-child-feeding; data for low birthweight are from UNICEF & WHO. 2023. Low birthweight joint estimates 2023 edition. [Cited 12 July 2023]. https://data.unicef.org/topic/nutrition/low-birthweight; www.who.int/teams/nutrition-and-food-safety/monitoring-nutritional-status-and-food-safety-and-events/joint-low-birthweight-estimates. The burden estimates by indicator are based on different denominators including children under five years of age for stunting, wasting and overweight, children under six months of age for exclusive breastfeeding and live births for low birthweight. Population data are based on United Nations Population Division. 2022. World Population Prospects 2022. [Cited 27 April 2023]. https://population.un.org/wpp
The latest estimate for low birthweight reveals that 14.7 percent of newborns (19.8 million) were born with low birthweight (less than 2 500 g) in 2020, a non-significant decline from 16.6 percent (22.1 million) in 2000. Infants born weighing less than 2 500 g are approximately 20 times more likely to die than those with adequate birthweight,33 and those who survive face long-term development and health consequences, including a higher risk of stunting, a diminished intelligence quotient, and increased risk of obesity and diabetes as adults.34
Optimal breastfeeding practices, including exclusive breastfeeding for the first six months of life, are critical for child survival and the promotion of health and cognitive development.35 Globally, the prevalence of exclusive breastfeeding among infants under six months of age rose from 37.0 percent (24.3 million) in 2012 to 47.7 percent (31.2 million) in 2021. Worldwide, over half of all infants under six months of age do not receive the protective benefits of exclusive breastfeeding.
Stunting, the condition of being too short for one’s age, is a marker for longer-term chronic malnutrition. It is caused by a combination of nutritional and other factors that simultaneously undermine the physical and cognitive development of children and increase their risk of dying from common infections. Stunting and other forms of undernutrition early in life may also predispose children to overweight and NCDs later in life.36 Globally, the prevalence of stunting among children under five years of age has declined steadily, from an estimated 33.0 percent (204.2 million) in 2000 to 22.3 percent (148.1 million) in 2022.
Child wasting is a life-threatening condition caused by insufficient nutrient intake, poor nutrient absorption and/or frequent or prolonged illness. Affected children are dangerously thin, with weakened immunity and a higher risk of mortality.37 The prevalence of wasting among children under five years of age declined non-significantly from 8.7 percent in 2000 to 6.8 percent in 2022. The estimated number of children with wasting declined from 54.1 million in 2000 to 45.0 million in 2022, but it is important to note that these are point estimates and not representative of the cumulative number of cases of wasting over the year. The global prevalence-based estimates of children under five years of age affected by wasting from the UNICEF-WHO-World Bank: Joint child malnutrition estimates should be considered underestimates of the annual burden. Wasting is an acute condition that can change rapidly and is affected by seasonal changes in many contexts.38, 39 This makes reliable national trends over time challenging to estimate and interpret.
Children who are overweight or obese face both immediate and potentially long-term health impacts. Immediate impacts include respiratory difficulties, increased risk of fractures, hypertension, early markers of cardiovascular disease, insulin resistance and psychological effects.40 Affected individuals also have a higher risk of NCDs later in life. Child overweight has been on the rise in many countries, hastened by increasingly inadequate levels of physical activity and increased access to highly processed foods, which tend to be high in energy, fats, free sugars and/or salt.23 Globally, the prevalence of overweight among children under five years of age showed a non-significant increase from 5.3 percent (33.0 million) in 2000 to 5.6 percent (37.0 million) in 2022. The personal, community and societal costs of overweight and obesity are heavy and are increasing globally.41
Nutrition across country income groups
The global burden of malnutrition varies substantially across country income groups and over time. These analyses examine the distribution of the burden based on the latest classification of a country’s income group.
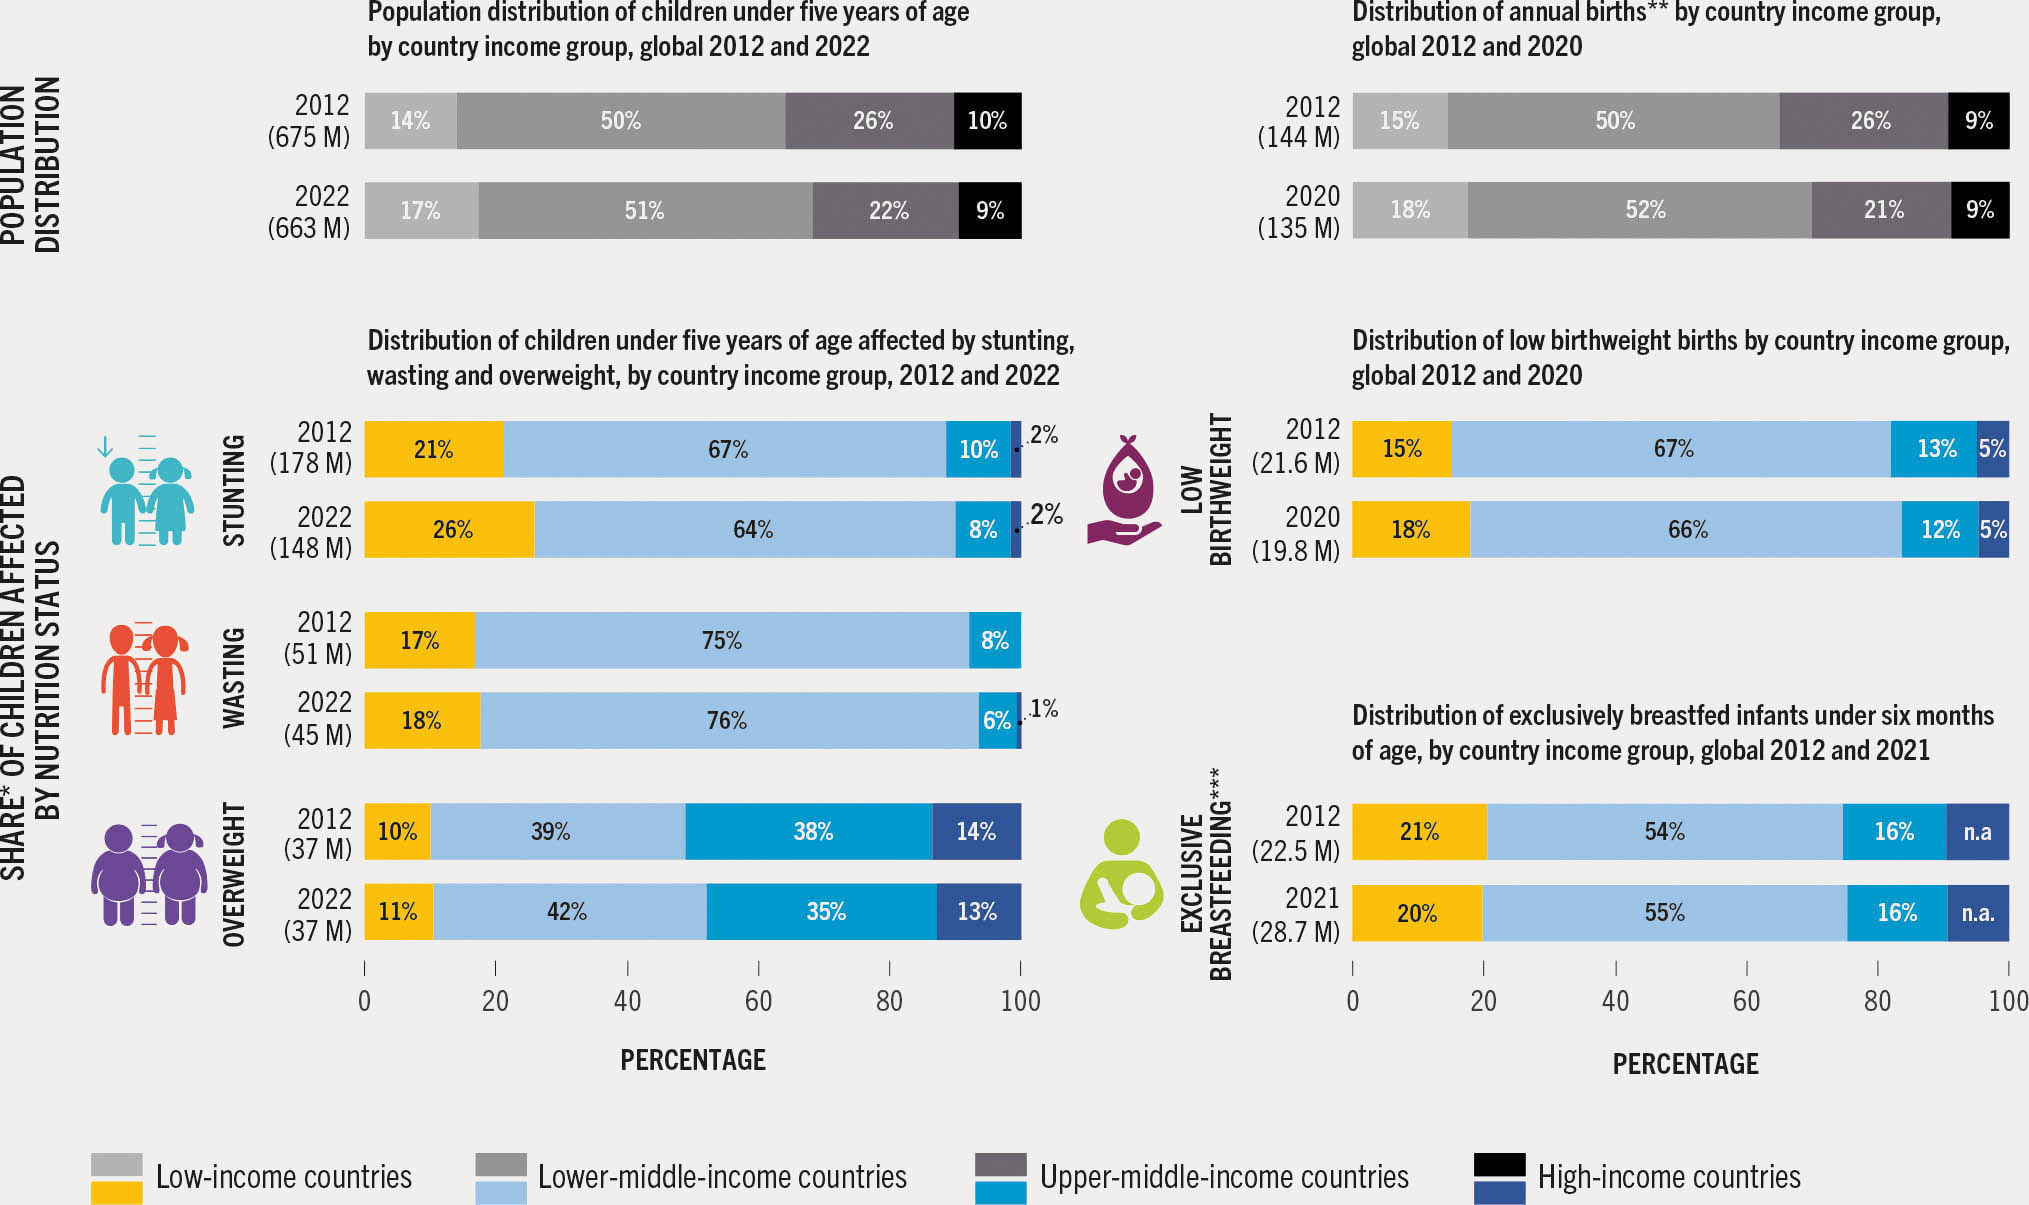
The distributions of the global burden for five nutrition indicators by country income group are presented in Figure 13. For each indicator, the distributions in 2012 and in the year for which the most recent data are available are presented to show changes over time.
FIGURE 13 Low- and lower-middle-income countries bear the greatest burden of stunting, wasting and low birthweight, but also have the largest proportion of exclusively breastfed children; most overweight children live in lower-middle- or upper-middle-income countries
SOURCES: Data for stunting, wasting and overweight are based on UNICEF, WHO & World Bank. 2023. UNICEF-WHO-World Bank: Joint child malnutrition estimates - Levels and trends (2023 edition). [Cited 24 April 2023]. https://data.unicef.org/resources/jme-report-2023, www.who.int/teams/nutrition-and-food-safety/monitoring-nutritional-status-and-food-safety-and-events/joint-child-malnutrition-estimates, https://datatopics.worldbank.org/child-malnutrition; data for exclusive breastfeeding are based on UNICEF. 2022. Infant and young child feeding. In: UNICEF. [Cited 6 April 2023]. https://data.unicef.org/topic/nutrition/infant-and-young-child-feeding; data for low birthweight are from UNICEF & WHO. 2023. Low birthweight joint estimates 2023 edition. [Cited 12 July 2023]. https://data.unicef.org/topic/nutrition/low-birthweight; www.who.int/teams/nutrition-and-food-safety/monitoring-nutritional-status-and-food-safety-and-events/joint-low-birthweight-estimates. Population data are based on United Nations Population Division. 2022. World Population Prospects 2022. [Cited 27 April 2023]. https://population.un.org/wpp
LICs and LMICs together carried the brunt of the low birthweight burden among newborns in both 2012 and 2020 – a total of 84 percent of the global burden of low birthweight in 2020 – while the two country income groups together represented only 70 percent of global annual births. Overall, the distribution of the burden across income groups remained similar between 2012 and 2020. The proportion of low birthweight in LICs increased from 15 percent to 18 percent, in parallel with the fastest global population growth.
Worldwide, the largest proportion of exclusively breastfed infants live in LICs or LMICs, and the combined estimate did not change from 2012 to 2021 (75 percent). The greatest proportion of exclusively breastfed children is found in LMICs (55 percent), while these countries represent only 52 percent of the overall target population. For HICs, there were insufficient data to examine the portion of exclusively breastfed infants; thus, the proportional contribution of HICs to the global total is presented as “estimates not available” in Figure 13.
The proportion of stunting in children under five years of age increased in LICs from 21 percent in 2012 to 26 percent in 2022, while the proportion of children under five years of age in these countries increased from 14 percent to 17 percent. For LICs and LMICs combined, the proportion of stunted children increased from 88 percent in 2012 to 90 percent in 2022, while these country income groups only represented 64 percent of all children under five years of age globally in 2012 and 68 percent in 2022.
As they do for low birthweight and stunting, LICs and LMICs also bear the greatest burden of wasting. These groups comprised a combined total of 92 percent in 2012 and 94 percent in 2022 of all wasted children under five years of age, despite representing only 68 percent of the global population under five years of age in 2022.
The proportion of overweight children in LICs and LMICs combined increased from 49 percent in 2012 to 53 percent in 2022. While these changes were marginal, they illustrate the rising threats of overweight and obesity among populations of lower country income groups. The distribution across country income groups of the burden of overweight among children under five years of age changed marginally between 2012 and 2022, with a small increase in the number of overweight children residing in LMICs and a small decline in numbers of overweight children in UMICs. The majority of overweight children (77 percent) live in LMICs and UMICs.
The analysis presented indicates that LICs and LMICs are home to the majority of infants who benefit from exclusive breastfeeding. It also highlights that LICs and LMICs combined carry the greatest burden for low birthweight, stunting, wasting and overweight.
Progress towards ending all forms of malnutrition by 2030
Global progress
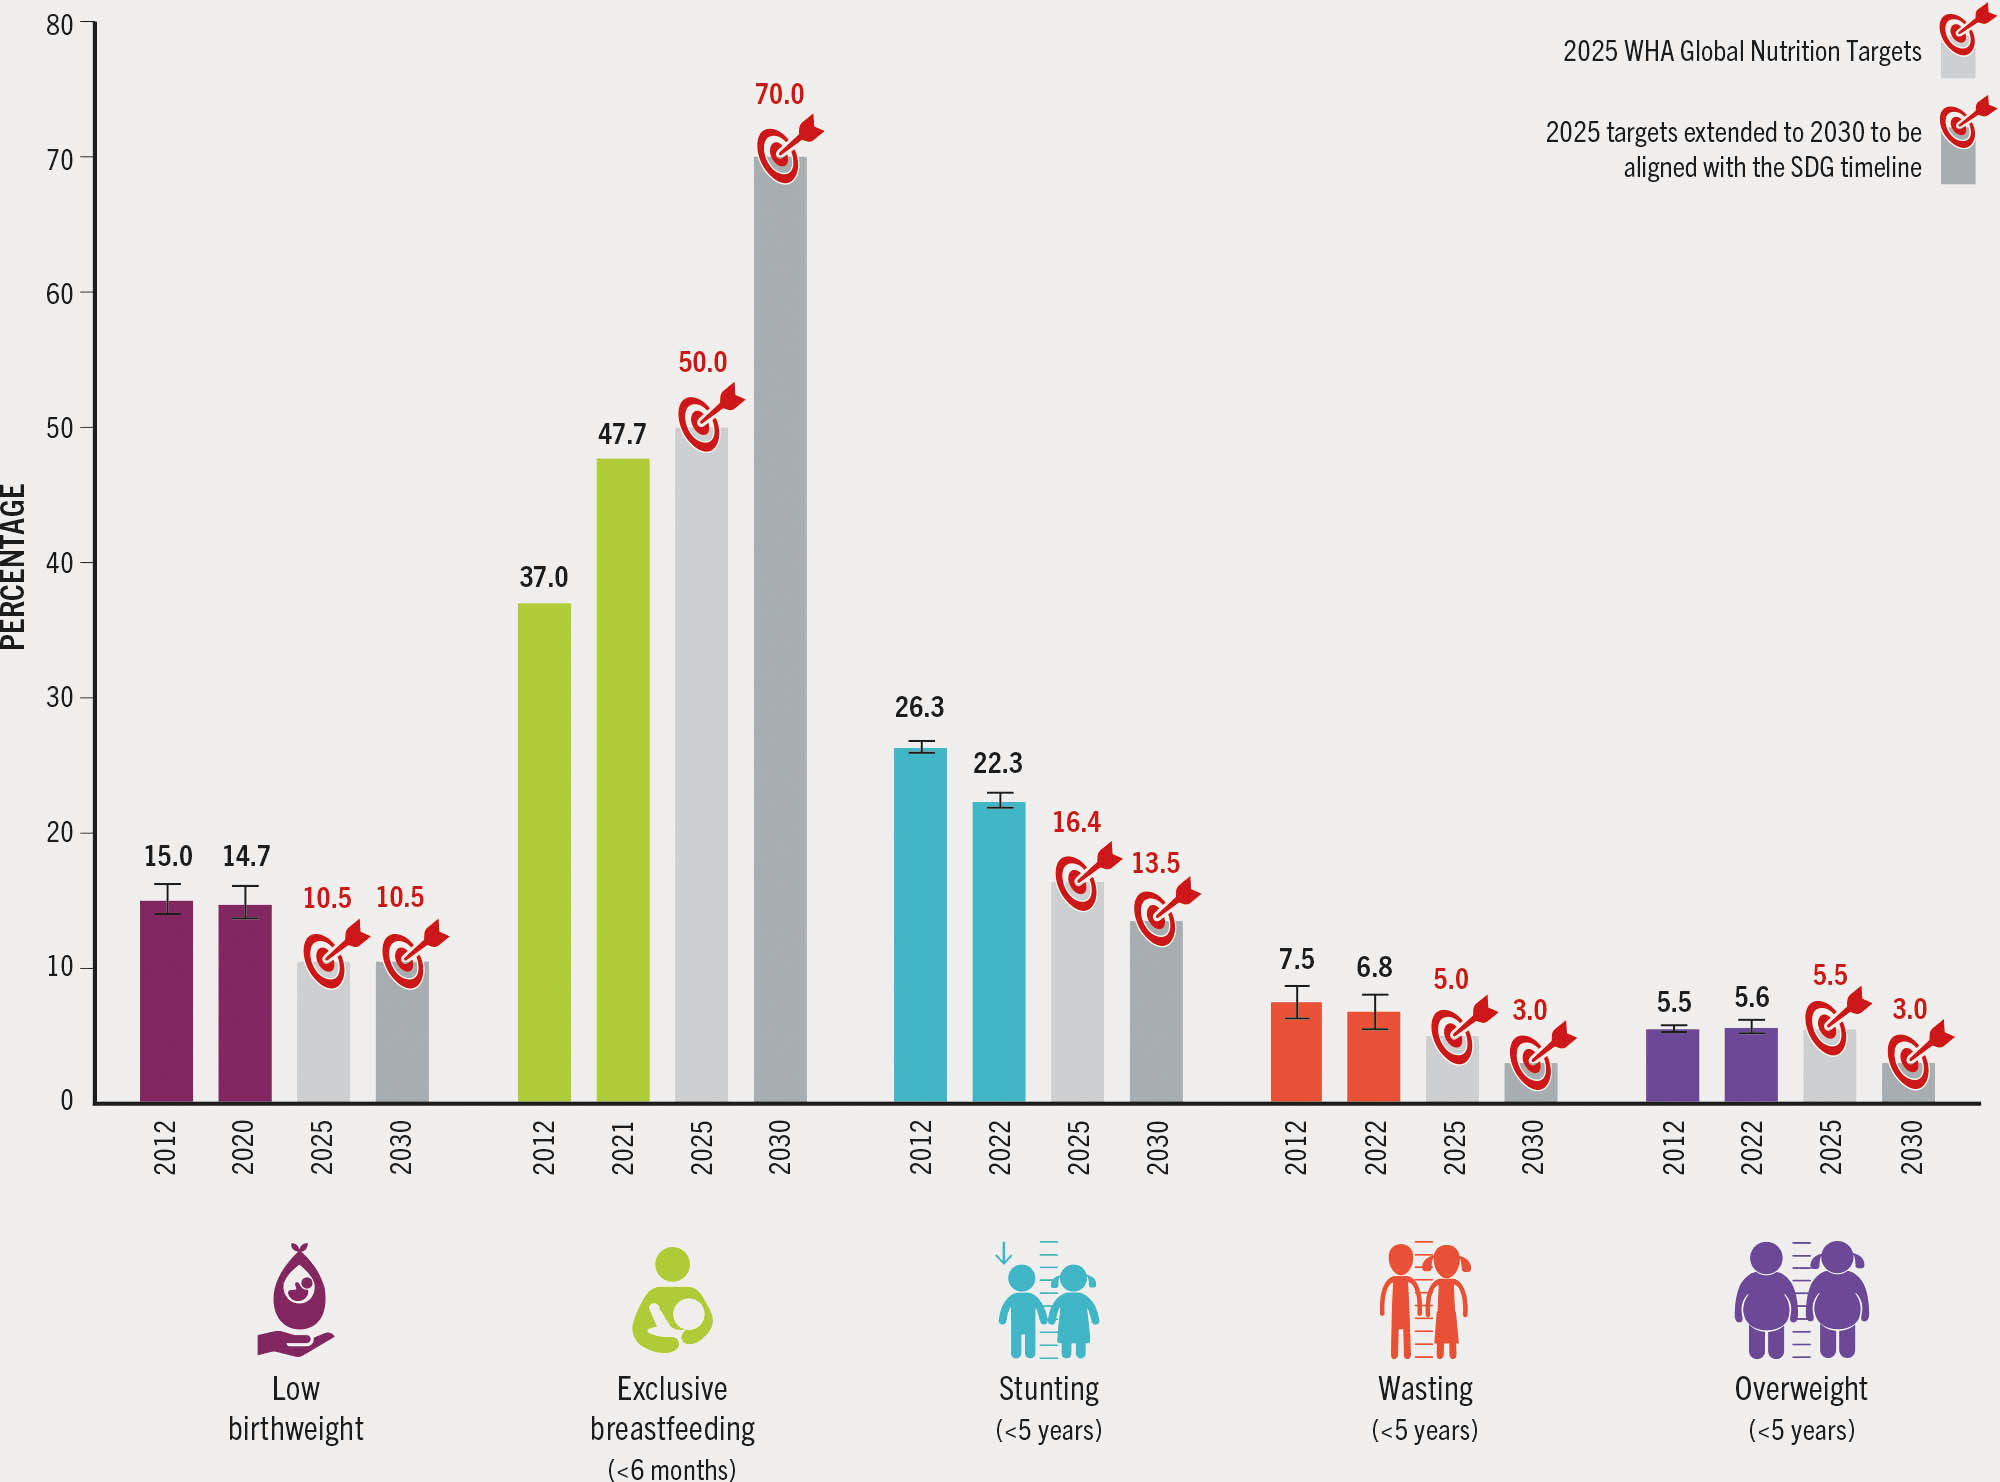
Global progress towards the five nutrition 2030 targets for which indicators have been updated is summarized in Figure 14. The 2020 low birthweight prevalence of 14.7 percent has not declined quickly enough to be on track for the 2030 target of a 30 percent reduction from the 2012 baseline. The available low birthweight data suffer from data quality issues, especially among countries that are most likely to have high prevalence, and nearly one in three newborns in the world were not weighed at birth in 2020. Improvements in low birthweight data quality and representativeness are needed to assess the severity and magnitude of the problem more reliably.
FIGURE 14 THE GLOBAL TRENDS IN STUNTING, WASTING, EXCLUSIVE BREASTFEEDING AND LOW BIRTHWEIGHT MUST BE ACCELERATED, WHILE FOR OVERWEIGHT IN CHILDREN THEY WILL HAVE TO BE REVERSED, TO ACHIEVE THE 2030 GLOBAL NUTRITION TARGETS
SOURCES: Data for stunting, wasting and overweight are based on UNICEF, WHO & World Bank. 2023. UNICEF-WHO-World Bank: Joint child malnutrition estimates - Levels and trends (2023 edition). [Cited 24 April 2023]. https://data.unicef.org/resources/jme-report-2023, www.who.int/teams/nutrition-and-food-safety/monitoring-nutritional-status-and-food-safety-and-events/joint-child-malnutrition-estimates, https://datatopics.worldbank.org/child-malnutrition; data for exclusive breastfeeding are based on UNICEF. 2022. Infant and young child feeding. In: UNICEF. [Cited 6 April 2023]. https://data.unicef.org/topic/nutrition/infant-and-young-child-feeding; data for low birthweight are from UNICEF & WHO. 2023. Low birthweight joint estimates 2023 edition. [Cited 12 July 2023]. https://data.unicef.org/topic/nutrition/low-birthweight; www.who.int/teams/nutrition-and-food-safety/monitoring-nutritional-status-and-food-safety-and-events/joint-low-birthweight-estimates. The targets are drawn from: UNICEF & WHO. 2017. Methodology for monitoring progress towards the global nutrition targets for 2025 – technical report. New York, USA and Geneva, Switzerland. https://data.unicef.org/resources/methodology-for-monitoring-progress-towards-the-global-nutrition-targets-for-2025; and UNICEF & WHO. 2019. The extension of the 2025 Maternal, Infant and Young Child nutrition targets to 2030. New York, USA and Geneva, Switzerland. https://data.unicef.org/resources/who-unicef-discussion-paper-nutrition-targets
The proportion of exclusively breastfed infants under six months of age increased from 37.0 percent in 2012 to 47.7 percent in 2021. Although this is close to the 50 percent target for 2025, the world is not on track to achieve the 2030 target of at least 70 percent. To achieve this target, sustained investment is needed in effective interventions that promote the adoption and continuation of exclusive breastfeeding (such as adequate paid maternity leave and workplace policies to ensure nearby access to quality childcare, breastfeeding breaks and dedicated nursing spaces), along with greater protection and support for breastfeeding in emergency contexts. Enactment and enforcement of the International Code of Marketing of Breastmilk Substitutes,42 institutionalization of the Baby-friendly Hospital Initiative,43 and scaling up of antenatal and postnatal breastfeeding counselling will also help countries to reach their individual targets.
Stunting in children under five years of age decreased from 26.3 percent in 2012 to 22.3 percent in 2022. To be on track for the target of a 13.5 percent stunting prevalence in 2030, however, the prevalence needed to reach 18.2 percent in 2022. Strong progress has been made, but larger investments in nutrition-appropriate policies and actions across multiple systems will be required to ensure greater strides are made in reducing stunting.
The global prevalence of wasting among children under five years of age did not change significantly from 2012 to 2022, declining from 7.5 percent to 6.8 percent. The 2022 estimate is more than double the 2030 target of less than 3 percent. These results signal that greater targeting of resources is needed towards those countries with the highest burden to increase their access to essential actions for the prevention of child wasting across multiple systems, including health, water and sanitation, education, and social policy. To ensure achievement of the global targets, scaling up of early detection, optimized treatments, and monitoring and delivery of effective services for reducing child wasting are needed, as per the Global Action Plan on Child Wasting.44
To achieve the 2030 target of 3 percent for child overweight, a shift is required in the direction of the global trend. The prevalence of overweight remained stagnant at 5.5 percent in 2012 and 5.6 percent in 2022. To address overweight and obesity in the youngest age groups, it is critical to invest in effective promotion and adoption of positive habits including healthy feeding patterns, avoiding easy access to foods high in sugars, salt and fats, as well as active play and other types of physical activity.45
Regional progress
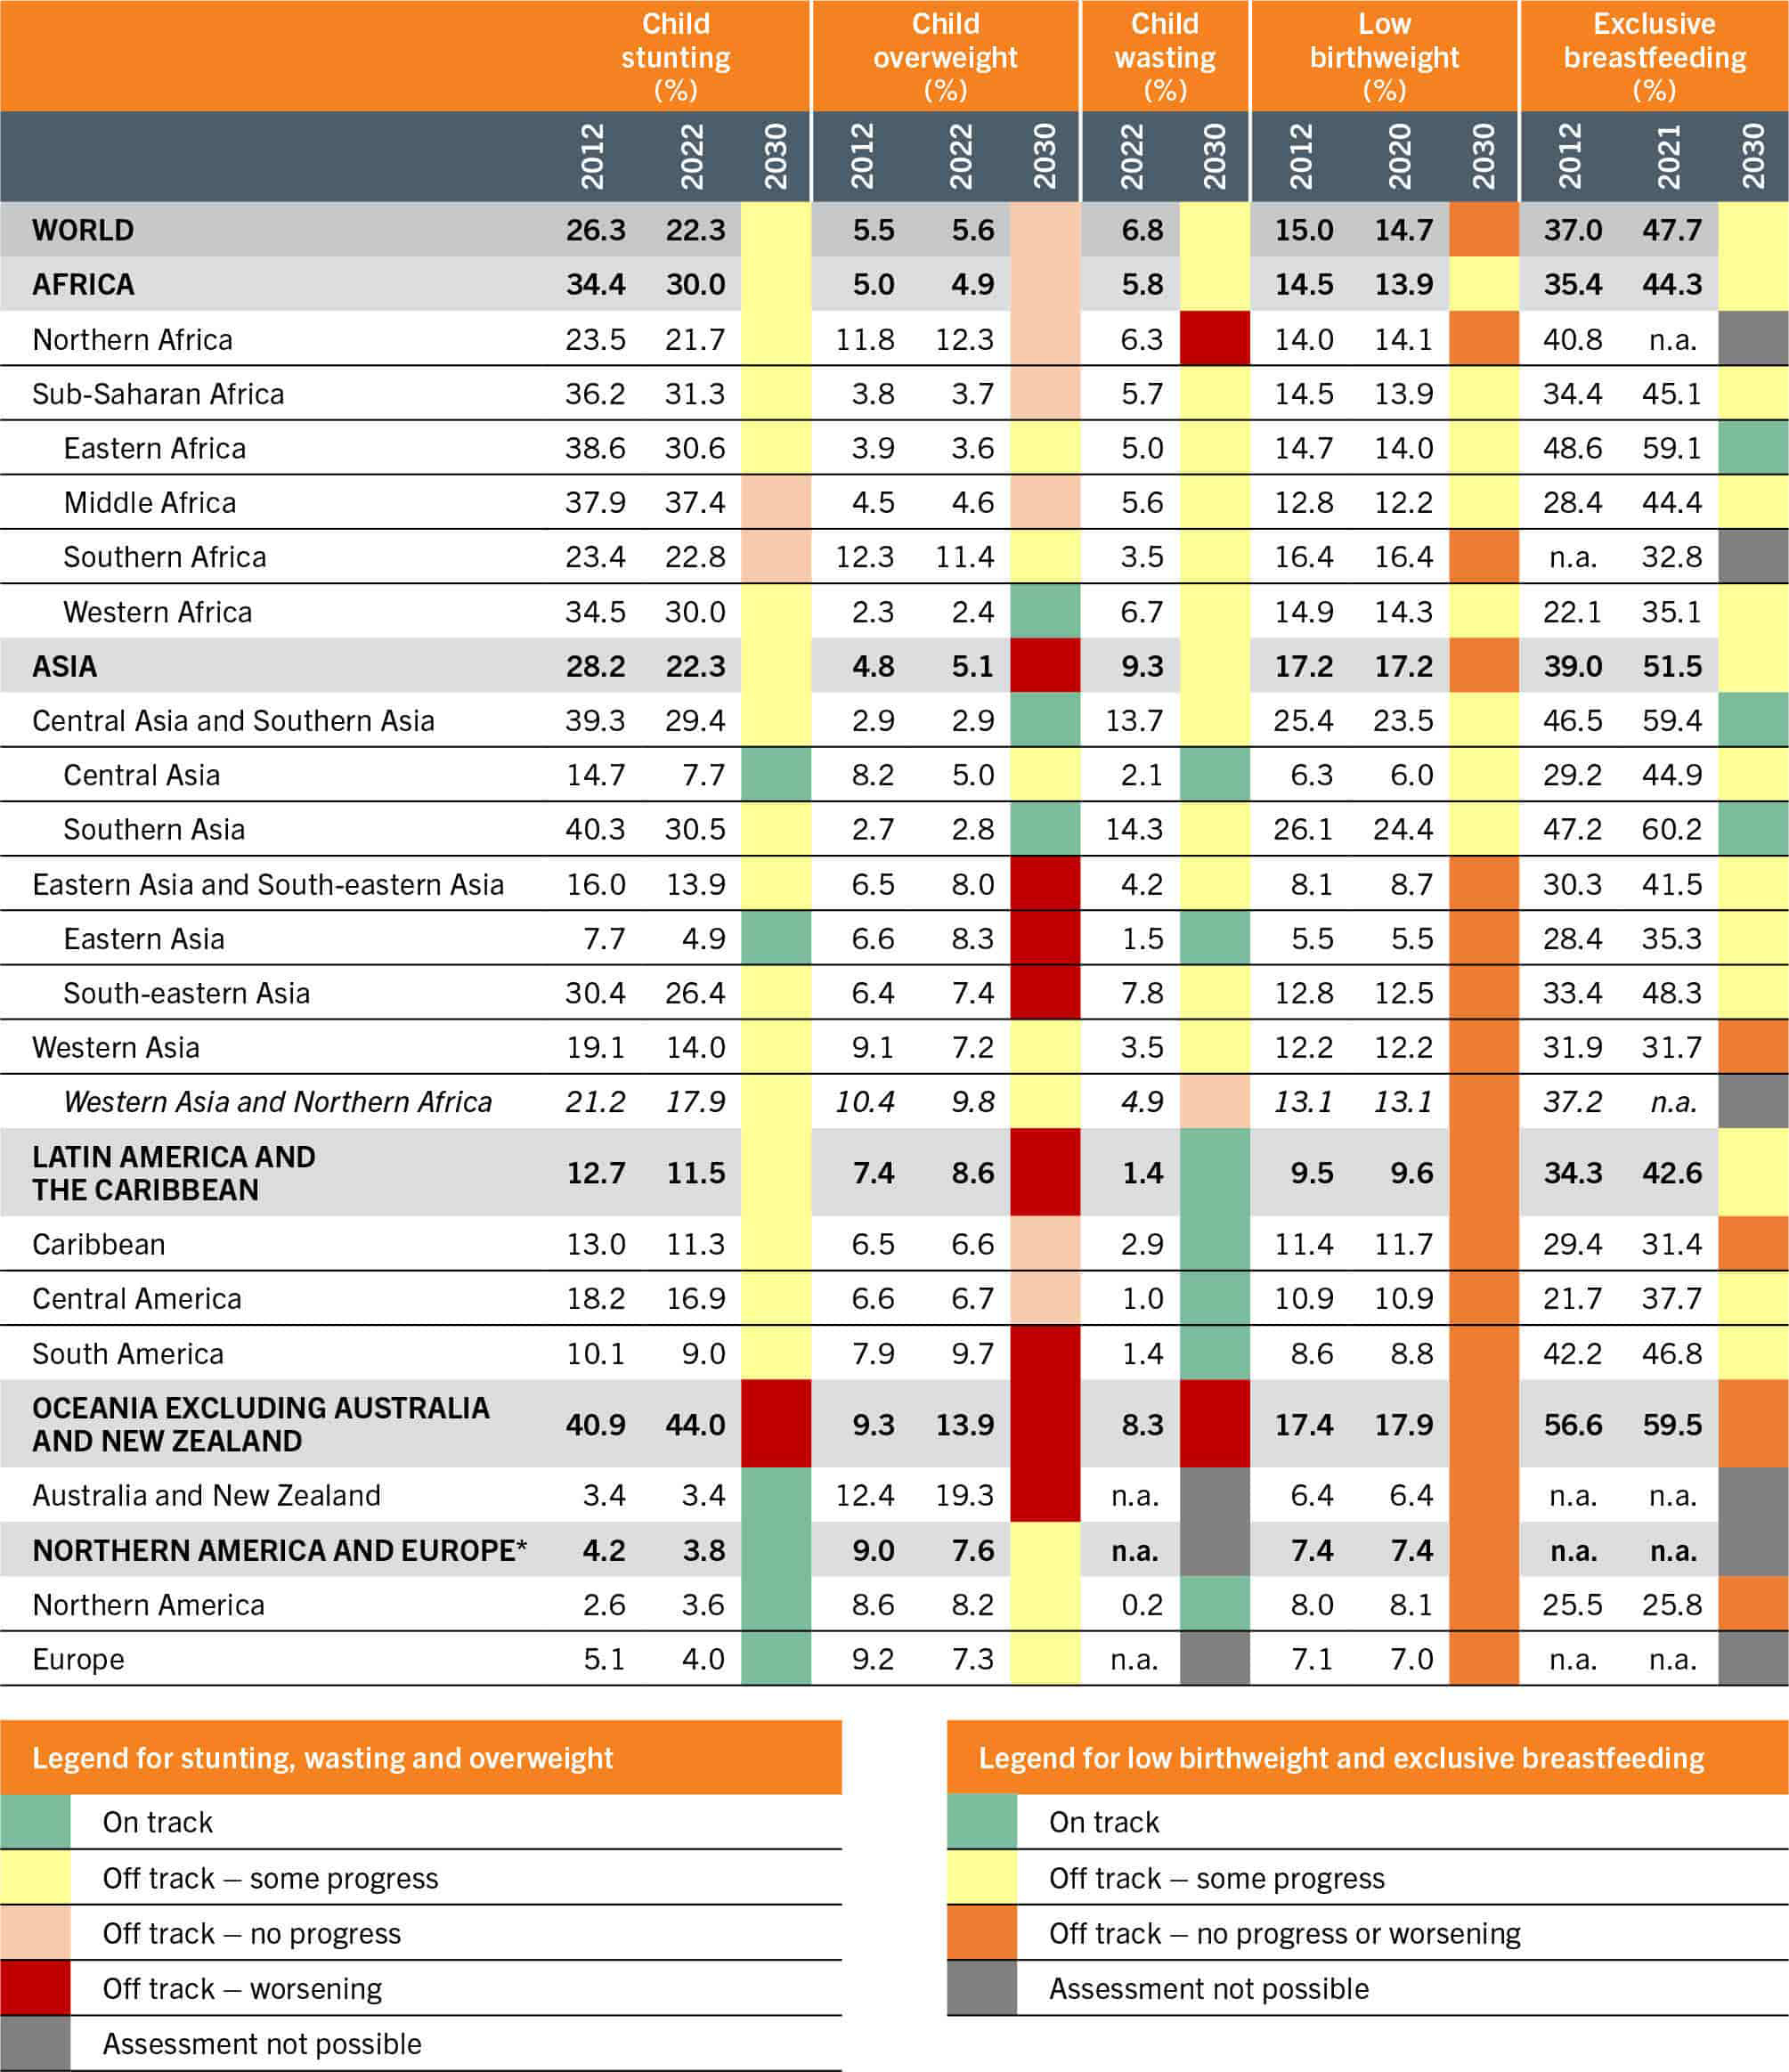
This section presents an assessment of the progress towards the 2030 global nutrition targets at the regional and subregional levels. The regional and subregional analysis is based on the annual average rate of reduction46 observed from trends between the baseline and the most recent year of the indicator, compared to the rate of reduction needed between 2012 and 2030 to reach the global targets. Progress is calculated as the progress achieved versus the change required to bring the indicators to the desired levels (Table 6). (The methodology is described in Annex 2, Section F.)
TABLE 6All regions made some progress towards the stunting, wasting and exclusive breastfeeding 2030 targets except Oceania excluding Australia and New Zealand
SOURCES: Data for stunting, wasting and overweight are based on UNICEF, WHO & World Bank. 2023. UNICEF-WHO-World Bank: Joint child malnutrition estimates - Levels and trends (2023 edition). [Cited 24 April 2023]. https://data.unicef.org/resources/jme-report-2023, www.who.int/teams/nutrition-and-food-safety/monitoring-nutritional-status-and-food-safety-and-events/joint-child-malnutrition-estimates, https://datatopics.worldbank.org/child-malnutrition; data for exclusive breastfeeding are based on UNICEF. 2022. Infant and young child feeding. In: UNICEF. [Cited 6 April 2023]. https://data.unicef.org/topic/nutrition/infant-and-young-child-feeding; data for low birthweight are from UNICEF & WHO. 2023. Low birthweight joint estimates 2023 edition. [Cited 12 July 2023]. https://data.unicef.org/topic/nutrition/low-birthweight; www.who.int/teams/nutrition-and-food-safety/monitoring-nutritional-status-and-food-safety-and-events/joint-low-birthweight-estimates. The targets are drawn from: UNICEF & WHO. 2017. Methodology for monitoring progress towards the global nutrition targets for 2025 – technical report. New York, USA and Geneva, Switzerland. https://data.unicef.org/resources/methodology-for-monitoring-progress-towards-the-global-nutrition-targets-for-2025; and UNICEF & WHO. 2019. The extension of the 2025 Maternal, Infant and Young Child nutrition targets to 2030. New York, USA and Geneva, Switzerland. https://data.unicef.org/resources/who-unicef-discussion-paper-nutrition-targets
For low birthweight, no region is on track to reach the 2030 targets and global progress is off track (no progress or worsening). Only Africa made modest progress (off track – some progress) and the remaining regions have made no progress (off track – no progress or worsening) towards the 30 percent reduction in prevalence of low birthweight. Despite Africa being one of the two regions with the highest prevalence of low birthweight, it is the region where some progress is being achieved in three out of five subregions.
At the global level, there has been some progress (off track – some progress) towards reaching the 2030 target for exclusive breastfeeding. At the regional level, Africa, Asia, and Latin America and the Caribbean have all achieved some progress (off track – some progress). Considerable improvements have been made in Eastern Africa and Southern Asia with exclusive breastfeeding, both of which are on track to reach their targets. Subregions that are not progressing (off track – no progress or worsening) include the Caribbean, Oceania excluding Australia and New Zealand, Northern America and Western Asia. The subregions with inadequate data (assessment not possible) include Australia and New Zealand, Europe, Northern Africa and Southern Africa.
Global estimates show some progress (off track – some progress) towards reaching the stunting reduction target. Northern America and Europe are on track. All other regions except Oceania excluding Australia and New Zealand achieved some progress (off track – some progress) on stunting reduction. The subregions considered on track for stunting include Australia and New Zealand, Central Asia, Eastern Asia, Europe and Northern America. The remaining subregions are making some progress on stunting with the exception of Middle Africa and Southern Africa.
For wasting at the global level, some progress (off track – some progress) has been achieved, with Latin America and the Caribbean on track to reach the 2030 target. Among the subregions, those on track are the Caribbean, Central America, Central Asia, Eastern Asia, Northern America and South America. Africa and Asia have made some progress (off track – some progress) to address this dangerous condition in regions with the highest prevalence.
There has been no progress in reducing overweight in children to meet the 2030 target at the global level (off track – no progress). The prevalence of overweight is worsening in Asia, Australia and New Zealand, Latin America and the Caribbean, and Oceania excluding Australia and New Zealand. The situation is comparatively better in Africa; the region is still off track (no progress), but with a non-significant reduction in overweight in children under five years of age.
Great achievements have been made in promoting exclusive breastfeeding and reducing stunting, but the results vary across regions. Malnutrition in all its forms is found across all regions and could be underestimated due to various factors, as mentioned at the beginning of this section. Achieving the 2030 global nutrition targets requires stronger and more concerted efforts to prevent global setbacks. The global trends in stunting, wasting, exclusive breastfeeding and low birthweight must be accelerated, while for overweight in children they will have to be reversed, to achieve the 2030 global nutrition targets.
Urban–rural differences in nutrition indicators
In the past, urban children held a distinct advantage of being better nourished than rural children.47 The higher incomes and improved food access and availability associated with urban residence allowed children to obtain more regular and diverse diets as well as access to health services, potable water and sanitation. But with continued urbanization and the rapid rise in urban poor, there is now a larger population dependent on the most easily available and inexpensive foods which are often not nutritious or hygienic, increasing the risk of malnutrition.
Rural populations often depend on agriculture for their livelihoods. At the same time, the poorest populations are typically found in agricultural regions across and within countries. Hence, when other labour opportunities arise, people often move away from poorly compensated agricultural work, which reinforces the paradox that in agricultural regions, the population and notably its children are more likely to be malnourished.48 In fact, it has been demonstrated that proximity to agricultural food production does not translate into healthier diets for children. The 2022 report on child food poverty found a higher prevalence of severe food poverty (consuming foods from only two food groups or less per day) among children living in rural areas.49
Urban–rural differences in stunting and wasting arise in part from disparities in access to health care, water, sanitation and a hygienic environment.50 Implementation of key public health interventions across the continuum of care helps to improve the health and nutritional status of children and mothers, through provision of care at first-line health facilities. Improved sanitation and hygiene practices can make significant differences in halting the cycle of infectious disease and undernutrition.
Since 2000, as urban populations have undergone the nutrition transition, nutrition-related NCDs – including obesity, diabetes and hypertension – have caused a larger proportion of death and disability compared to undernutrition.51 Worldwide, rural populations are now undergoing the same transition, and in some areas are beginning to show higher prevalence of overweight and obesity compared to urban areas.52 The unfinished agendas to reduce stunting, wasting and micronutrient deficiency, along with rising overweight and obesity, represent the current challenge to address multiple forms of malnutrition. Malnutrition in all its forms is related to poor diets, the rise of low-cost nutrient-poor foods and the increasing availability of highly processed foods in rural areas.53, 54
Figure 15 presents the prevalence of four nutrition indicators in rural and urban areas.
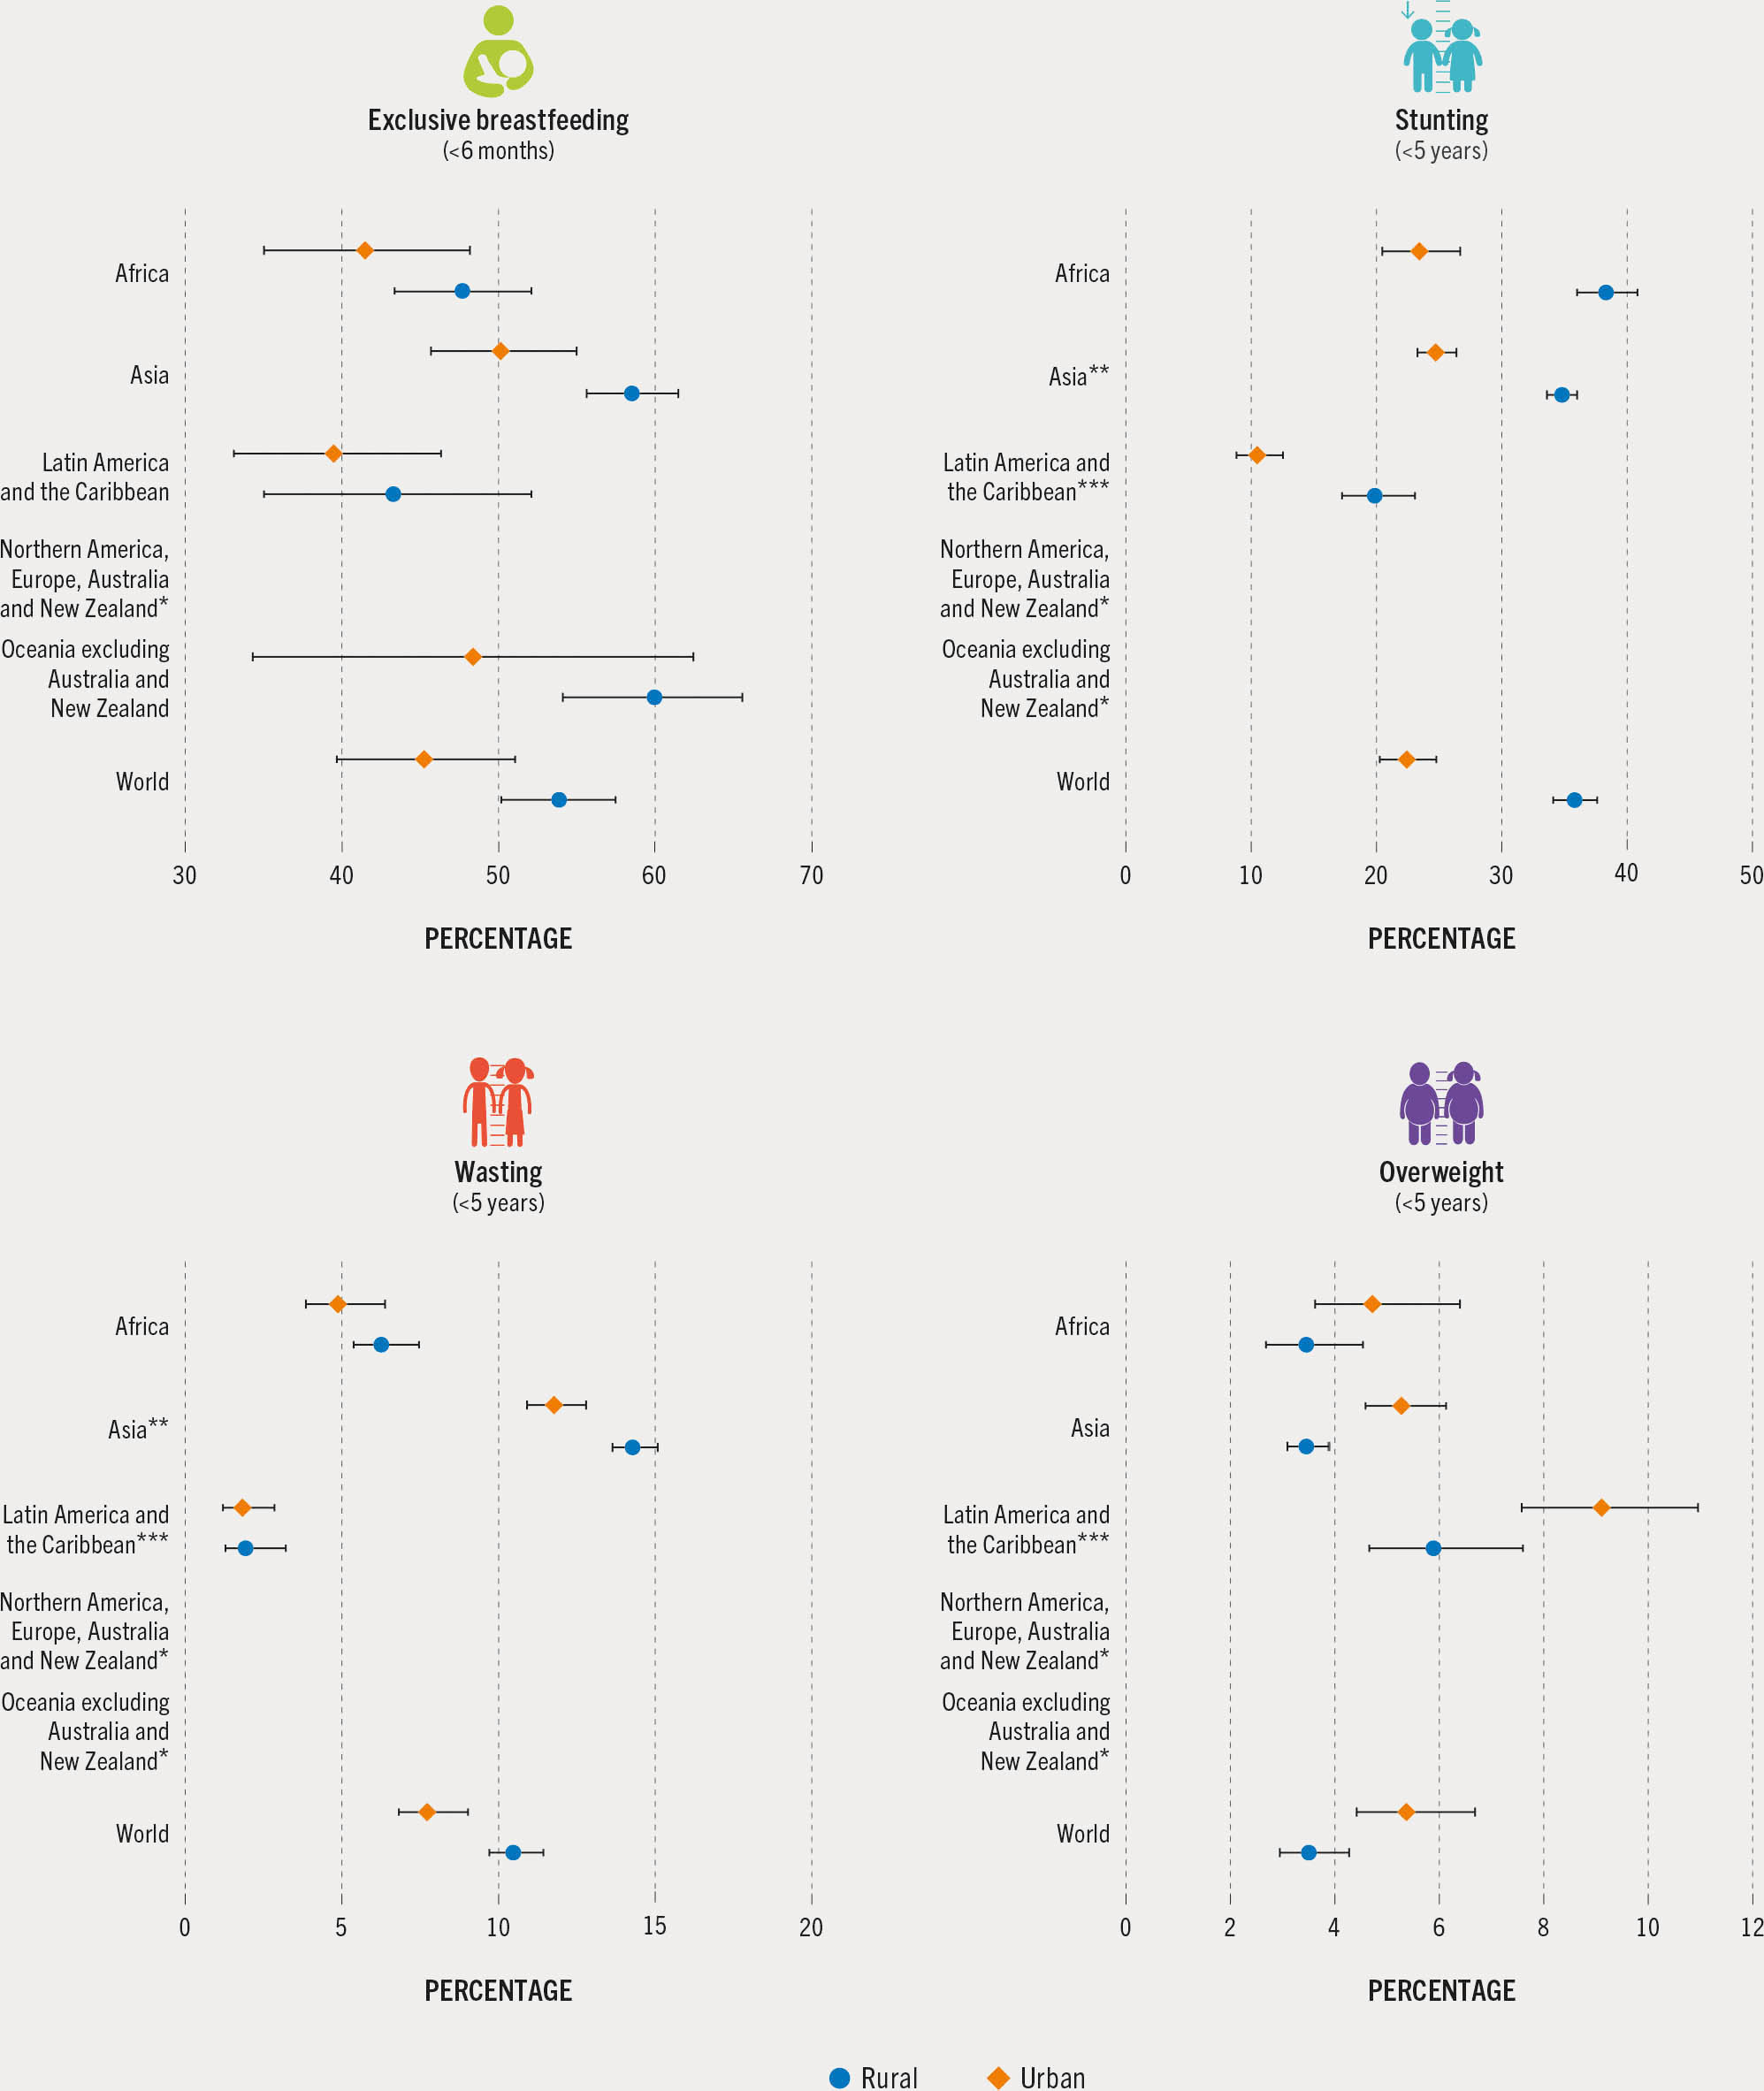
FIGURE 15 The prevalence of stunting and wasting was higher in rural compared to urban areas, while overweight was more commonly found in urban areas
SOURCES: Data for stunting, wasting and overweight are based on UNICEF, WHO & World Bank. 2023. UNICEF-WHO-World Bank: Joint child malnutrition estimates - Levels and trends (2023 edition). [Cited 24 April 2023]. https://data.unicef.org/resources/jme-report-2023, www.who.int/teams/nutrition-and-food-safety/monitoring-nutritional-status-and-food-safety-and-events/joint-child-malnutrition-estimates, https://datatopics.worldbank.org/child-malnutrition; data for exclusive breastfeeding are based on UNICEF. 2022. Infant and young child feeding. In: UNICEF. [Cited 6 April 2023]. https://data.unicef.org/topic/nutrition/infant-and-young-child-feeding. Population data are based on United Nations Population Division. 2022. World Population Prospects 2022. [Cited 27 April 2023]. https://population.un.org/wpp. Rural/urban data are from United Nations Population Division. 2018. World Urbanization Prospects 2018. [Cited 27 April 2023]. https://population.un.org/wup
The definitions of rural and urban residence used in the analysis are based on national definitions recorded in national master sample frames employed to generate survey samples.j The criteria are commonly based on population size, range of economic activities undertaken, whether the area has been assigned an administrative function, or a combination of these characteristics. For more information on rural–urban classification, see Box 3 in Chapter 3.
The prevalence of exclusive breastfeeding is significantly higher in rural Asia (58.6 percent) than in urban Asia (50.2 percent). No significant differences were found in exclusive breastfeeding by area of residence in Africa, Latin America and the Caribbean, and Oceania excluding Australia and New Zealand. Globally, exclusive breastfeeding is higher in rural areas (53.9 percent) than in urban areas (45.3 percent) with the differences bordering on statistical significance but clearly indicating public health significance for the millions of children who benefit from exclusive breastfeeding.
For stunting, there are major rural–urban differences globally and in three of the five regions. In Africa, Asia, and Latin America and the Caribbean, the prevalence of stunting in rural areas is 9 to 15 percentage points higher than in urban areas. Globally, the prevalence of stunting is higher in rural areas (35.8 percent) than in urban areas (22.4 percent).
Wasting presented a similar distribution, with the global prevalence significantly higher in rural areas (10.5 percent) than in urban areas (7.7 percent). In Asia, there is a significant difference in wasting between rural (14.3 percent) and urban (11.8 percent) areas. No rural–urban differences were found in Africa or Latin America and the Caribbean.
For child overweight, there are small but significant differences by rural–urban residence that serve as an important alert. In Asia and globally, overweight prevalence was nearly two percentage points higher in urban areas (5.3 percent in Asia and 5.4 percent globally) than in rural areas (3.5 percent in both). The highest reported regional prevalence in 2022 was among children residing in urban areas of Latin America and the Caribbean (9.1 percent). Current results were not available in the most urbanized subregions, namely Australia and New Zealand, Europe and Northern America.
The results from these analyses help to identify vulnerable population groups, contributing to evidence to inform decision-making and effective action through the appropriate targeting and design of policies and programmes. Sound nutrition is fundamental to the achievement of the Sustainable Development Goals and must be central in government policy and supported by key stakeholders, including civil society and the private sector.

