


A. Household surveys
The demand analysis conducted in Section 4.1 and the estimation of subnational cost of a healthy diet in Section 4.2 use georeferenced data from national representative LSMS surveys (Table A5.1). The surveys capture apparent household food consumption using quantitative seven-day recalls. The same surveys contain a separate module with eight questions regarding people’s access to adequate food, which was used for the estimation of the prevalence of moderate or severe food insecurity in Section 4.2
Table A5.1Household surveys used in Chapter 4
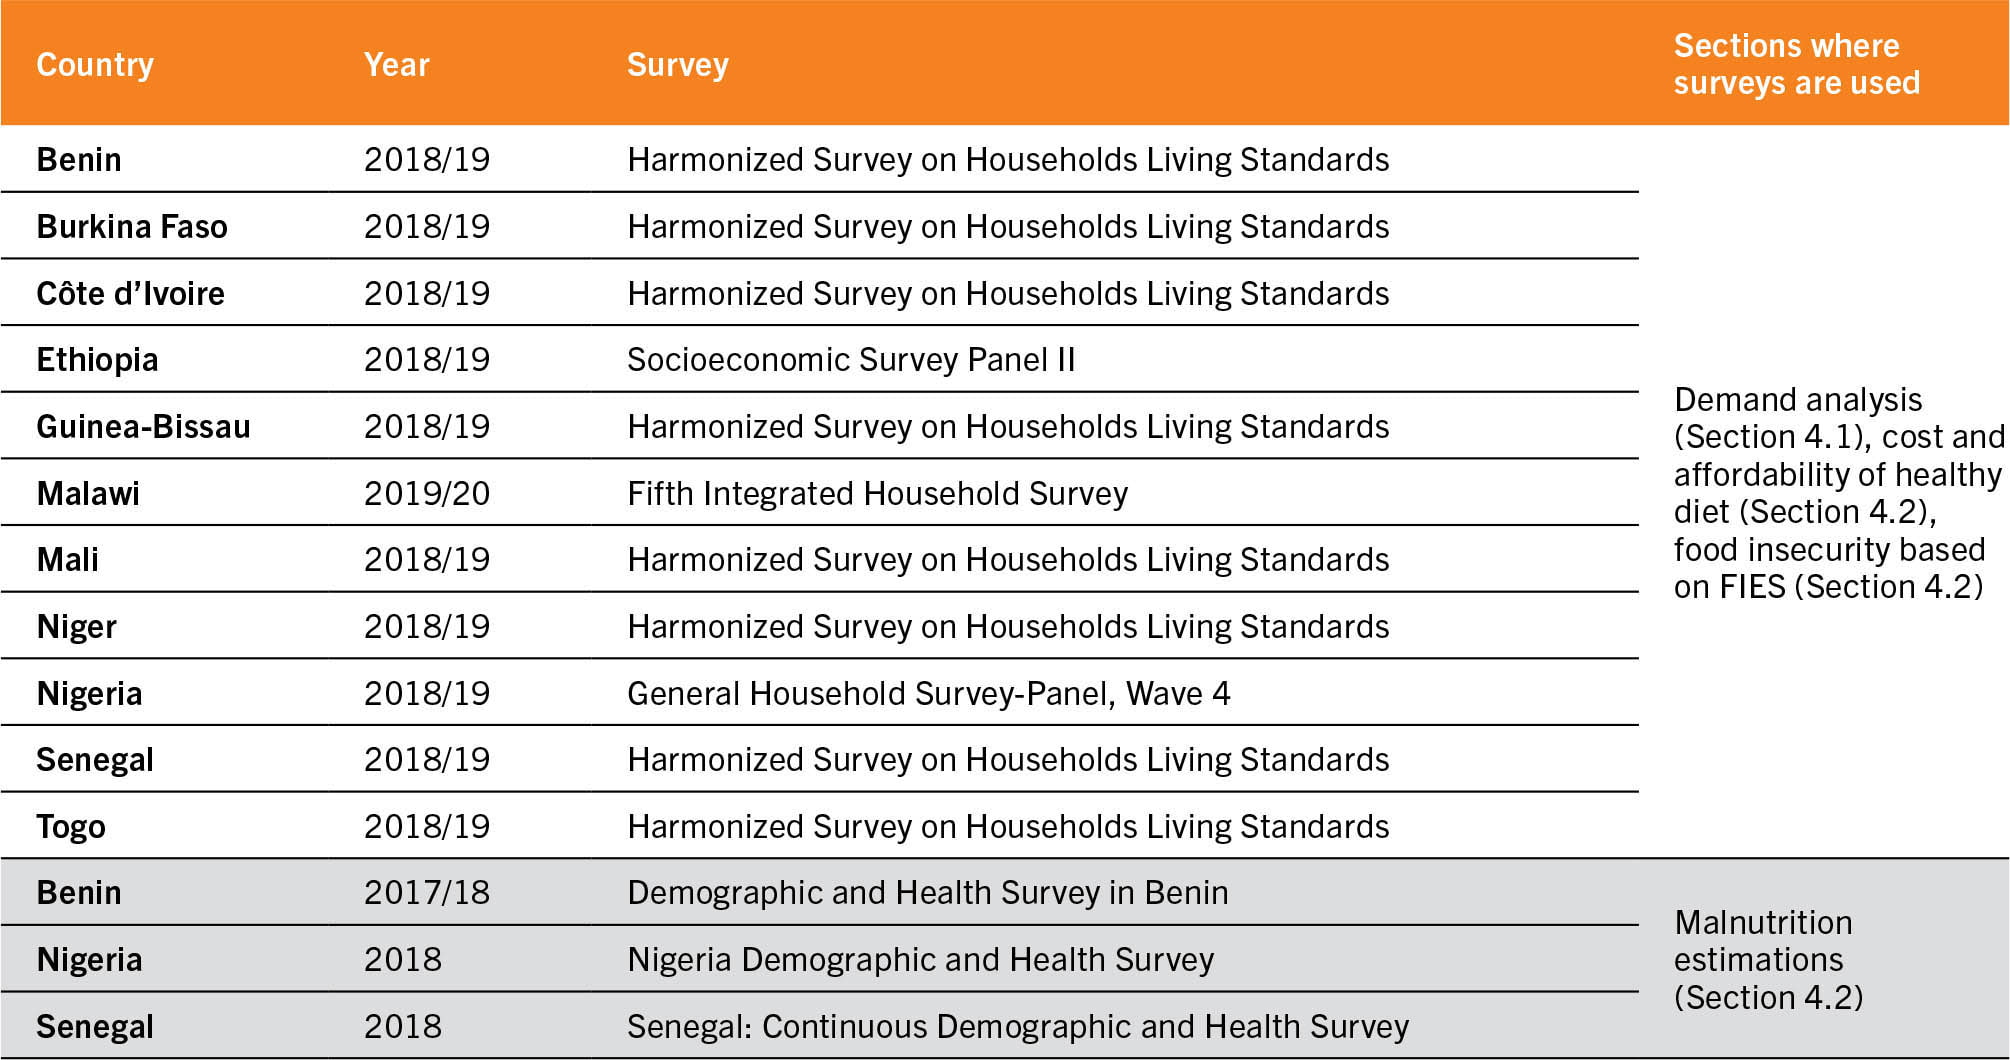
Finally, malnutrition indicators among children under five years of age assessed in Section 4.2 were derived using georeferenced data from national representative demographic and health surveys (Table A5.1).
B. URCA categories used in the rural–urban continuum analysis
For the analyses conducted in Chapter 4, the URCA categories were simplified and grouped into ten categories, with a further aggregation to urban, peri-urban and rural categories (see Table 9 in Chapter 4). This aggregation allowed for a sufficient number of observations in almost all URCAs to conduct the analyses. For more details on the URCA categories, see Box 2 and Box 3 in Chapter 3. Table A5.2 reports the number of households interviewed in each URCA and the number of households for which georeferenced variables were not available, and for which it was thus not possible to assign to any URCA.
Table A5.2Household sample sizes by URCA for the surveys used in Chapter 4
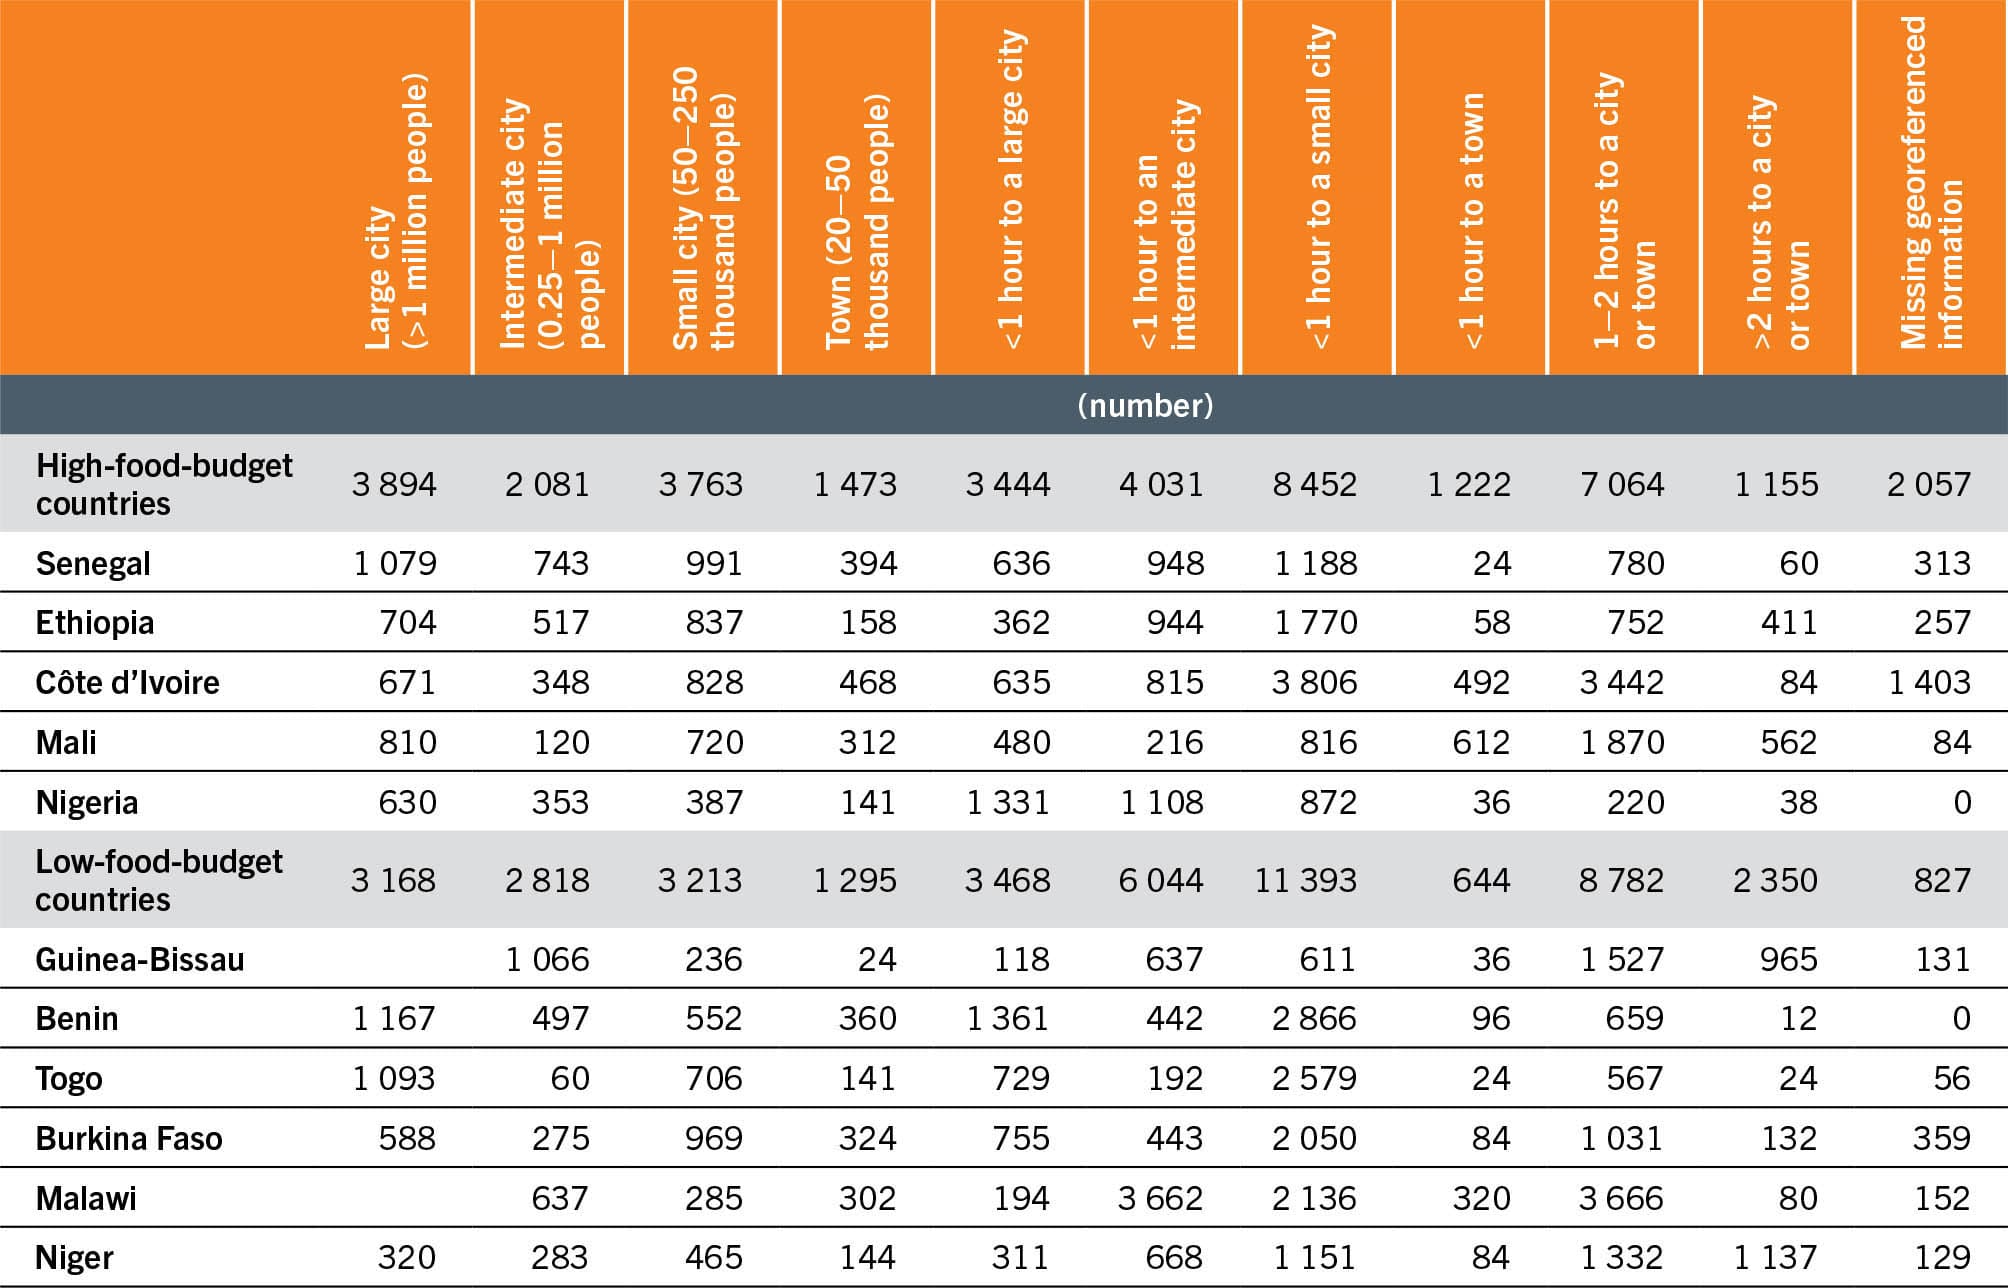
The surveys are all nationally representative, but they are not meant to be representative at the URCA level. For this reason, the distribution of population surveyed across URCAs was compared with the actual population distribution (estimated based on the 2020 Global Human Settlement Population [GHS-POP] dataset and the URCA dataset), and it was found to be sufficiently similar so as to exclude that any catchment area was under- or overrepresented in each survey.
The URCA dataset was developed based on i) the GHS Settlement Model (GHS-SMOD) grid to identify cities and towns; ii) the GHS-POP grid for 2015 to calculate the urban population in each city; and iii) travel time classifications based on Nelson et al. (2019)38 with updated cost surface from Weiss et al. (2020).39 Accordingly, the matching between the URCA dataset and surveys in Table A5.1 presents some time inconsistencies, as surveys are for a one-year period and were conducted between 2018 and 2019 (except Malawi, conducted between 2019 and 2020). However, the information on road and infrastructure used in the URCA dataset was the most updated at the time the dataset was developed, which is around the same time the surveys were conducted. Thus, we expect that the travel time in the URCA dataset does not diverge significantly from the travel time faced by the households in the surveys analysed.
To identify the urban centres in the URCA dataset, the 2015 GHS-POP was used. Accordingly, it is possible that some peri-urban areas are misclassified in the analysis of Chapter 4 (i.e. if a city has expanded, some areas that were in 2015 classified as “less than 1 hour from the city” could have become part of the city in 2018/19). This is however only the case if the city had expanded geographically and not just in population size. In addition, it is possible that an urban centre may have grown in population size between 2015 and 2018/19 and made the jump from small to intermediate city, or from intermediate to large city.
C. Food processing and food group aggregates used in food demand analyses
Explanatory note on processed foods and food processing classification systems
The term “food processing” involves applying scientific and technological principles to preserve foods by slowing down or stopping the natural processes of decay.40 Purposes of food processing include converting inedible into edible foods, increasing the digestibility of raw foods (e.g. through cooking), altering the shelf-life (e.g. through fermentation, canning or freezing), simplifying meal preparation, or increasing the palatability of food products (e.g. through the addition of flavourings). The degree of food processing can vary from unprocessed raw foods (e.g. fresh fruit eaten as such) to food products whose ingredients are derived from food but contain little or no whole food (e.g. extruded cereals).41 Certain food processing methods can help to increase food availability by allowing transport of foods across the globe, thus extending seasonal availability beyond what is produced locally in a specific season, and also making food safer to eat.42 Foods and food products processed in industrial settings differ from those prepared by hand at home or in artisanal settings; they employ different ingredients and methods.41
During the last two decades, numerous classification systems, taking into account various degrees of food processing, have been developed. Among them are food classification systems that emphasize industrial food processing, whereby foods are categorized according to processing-related criteria, each employing different criteria and metrics. They have been used to describe and monitor levels of consumption of different types of processed foods, their impact on overall diet quality and disease outcomes (in several countries), the places where these foods are purchased, or their availability in urban food environments in particular.41, 43
The NOVA food classification is one of the available food processing classification systems that has been considered in different scenarios for public health, nutrition and epidemiological research. However, there are important limitations in this classification. The definition of levels of food processing, as proposed by NOVA, is complex and multidimensional, which increases the risk of misclassification of food items.43 In addition, the first category combines unprocessed and minimally processed foods, which makes it difficult to unambiguously interpret the findings. It has been suggested that there may be few advantages from using the NOVA classification compared with the current epidemiologic approach, which relies on the linkage of nutrient intakes to chronic disease, with subsequent identification of foods that merit consideration in public health nutrition strategies.44 Therefore, results presented in Chapter 4 should be interpreted with these limitations and considerations in mind.
Food processing and food group classifications used in Section 4.1
The NOVA classification system was developed by researchers from the University of São Paulo, Brazil.45 The system was published more than ten years ago and has been used in different settings and populations since.46 For the food demand analyses by level of food processing, a food classification system adapted from NOVA was used, whereby all foods were classified according to the nature, extent and purpose of the industrial processing they undergo. These processes involve physical, biological and/or chemical methods used during the food manufacturing process.41, 45
According to the NOVA classification, methods used in households and similar places such as restaurants or artisanal settings where fresh culinary preparations are prepared from scratch by hand or with simple tools, are by definition not industrial processing methods. Home-prepared and artisanal preparations of all types should as far as possible be disaggregated into their components so that each can then be classified into one of the four groups.
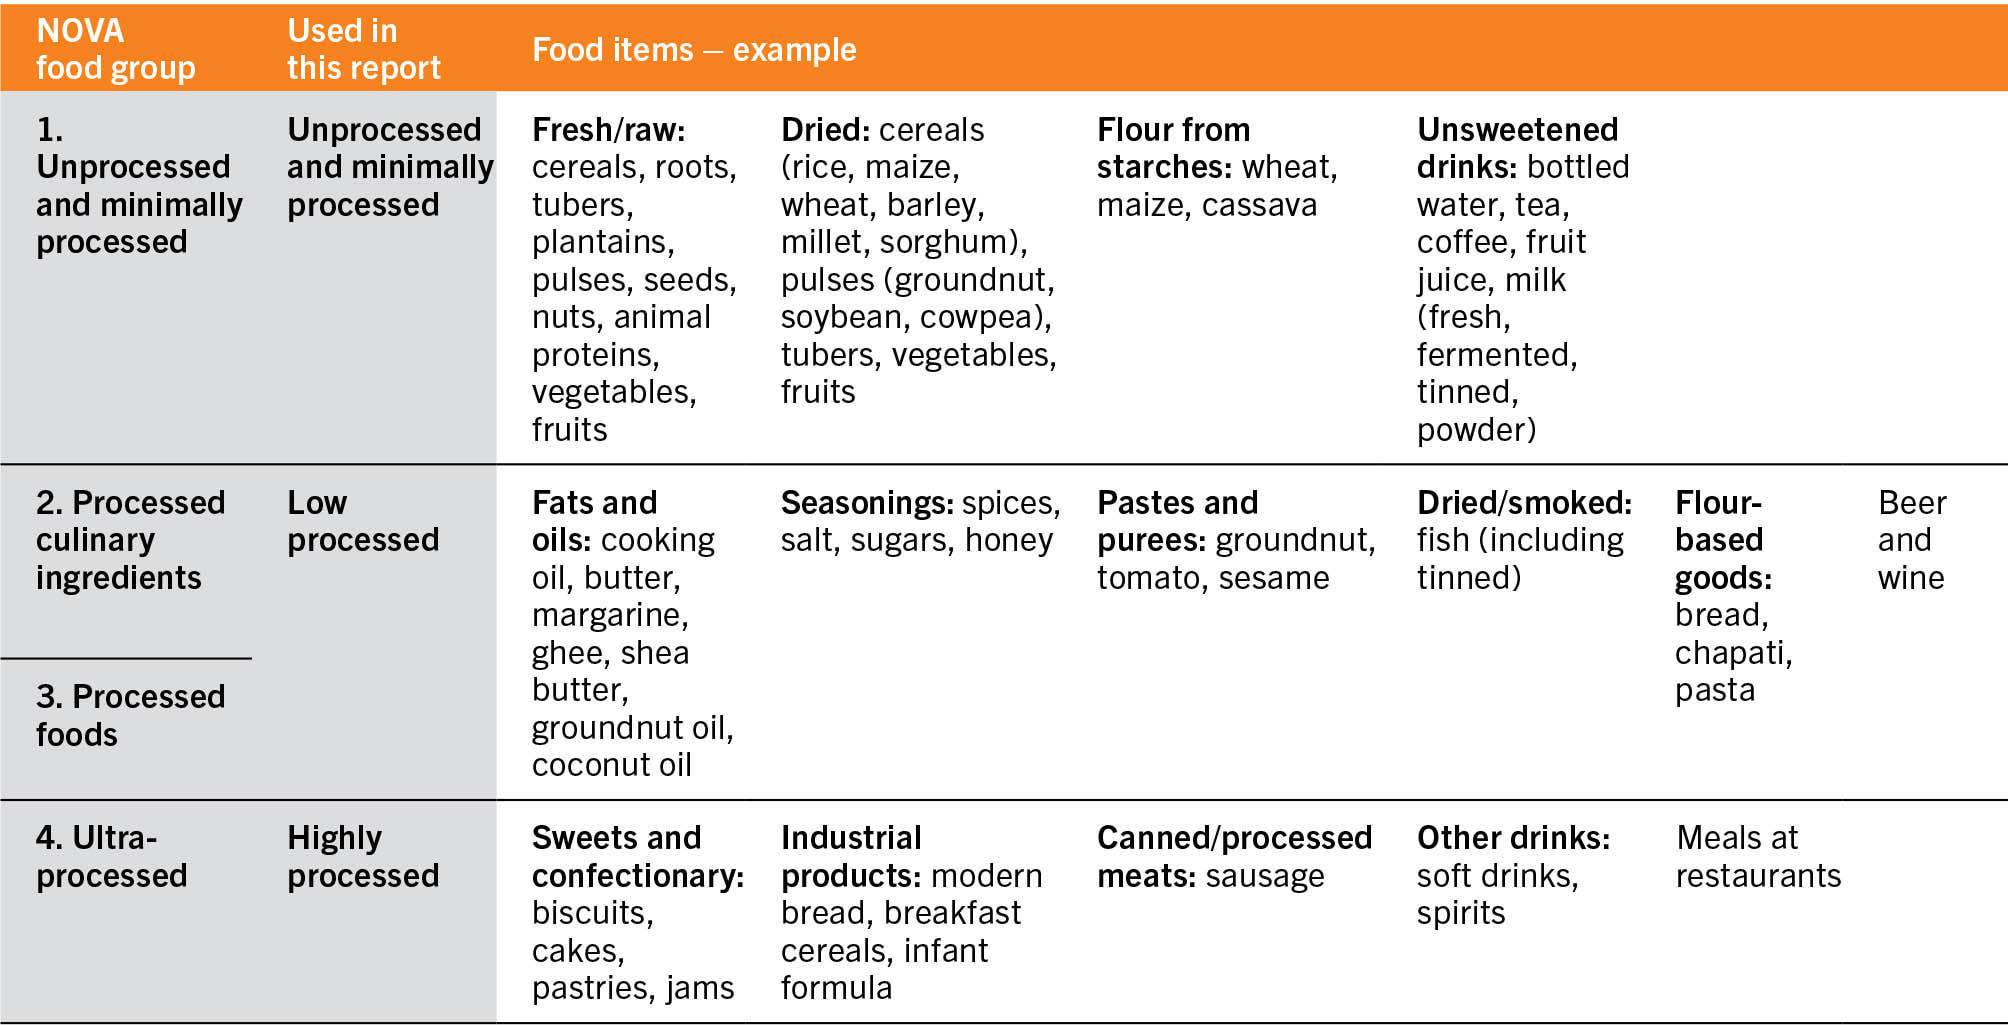
NOVA classifies all food items into four main groups: 1) unprocessed and minimally processed foods; 2) processed culinary ingredients; 3) processed foods; and 4) highly processed foods and drink products.45, 46 The four main groups and their descriptions are given in Table A5.3. For the analysis in Section 4.1, food items were classified according to the four NOVA groups;45, 46 but for the purposes of presentation, these were reduced to three groups, with groups 2 and 3 combined as one group. The three main groups (with food item examples in each) and the names used in this report are shown in Table A5.4.
Table A5.3NOVA food groups with descriptions and examples
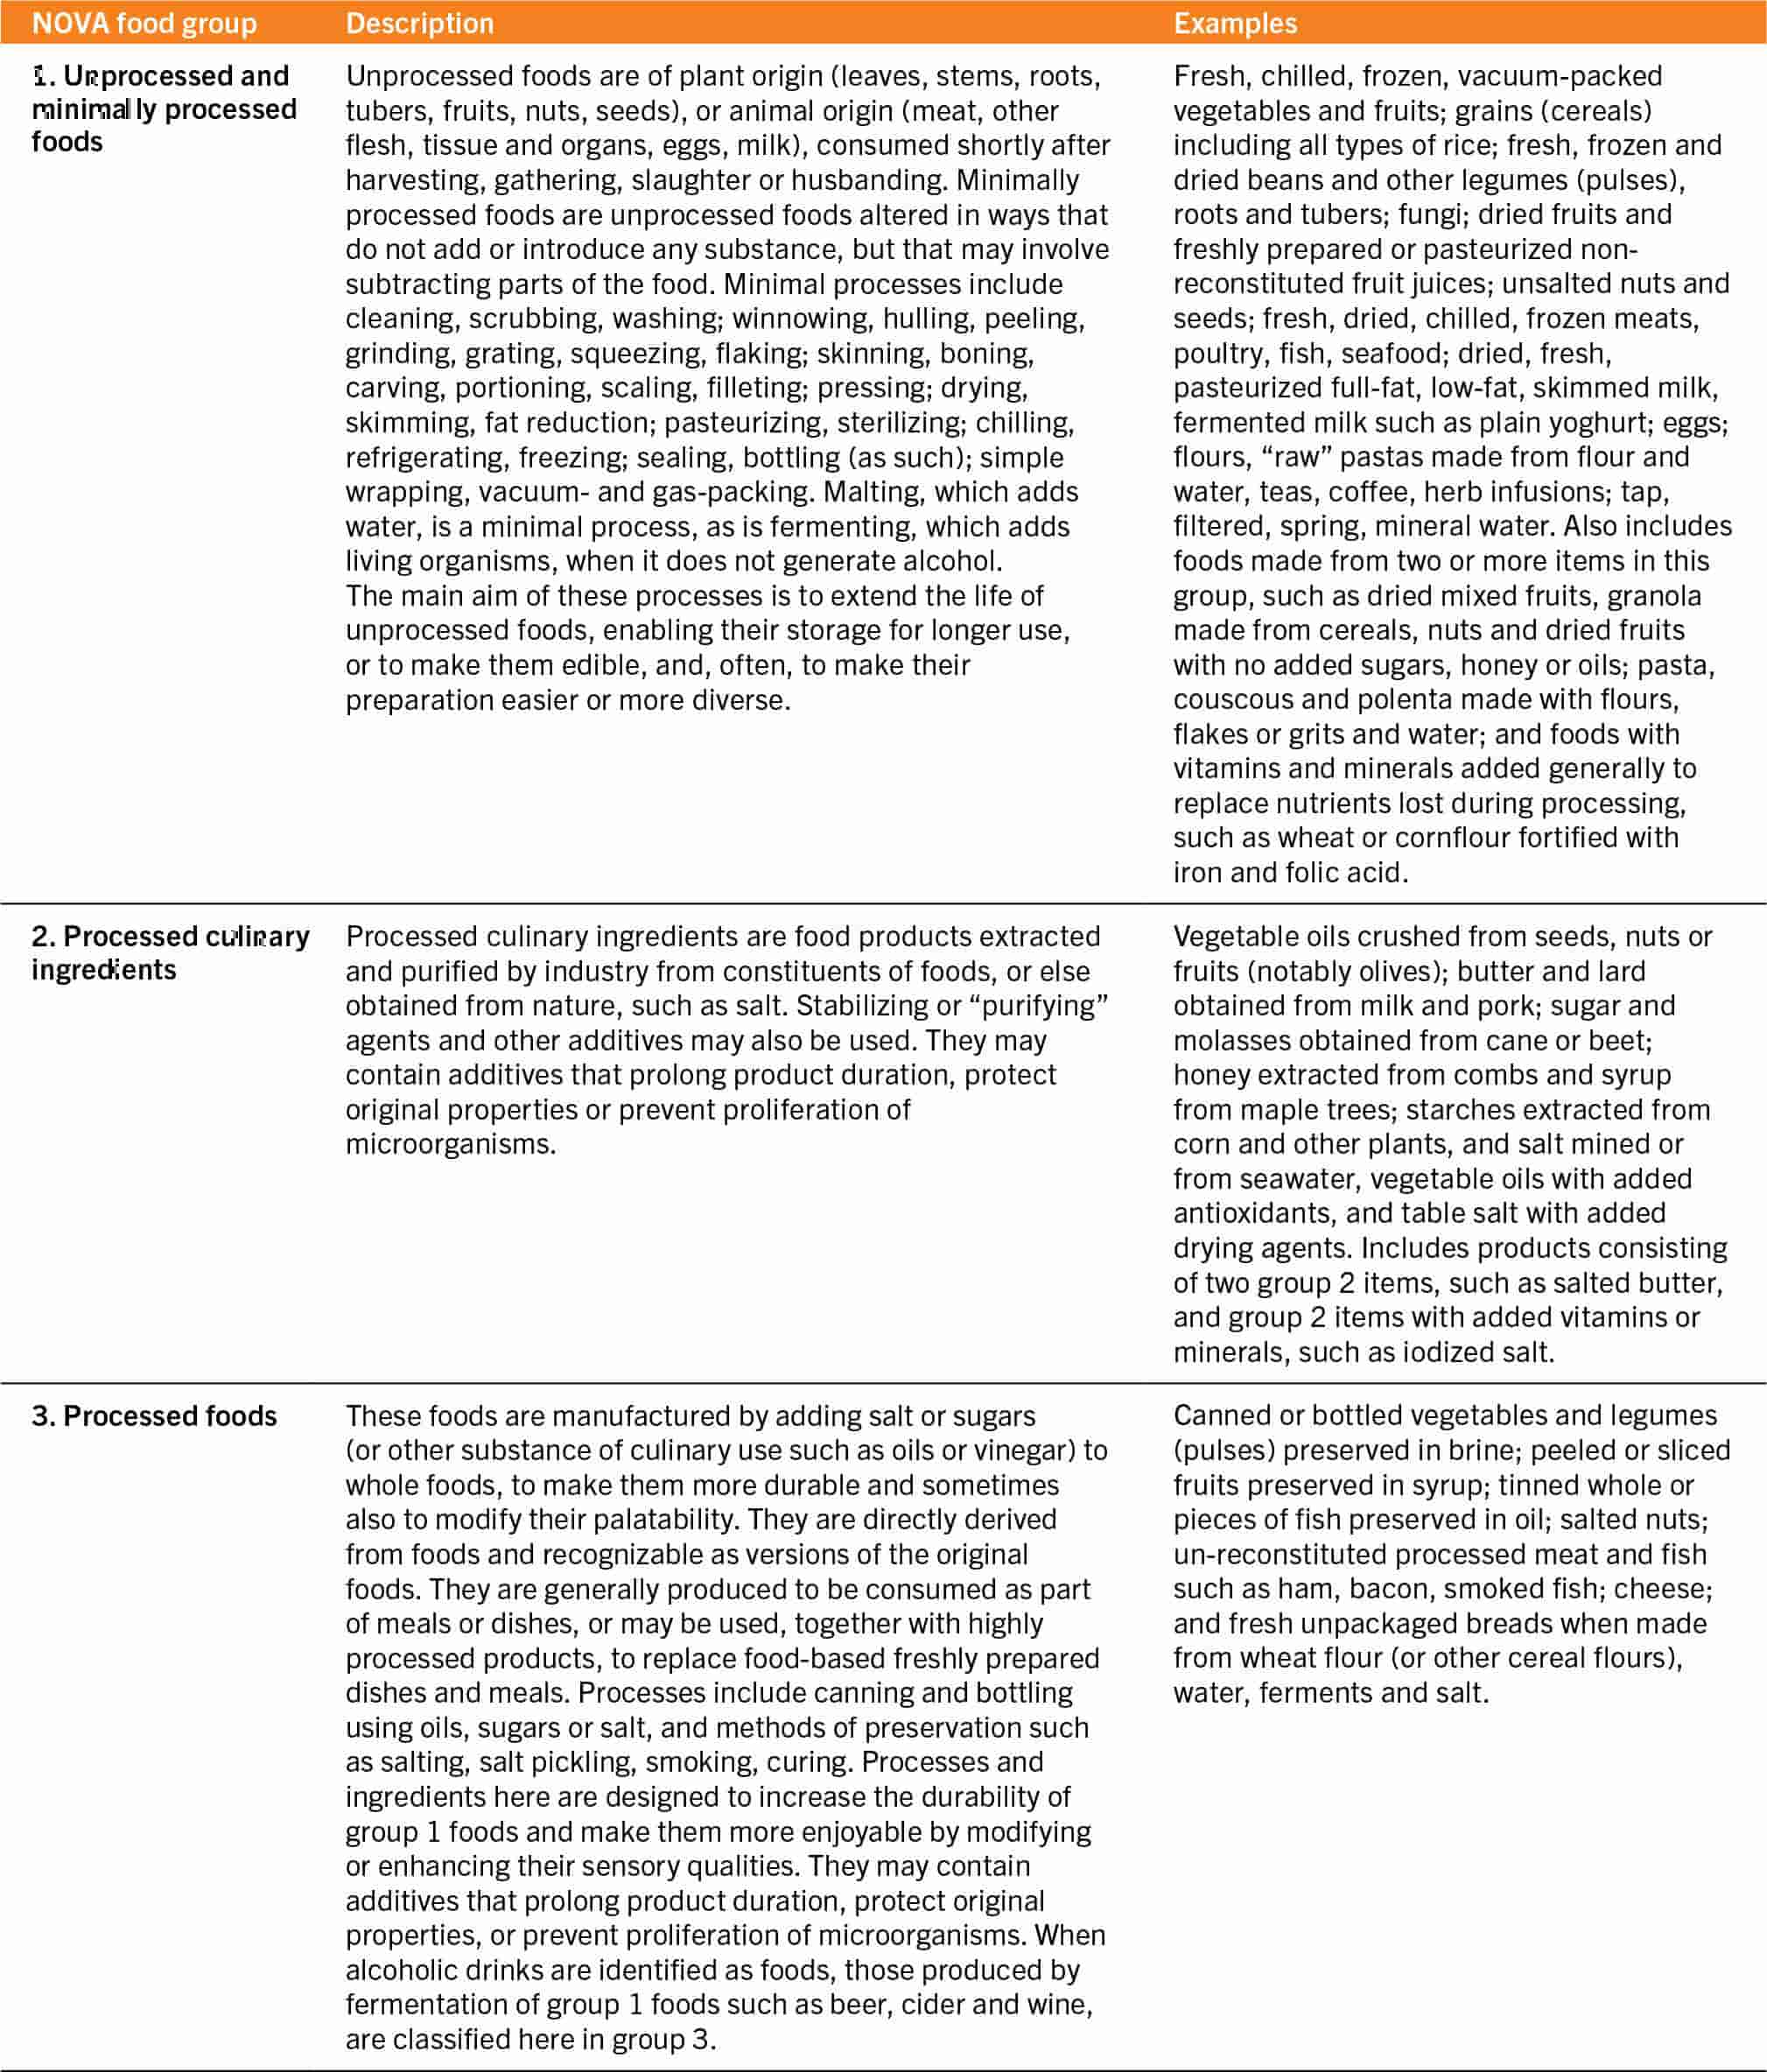

Table A5.4Food processing level aggregates used in Section 4.1 adapted from NOVA
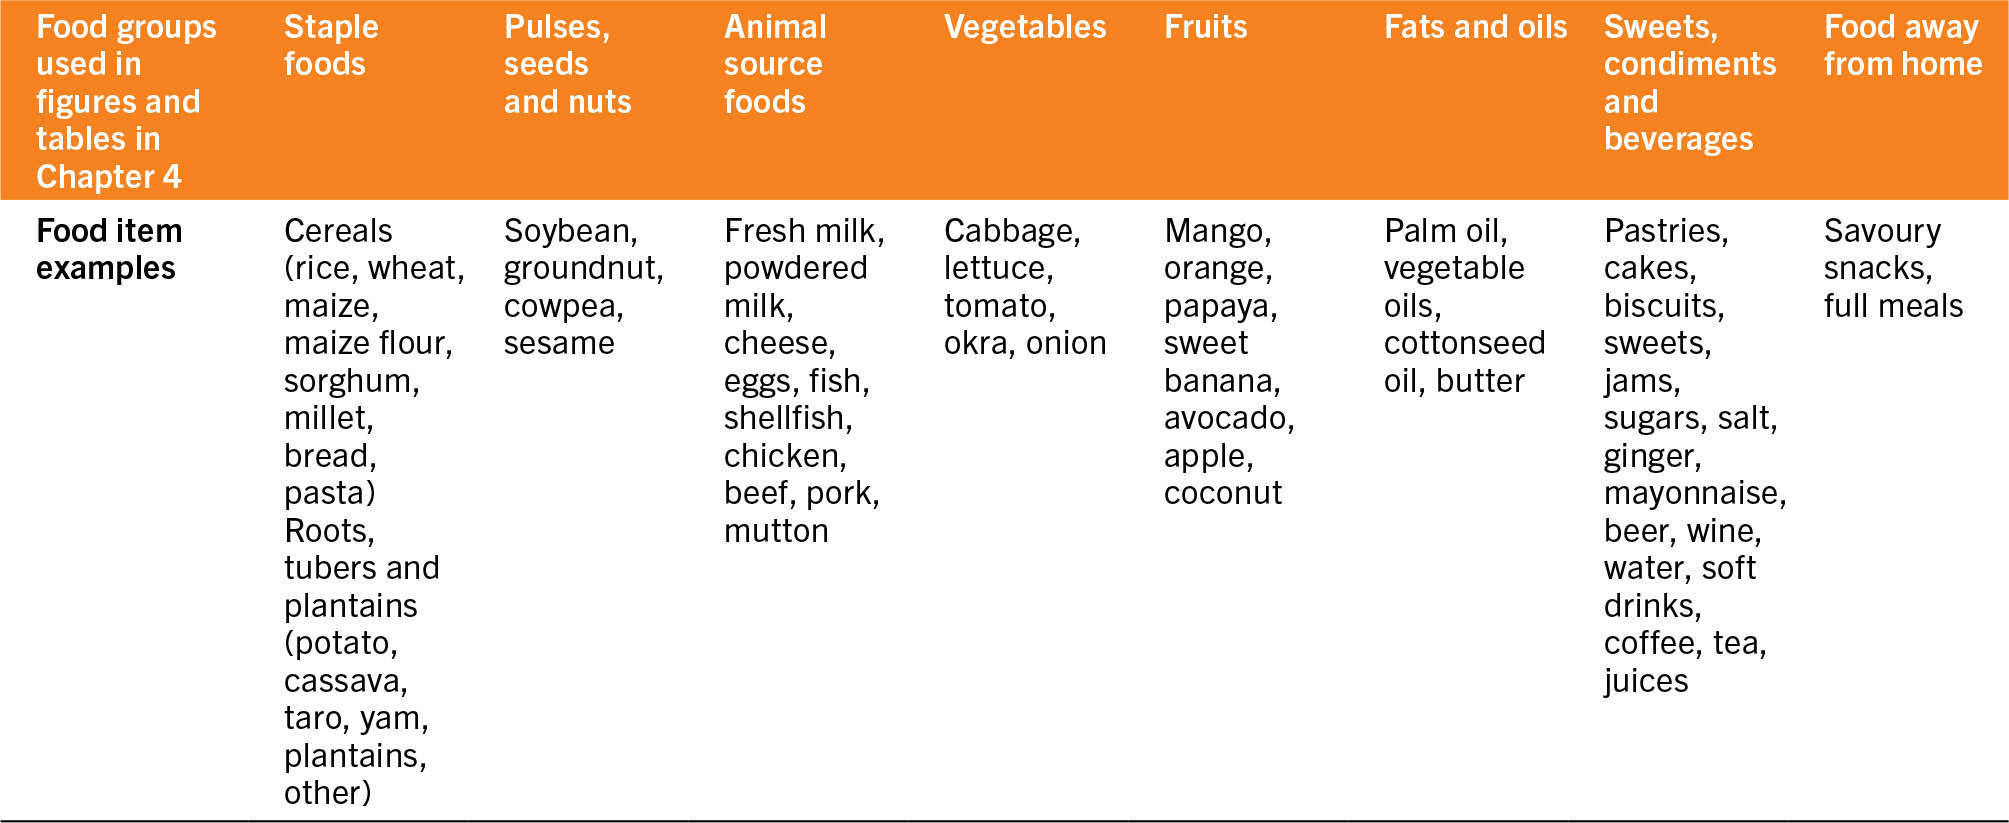
For the purpose of the analysis in Section 4.1, the FAO/WHO Global Individual Food consumption data Tool (GIFT) food grouping (Table A5.5)47 was adapted to form eight food groups as shown in Table A5.6. For simplicity of presentation, a number of the food groups were combined into broader groups. For instance, the group “staple foods” includes the subgroups “cereals and their products” and “roots, tubers, plantains and their products”. The group “animal source foods” is composed of the subgroups “milk and milk products”, “eggs and their products”, “fish, shellfish and their products”, “meat and meat products” and “insects, grubs and their products” and so forth. The group “sweets, condiments and beverages” is composed of the subgroups “sweets and sugars”, “spices and condiments” and “beverages”. “Food away from home” comprises prepared foods consumed away from home, which is specifically identified in household surveys. Table A5.6 shows the food group aggregates used in Section 4.1, along with their food group names which are simplified for presentation purposes in figures and tables.
Table A5.5FAO/WHO GIFT food group level aggregates

SOURCE: FAO. 2022. FAO/WHO Global Individual Food consumption data Tool (FAO/WHO GIFT): methodological document. Rome. www.fao.org/3/cb8809en/cb8809en.pdf
Table A5.6Summary of food group aggregates and terminology of food groups used in Section 4.1
SOURCE: Dolislager, M.J, Holleman, C., Liverpool-Tasie, L.S.O. & Reardon, T. 2023. Analysis of food demand and supply across the rural–urban continuum in selected countries in Africa. Background paper for The State of Food Security and Nutrition in the World 2023. FAO Agricultural Development Economics Working Paper 23-09. Rome, FAO.
D. Data and methodology behind analysis in Box 6
The analysis of moderate or severe food insecurity based on the FIES across the rural–urban continuum (URCA) is based on data collected by IFAD between 2019 and 2021 on small-scale producer households and communities including beneficiaries as well as non-beneficiaries (that are used as counterfactual groups) in ex post rural project impact assessments.bi The data are comprehensive household-level data with detailed GPS coordinates collected from 21 rural development projects implemented in countries from most regions of the world.
The projects are selected for impact assessments to be representative of IFAD’s overall project portfolio. Sample sizes range between 1 500 and 3 000 households and around 150 to 300 communities per project. They consist of detailed information related to sociodemographic, economic, and social capital variables, including information on household dietary diversity and food insecurity experiences as captured by the FIES,48 which were available for 21 countries.bj The FIES survey module was used, composed of eight questions about respondents’ experiences facing constrained access to food during the 12 months preceding data collection. Respondents were classified into three categories: 1) food secure or only mildly food insecure; 2) moderately food insecure; and 3) severely food insecure, following standard methodology.49

