


The Sustainable Development Goals and fisheries and aquaculture
The 2030 Agenda for Sustainable Development continues to shape the strategies of countries, international organizations and civil society, striving for a fair, prosperous and sustainable world. Its 17 Sustainable Development Goals (SDGs) and their related targets and indicators are central to the achievement of inclusive, sustainable economic growth that encompasses environmental, economic and social concerns.
The success of the SDGs rests to a large extent on an effective monitoring, review and follow-up process. The 2030 Agenda sets in place a global reporting structure that includes inputs at local, national and regional levels and culminates in the United Nations High-Level Political Forum on Sustainable Development (HLPF). SDG indicators are the foundation of this global framework for mutual accountability. A global indicator framework comprising 230 indicators to monitor the SDGs’ 169 targets was set up by the United Nations Statistical Commission in March 2016. Reflecting the 2030 Agenda’s guiding principle of “leaving no one behind”, indicators are set to be disaggregated by gender, age, income, geography, occupation and other aspects of social identity (HLPF, 2022).
The interconnected nature of the SDGs makes them indivisible by nature, with progress in one area supporting and reinforcing progress in another. Hence there is a strong emphasis on integrated approaches to development, and results from related indicators must be jointly evaluated to allow a comprehensive analysis of the impacts and trade-offs between different development paths. This section reviews fisheries and aquaculture in the broader context of related indicators.
The 2030 Agenda acknowledges the key role of food and agriculture in combating hunger and food insecurity and alleviating poverty (FAO, 2022d). A focus on rural development, capacity building and investment in food production systems, including fisheries and aquaculture, is crucial to end poverty and hunger and bring about sustainable development. As the COVID-19 pandemic unfolds, progress unfortunately remains insufficient and urgent transformative actions are required. In this regard, given the relevance of all 17 SDGs for FAO’s mandate, the Organization’s Strategic Framework 2022–2031 has been fully aligned towards supporting achievement of the 2030 Agenda. This logically dovetails with FAO’s role as the custodian agency for 21 SDG indicators1 and as contributing agency to another 5 indicators, spanning SDGs 1, 2, 5, 6, 12, 14 and 15.
Fisheries and aquaculture is a key global food production system, and sustainable management of its resources is central to achieving development that safeguards food security, livelihoods, human dignity and natural resources. Regarding the sustainable use of marine living resources, the FAO Fisheries and Aquaculture Division builds on its global leadership to coordinate work on four indicators (SDG Indicators 14.4.1, 14.6.1, 14.7.1 and 14.b.1) under SDG 14 (Life below water). SDG 14 covers in principle both capture and aquaculture, but the currently defined indicators mostly concern capture fisheries, however noting that SDG Indicator 14.b.1 also encompasses aquaculture. Work and progress under these four indicators, all classified at Tier I level, are dealt with in the following subsections (pp. 160–169).
For aquaculture development, almost all the SDGs are relevant. Despite this, aquaculture’s role in contributing to the SDGs has not always been clearly identified or communicated. Although freshwater aquaculture is already contributing and likely to contribute more to food security than marine fisheries and mariculture does (Zhang et al., 2022), it is often implicit rather than explicit – for example under SDG 2 (Zero hunger) – resulting in limited inclusion in sustainability dialogues. At the recent Global Conference on Aquaculture in Shanghai, participants identified strategic priorities for accelerating sustainable aquaculture development and optimizing aquaculture’s contribution to the SDGs. These priorities include specific targets and indicators requiring attention, not only through the follow-up and review framework of the 2030 Agenda led by the HLPF, but also through the Post-2020 Biodiversity Framework currently being developed by the Convention on Biological Diversity (Box 20).
BOX 20SDG TARGET 2.5 AS IT APPLIES TO GENETIC DIVERSITY OF AQUATIC RESOURCES
Sustainable Development Goal (SDG) 2 is widely known as the Zero Hunger Goal, but it is broader than this, encompassing the achievement of food security and the promotion of sustainable agriculture. Given that biodiversity underpins our food systems, its effective management is critical to our future food security, and this is recognized in SDG Target 2.5: By 2020, maintain the genetic diversity of seeds, cultivated plants and farmed and domesticated animals and their related wild species … and promote access to and fair and equitable sharing of benefits arising from the utilization of genetic resources … .
While acknowledging that, compared with terrestrial farming, aquaculture is a young form of food production, biodiversity is as important to aquatic as it is to terrestrial food systems. Although not explicitly excluded in the wording of SDG Target 2.5, aquatic genetic diversity has not been included when assessing progress against the achievement of SDG Target 2.5, mainly because no specific indicators have been developed for this purpose. The indicators associated with SDG Target 2.5 relate only to the number of plant and animal genetic resources for food and agriculture secured in conservation facilities, and the risk status of livestock breeds. Such measures are quantified through existing information systems on plant and animal genetic resources (FAO’s systems are WIEWS1 and DAD-IS2).
As indicated in the first ever global assessment of aquatic genetic resources (AqGR) in 2019,3 the information that could be used to develop indicators for the maintenance of genetic diversity in aquatic resources used for food and agriculture is currently unavailable or very limited in scope. FAO is addressing this critical knowledge gap through the development of AquaGRIS, a global information system for AqGR. The prototype4 developed is currently being transformed into a fully functional information system which will include the capacity to generate as yet undefined indicators of the status of management of AqGR.
Together with 21 other SDG targets, SDG Target 2.5 expired in 2020 with relative progress unfortunately negligible.5 Given the important role that aquatic food plays in human nutrition and food security, it is vital that aquatic diversity also be incorporated into the Post-2020 Biodiversity Framework currently being developed by the Parties to the Convention on Biological Diversity.
- 1 WIEWS (World Information and Early Warning System on Plant Genetic Resources for Food and Agriculture): www.fao.org/wiews/en
- 2 DAD-IS (Domestic Animal Diversity Information System): www.fao.org/dad-is/en
- 3 FAO. 2019. The State of the World’s Aquatic Genetic Resources for Food and Agriculture. FAO Commission on Genetic Resources for Food and Agriculture assessments. Rome. https://doi.org/10.4060/CA5256EN
- 4 A prototype of AquaGRIS with data on a limited number of species is available at: www.fao.org/fishery/aquagris/home
- 5 For further details, see: https://unstats.un.org/sdgs/report/2020/progress-summary-for-SDG-targets
Similarly, inland fisheries and the role of freshwater systems as providers of food and nutrition are absent from current SDG texts, despite their relevance to numerous SDGs, in particular SDG 2 (Zero hunger), SDG 6 (Clean water and sanitation), SDG 12 (Responsible consumption and production) and SDG 15 (Life on land). It is crucial to fully account the contribution of all aquatic food2 production systems to achieving the 2030 Agenda, in particular by further integrating the development of aquaculture into national policies.
Six indicators of SDG 14 are under the custodianship of agencies other than FAO. The United Nations Environment Programme (UNEP) is the principal custodian for three of these (SDG Indicators 14.1.1, 14.2.1 and 14.5.1) and the Intergovernmental Oceanographic Commission (IOC-UNESCO) for two (SDG Indicators 14.3.1 and 14.a.1). For the indicators for which time series are available, those that measure environmental degradation (SDG Indicators 14.1.1 and 14.3.1) reveal worsening trends, accelerating the rates of pollution. The only SDG for which there has been clear progress relates to protection of marine environments (SDG Indicator 14.5.1), testimony of a strong political will to enact national legislation. In this regard, however, when evaluating whether to close access to marine waters, the needs of fishers and local communities should be fully considered in order to mitigate the impact on livelihoods and food supply. FAO contributes to these indicators, as described in Box 21.
BOX 21FAO CONTRIBUTIONS TO SDG 14 CONSERVATION INDICATORS ON BIODIVERSITY AND ECOSYSTEM FUNCTION
Sustainable Development Goal (SDG) 14 (Life below water) has seven targets (plus three means of implementation) dedicated to humanity’s interactions with the ocean. Many of these cover actions directed at conservation and environmental health, but also concern issues of equity in access to resources and markets and knowledge sharing.
Much of the necessary knowledge is already available for taking the first steps to remove, adapt to or mitigate recognized impacts on the ocean environment. However, in many cases more work is needed to record change in the status and pressures around each issue and report on progress across developed and developing countries.
Beyond work directly focused on fisheries, FAO contributes to understanding and minimizing the impacts of ocean acidification and pollution, enhancing effective area management for the conservation of biodiversity, and strengthening implementation of global agreements on biodiversity and climate. These actions complement work on managing fisheries and synergize with international agreements on trade issues and strengthening of governance.
With regard to SDG Target 14.1 on preventing and reducing marine pollution, most excess outflow of nutrients and solid waste, such as plastics, originates from land. Nevertheless, FAO and partners are developing interventions to reduce waste in aquatic production systems through global initiatives such as the marking of fishing gears and are seeking novel approaches to understand and mitigate the impact of some forms of plastics (i.e. microplastics), in particular on aquatic animals and human health.
Regarding ocean acidification and climate change (SDG Target 14.3), FAO supports Members and the United Nations Framework Convention on Climate Change to monitor and report the rate, magnitude and extent of change, as well as the full impact of greenhouse gas pollution on ocean and fishery variables. The capacity to inform climate-related decisions at management-relevant scales is still a challenge, although efforts to enhance observations and share data and information are well underway.
To improve marine and coastal environmental management (SDG Target 14.2), including spatial management (SDG Target 14.5), FAO facilitates general understanding of how tenure, access, user rights and use of the newly defined other effective area-based conservation measures (OECMs) of the Convention on Biodiversity can bolster opportunities for reaching biodiversity goals that have a 2030 milestone for delivery. To achieve environmental objectives, FAO promotes the use of the full range of management tools to hand, including fisheries management ones, while mainstreaming considerations for biodiversity across all management, leveraging wide institutional cooperation where possible (e.g. between regional seas conventions and action plans and regional fishery bodies and large marine ecosystem projects).
Lastly, in terms of SDG 14 conservation-focused indicators, FAO supports increase of scientific knowledge and development of research capacity (SDG Target 14.a) to enable innovative, inclusive, effective and adaptive management action to face growing external pressures on marine and inland aquatic systems, as articulated in the 2021 COFI Declaration for Sustainable Fisheries and Aquaculture.1
Finally, the United Nations Secretariat is the custodian for SDG Indicator 14.c.1, which focuses on enhancing conservation and sustainable use of oceans and their resources by implementing international law as reflected in the United Nations Convention on the Law of the Sea. FAO provides inputs to SDG Indicator 14.c.1 in the form of methodological support for certain data elements. However, as only 2021 data are available for this indicator, it is not yet possible to comment on trends or progress. In general, it is difficult to ascertain the status of the indicators that are still classified as Tier II.
Regarding the status of progress on SDGs of relevance for fisheries and aquaculture (other than SDG 14), it is now evident that many of the goals set out in the 2030 Agenda are not on track to be realized within their time frames (United Nations, 2021a). While there has been progress in key areas, there has been regression in others. Moreover, the COVID-19 pandemic has reversed previously favourable trends, further delaying the achievement of targets and worsening more laggard indicators. The underlying threats from climate change, biodiversity loss and pollution, together with direct threats from human conflict, demand decisive action, but the advent of the pandemic and lack of progress in many areas of international development and cooperation have compounded the problem. Regarding SDG 1 (No poverty), consistent progress was being made and the global rate had fallen from 9.9 percent in 2015 to 8.2 percent in 2019 and was predicted to reach 6 percent in 2030. However, 2020 saw the first year-on-year rise in 20 years, with an additional 119 million people pushed into extreme poverty. As for SDG 2 (Zero hunger), global food security rates have been worsening since 2014: as many as 811 million people in the world faced hunger in 2020, with significant deterioration in sub-Saharan Africa and Latin America; and future projections predict increasing challenges as a result of conflicts, climate change and biodiversity loss. The pandemic has directly reduced incomes, disrupted supply chains, worsened nutritional status and brought suffering to many. Notably, the gap in food security between men and women increased from 6 percent in 2019 to 10 percent in 2020.
There are nevertheless some positive stories to be told. The world is generally a better place to live in now than it was at the turn of the century, with less poverty, greater access to education and lower child mortality. Access to safe drinking water has improved, maternal mortality is declining, albeit at a slower rate than needed, and HIV prevalence continues to diminish. In addition, the COVID-19 pandemic has revealed enormous community resilience, and workers in food supply chains have been appraised for their key role in society. Social protection schemes have been massively expanded while large parts of society have started to adjust to digital transformation. Awareness about adoption of cleaner energies and technologies has increased significantly. These advances, in addition to the success of vaccine development through international collaboration, have shown that together we can build back better and stronger and deliver on the 2030 Agenda for a more sustainable future for all.
SDG Indicator 14.4.1 – quantifying fish stocks within biologically sustainable levels
SDG Indicator 14.4.1 measures the sustainability of the world’s marine capture fisheries by their abundance (FAO, 2022e). This indicator, well established since 1974 at the global and regional levels, has been regularly reported by FAO in its biennial publication The State of World Fisheries and Aquaculture. SDG Indicator 14.4.1 measures the sustainability of fish stocks and as such is an end measure of fisheries’ biological sustainability – the most fundamental pillar of sustainability upon which eventually depend fisheries’ economic and social sustainability. The indicator’s temporal trend can show clearly changes and progress towards SDG Target 14.43 and facilitate the evaluation of the global effectiveness and efficiency of past fishery policies and management. Its horizontal comparisons between regions or among countries can help identify hotspots that lack progress and deserve more attention.
SDG 14 (Life below water) had a target of 100 percent of fish stocks within biologically sustainable levels by 2020. The latest assessment of the global indicator (see the section The status of fishery resources) indicates that the 2020 target was not achieved (UNSD, 2022a). This failure calls for the world community to redouble its commitments and mobilize its efforts.
Under the 2030 Agenda, the country-led decision to expand the indicator to the national level comes together with a legitimate expectation, expressed at the Thirty-fourth Session of the Committee on Fisheries (February 2021), that the classic indicator of The State of World Fisheries and Aquaculture be revised so as to better consider national indicators. Indeed, FAO is currently revising its methodology for estimating regional and global indicators (see Box 3). The adoption of the indicator at the national level is a unique opportunity for countries to integrate in their policy framework a tool to monitor the status of their fishery resources, using consistent and comparable approaches.
In 2019–2020, FAO piloted a first questionnaire call to facilitate harmonized and consistent reporting by countries on the indicator. Of the 164 countries with maritime coastlines, 98 (i.e. 60 percent) expressed interest in the indicator and 86 reported data that (for 84 of these) could be reviewed by FAO and quality assured for validation (Box 22) before being reported to the United Nations Statistics Division (UNSD) in March 2022. In the published results (UNSD, 2022b), the indicators were validated for 36 countries which passed both first and second levels of quality assurance. For the 29 countries which passed only the first level of quality assurance, the indicator was reported but flagged as unreliable. Finally, 18 countries failed to pass the first level of quality assurance and the indicator could therefore not be calculated. This first reporting exercise revealed the challenges faced by countries in determining stock status: deficiencies in fisheries data collection and management including lack of coordination among agencies involved; insufficient scientific expertise to effectively conduct stock assessment; and organizational and internal communication pitfalls resulting in poor consultation among stakeholders on the reporting process.
BOX 22QUALITY ASSURANCE PROCESS FOR SDG 14.4.1 NATIONAL INDICATORS
The review of the questionnaires for quality assurance (QA) comprises two main steps: first, assessment of the completeness and quality of the information provided by participating countries (quality assurance level 1 or QA1); and second, assessment of the reliability, robustness and transparency of the data and information provided (quality assurance level 2 or QA2).
Upon receiving a country’s questionnaire submission, it is reviewed for its compliance to guidelines and precision of content, specifically regarding inconsistent, incomplete or unclear entries, missing mandatory fields, or issues reporting the reference list of stocks. Feedback is given to each country, which has an opportunity to respond, edit and improve the questionnaire to the highest possible standard considering the data and human resources available.
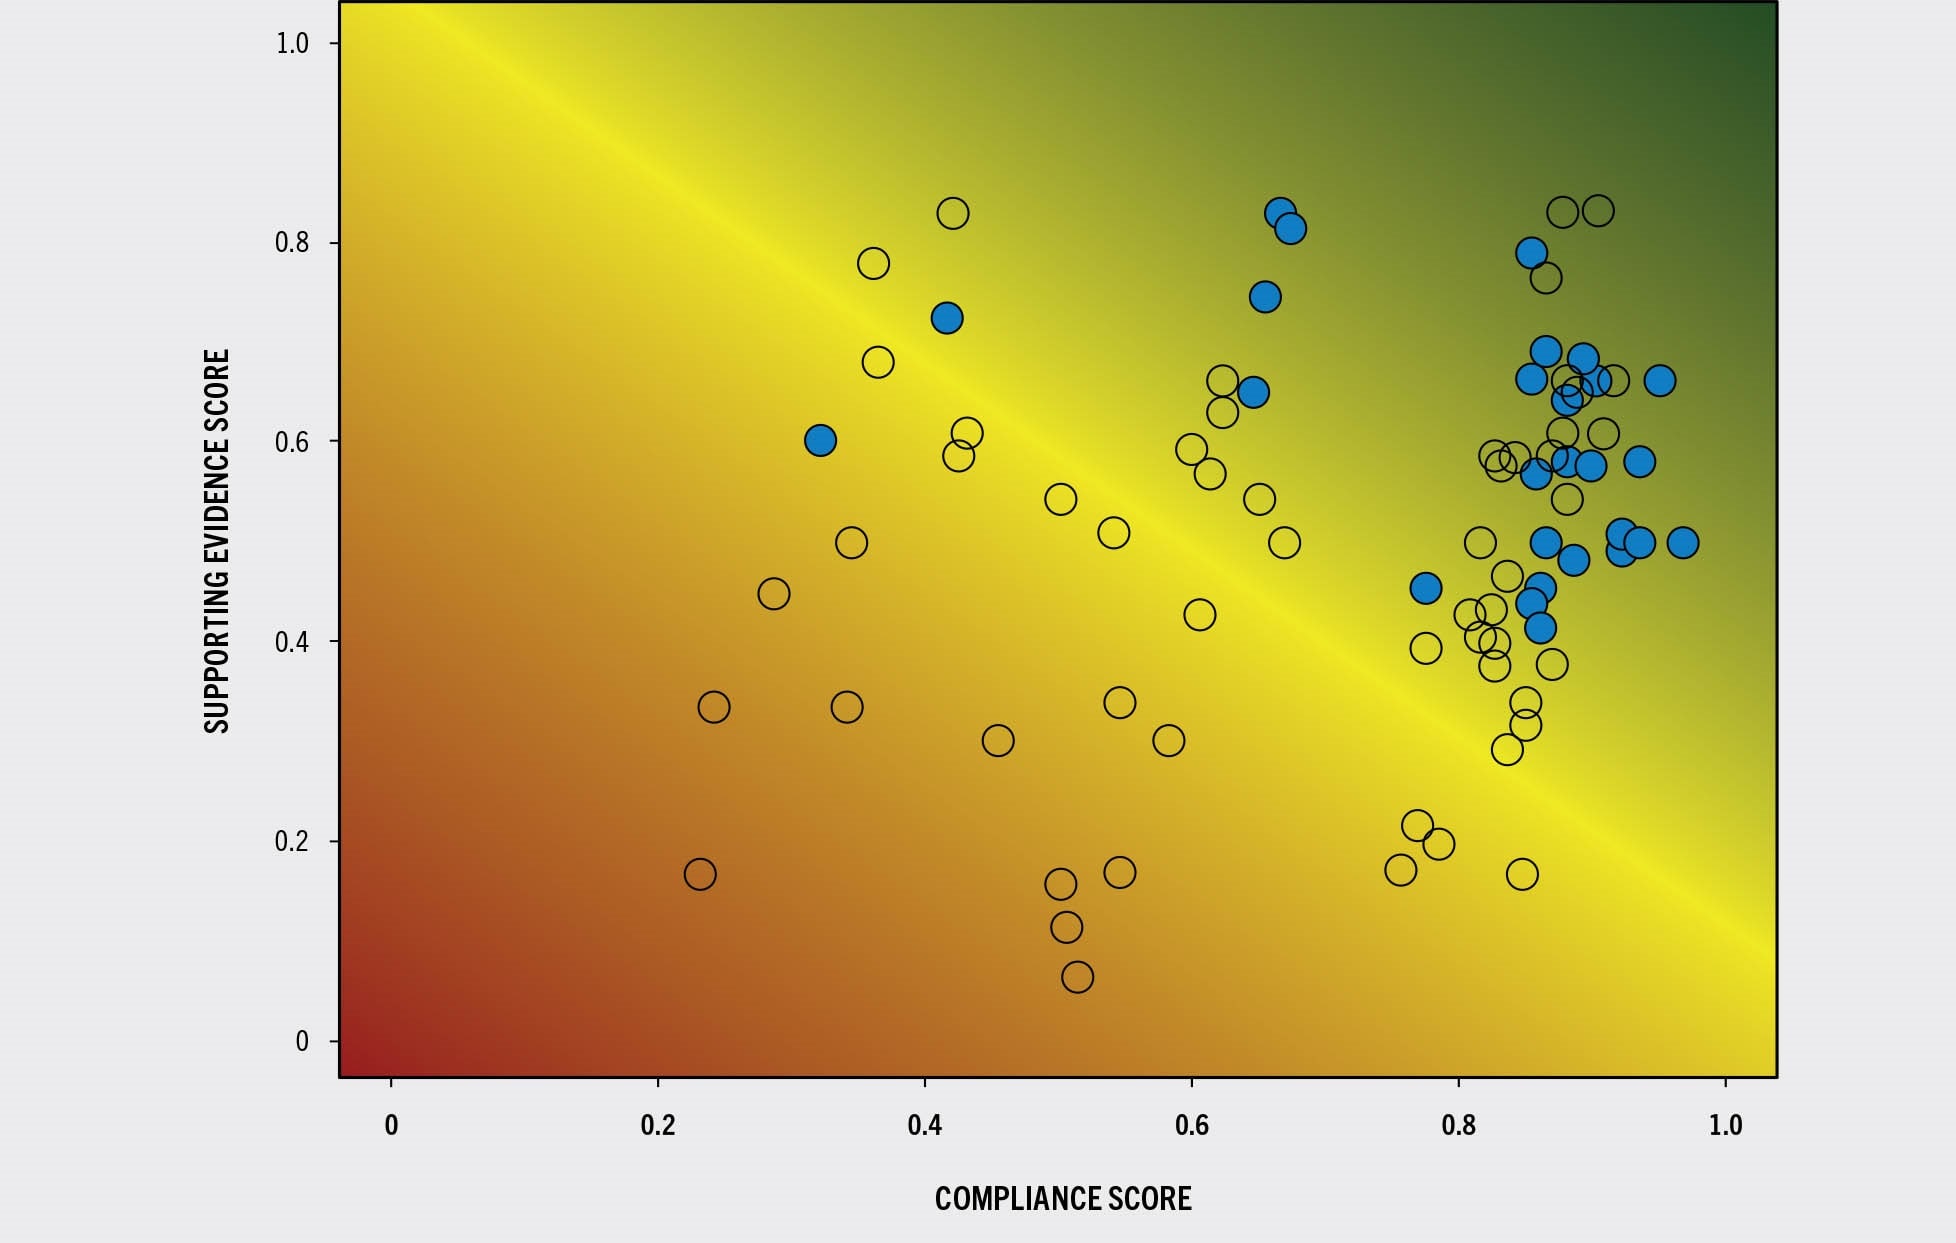
Each questionnaire is then assessed relative to objective criteria to score its compliance with the monitoring guidelines and the potential of the supporting evidence for assessing the reliability of the reported content against existing, alternative information (see figure). This score represents the level of confidence attributed to the national reporting and is based on: (i) the availability of stock status information of the reference list of stocks (i.e. known vs unknown status); (ii) the reliability of the method (i.e. formal assessment; grey data or catch trend analysis; or black data and qualitative assessment/expert judgement forming the basis of the stock status classification); (iii) the existence and availability of reference sources to validate the assessment outputs; and (iv) the amount of data and information provided at the stock level.
The results of this QA1 can then be used to support onward QA2 analyses, which check the consistency of inputs with other known sources of information and may include: (i) checks on the assessment outputs against stock assessment reports that are publicly available or accessible to FAO; or (ii) a regional expert review to verify the reference list of stocks, provide knowledge on assessments performed (i.e. reliability of the assessment) or provide knowledge on data availability and quality. The results of the QA2 will also allow regional experts to provide insights into where to direct capacity development efforts in monitoring and reporting on SDG Indicator 14.4.1.
Upon validation, each stock is finally assigned a unique identifier in the Global Record of Stocks and Fisheries to facilitate data management, quality assurance and monitoring in future reporting rounds.
SDG Indicator 14.4.1 – quality assurance process
SOURCE: FAO.
Indeed, SDG Indicator 14.4.1 is relatively complex and national reporting is hindered by limited national capacities. In its role as custodian agency of several SDG 14 indicators, FAO is committed to supporting countries to strengthen their capacities to collect data, conduct assessments and estimate SDG Indicator 14.4.1 at the national level. In this respect, FAO first invested in applying methodologies for assessment in data-limited situations and in developing methodologies for reporting on the national indicator (UNSD, 2022c). FAO then implemented a suite of capacity development tools and activities: the SDG Indicator 14.4.1 e-learning course was published in multiple languages (FAO, 2020f); the online FAO stock monitoring tool was developed enabling trainees to practise several data-limited methods; and a series of eight regional or language-based capacity development workshops, attended by more than 70 countries and 500 participants, were held face-to-face or online, between the end of 2019 and early 2022. Alongside, FAO and regional fishery bodies (RFBs) strengthen through the Fisheries and Resources Monitoring System the dissemination of available information on individual stock status and the framework for information and data exchange at various levels, with the goal to support the monitoring of SDG Indicator 14.4.1, and to facilitate RFBs’ involvement in accompanying a progressive convergence between global–regional indicators and national estimates.
A new questionnaire dispatch is planned for 2022, with improvements based on countries’ feedback and lessons learned from the first call.
A convergence of the two distinct processes of countries reporting their national indices and FAO estimating the regional indices is, to the extent possible, desirable but will need to follow a progressive pathway. The current regional and global estimates of sustainable fishery stocks cannot be aggregated from country data submitted through the questionnaire because of quality concerns, and this practice will remain for the foreseeable future. With the adoption of FAO’s revised methodology (see Box 3), and once FAO has gathered enough high reliability country estimates in the medium-to-long term, relevant data reported by countries can be combined with RFB data and other sources to adjust the regional estimates. This is expected to strengthen the reliability of FAO data and encourage more countries to report as they see their data being effectively used. As a result, disaggregation of regional and global estimates may become feasible by country, thus meeting the requirements set by UNSD.
SDG Indicator 14.6.1 – assessing degree of implementation of international instruments to combat illegal, unreported and unregulated fishing
Illegal, unreported and unregulated (IUU) fishing remains one of the greatest threats to aquatic ecosystems and to fishers and communities who rely on their resources for nutrition and livelihoods. This is due to its potent ability to undermine national and regional efforts to manage fisheries sustainably and conserve marine biodiversity (FAO, 2022f).
Relevant international instruments are key to combating IUU fishing. In this regard, SDG Indicator 14.6.1 measures the degree of implementation by States of five of the principal instruments. The methodology (UNSD, 2022d), approved by States in April 2018 through the Inter-agency and Expert Group on SDG Indicators, aims to provide an effective and globally relevant indicator for measuring progress while minimizing the reporting burden placed on States. Questions used for this indicator were integrated into the longstanding Committee on Fisheries (COFI) questionnaire for monitoring the implementation of the Code of Conduct for Responsible Fisheries and related instruments. In line with guidance issued by COFI at its Thirty-second and Thirty-fourth Sessions, only scores validated by the respective countries are included within the submission to the United Nations Statistics Division (UNSD) and are considered in the following analysis.
Between 2018 and 2022, the average degree of implementation of international instruments to combat IUU fishing as measured by the indicator has improved across the world (UNSD, 2022b; Figure 61). In this period, the global aggregated indicator has risen from 3 to 4 (out of a maximum score of 5). Based on their reporting for SDG Indicator 14.6.1, States have thus made good overall progress in carrying out the recommended measures to combat IUU fishing, with close to 75 percent scoring highly in their degree of implementation of relevant international instruments in 2022 compared with 70 percent in 2018. Small island developing States, faced with specific challenges in fully implementing these instruments due to the large amounts of waters under their jurisdiction, registered an improvement from a medium level of implementation in 2018 and 2020 to a high level in 2022. In the case of least developed countries, which often face challenges to implement these instruments, implementation has remained at a medium level from 2018 through to 2022. In terms of regional groupings, fluctuation can be seen over the years in certain regions and no clear trend can be noted in the aggregate levels of implementation.
FIGURE 61PROGRESS IN THE DEGREE OF IMPLEMENTATION OF INTERNATIONAL INSTRUMENTS AIMED AT COMBATING IUU FISHING BY REGION, 2018–2022 (SDG INDICATOR 14.6.1)
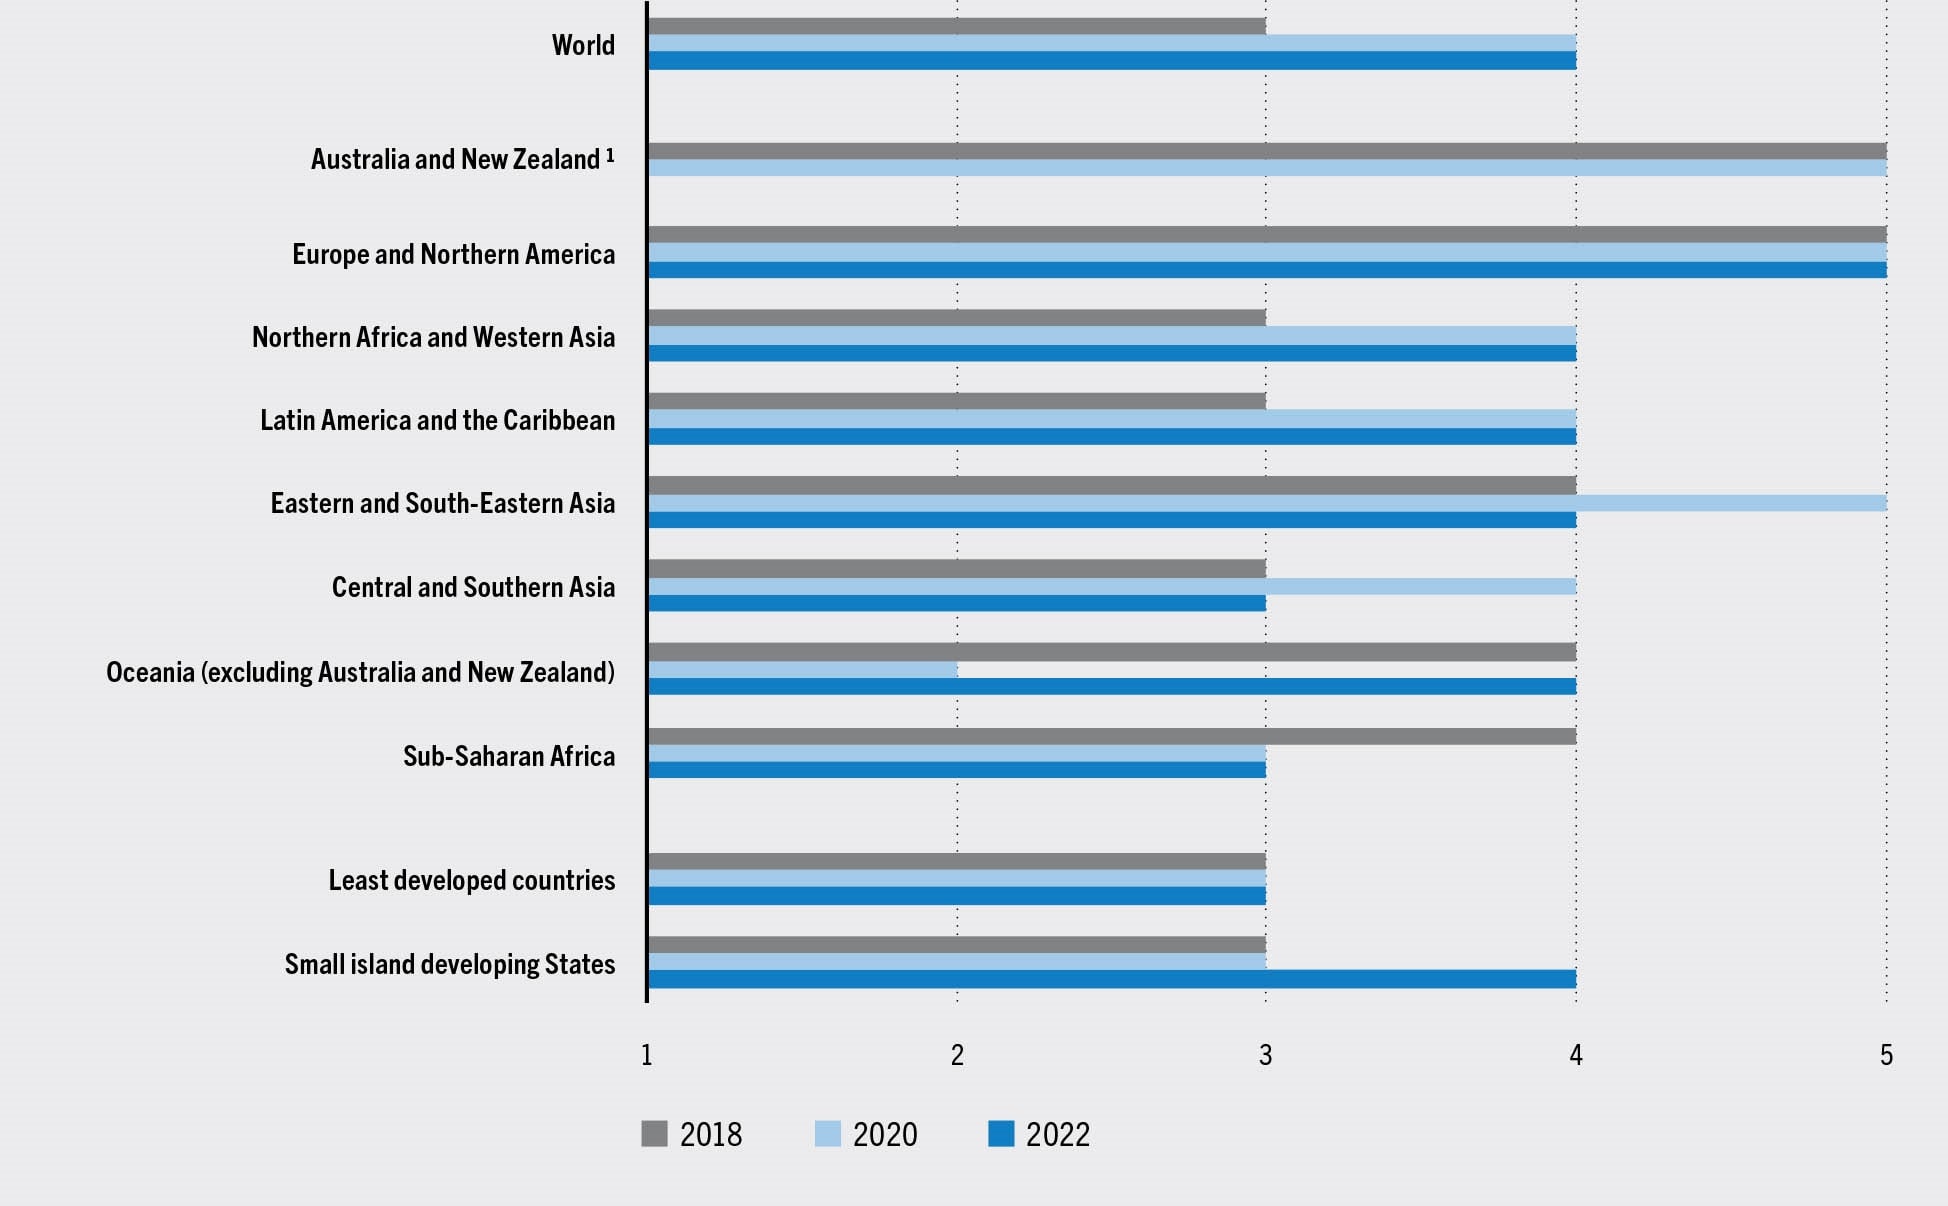
NOTE: The chart shows the average level of implementation of the indicator by countries within each grouping, from the lowest level (1) to the highest level (5).
SOURCE: FAO.
The global figures on SDG Indicator 14.6.1 are based on scores from approximately 50 percent of the total number of FAO Member States, with the exception of 2018 when reporting States reached 60 percent. While these figures reflect an overall improvement, differences in the number and composition of reporting States within a particular regional grouping could affect the indicator and explain the fluctuations observed in certain regional scores over the years. For example, Table 16 shows that between 2018 and 2022 there was a notable drop in the number of relevant States reporting on the indicator in Central and Southern Asia (from 7 to 2) and sub-Saharan Africa (from 18 to 9). To alleviate this limitation and allow for a more accurate trend analysis of progress made on SDG Indicator 14.6.1, it is necessary to increase the number of States reporting.
TABLE 16TRENDS IN THE RATE OF REPORTING BY FAO MEMBERS ON SDG INDICATOR 14.6.1 BY REGION, 2018–2022
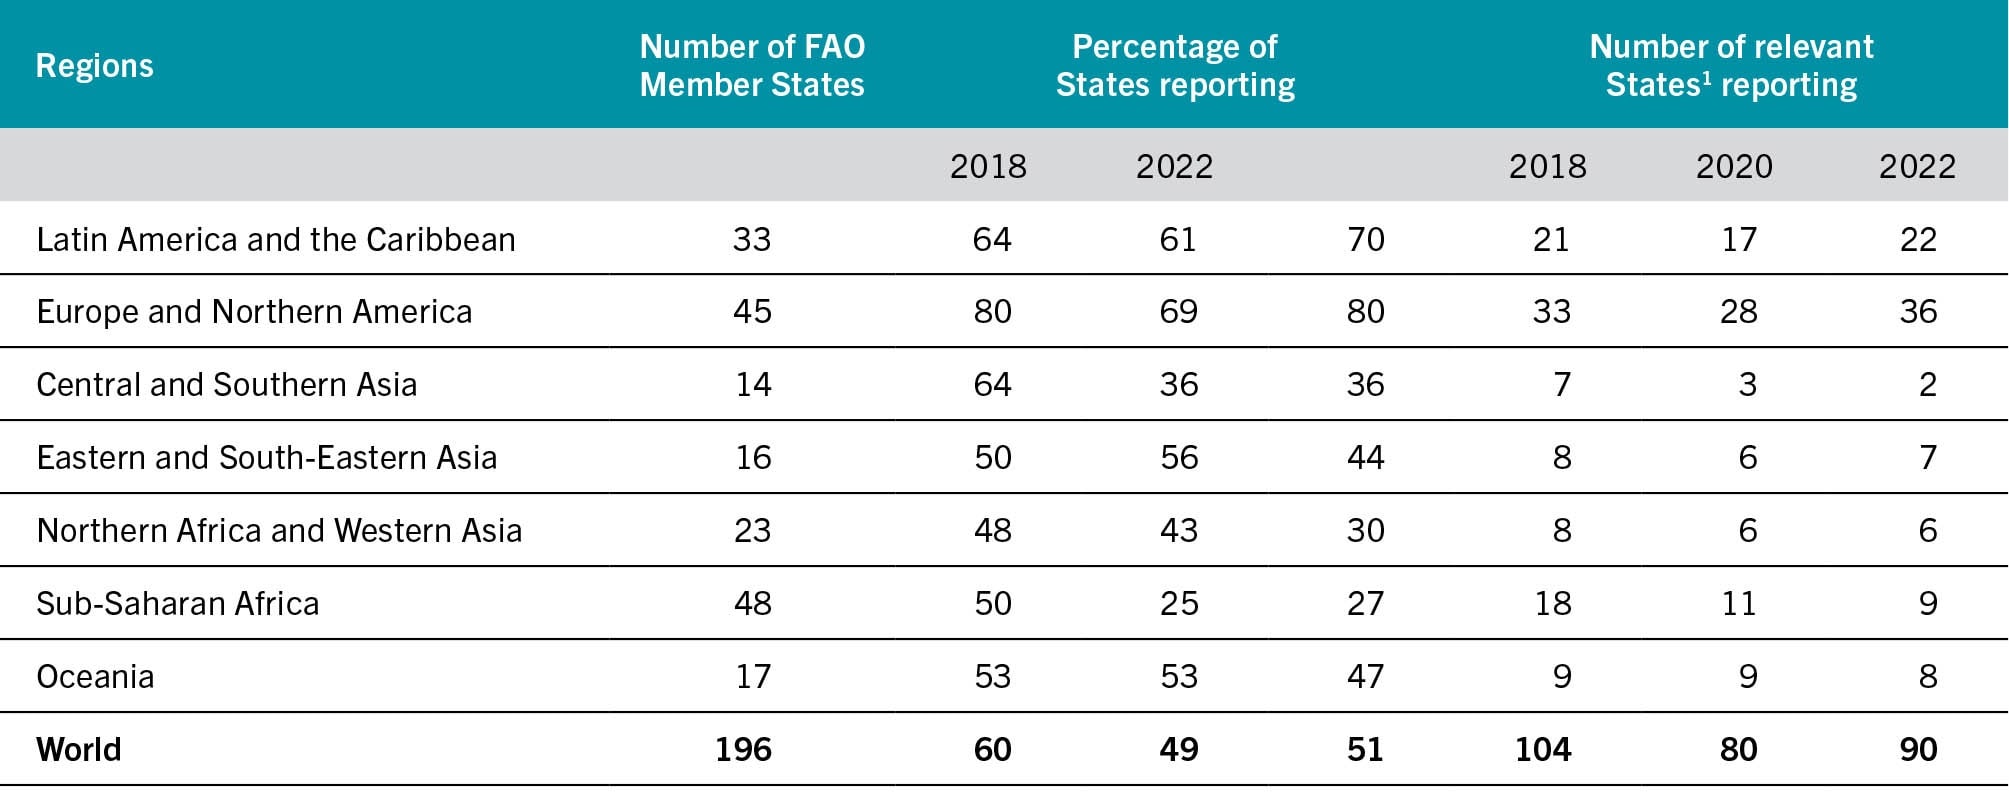
NOTE: Figures include FAO Associate Members.
SOURCE: FAO.
SDG Indicator 14.7.1 – measuring sustainable fisheries contributions to national economies
Fisheries support the livelihoods of millions worldwide, providing an important source of income and food security. Ensuring that fisheries resources are appropriately safeguarded is inextricably linked to their continued contribution to economies and sustainable development, especially for least developed countries (LDCs) and small island developing States (SIDS).
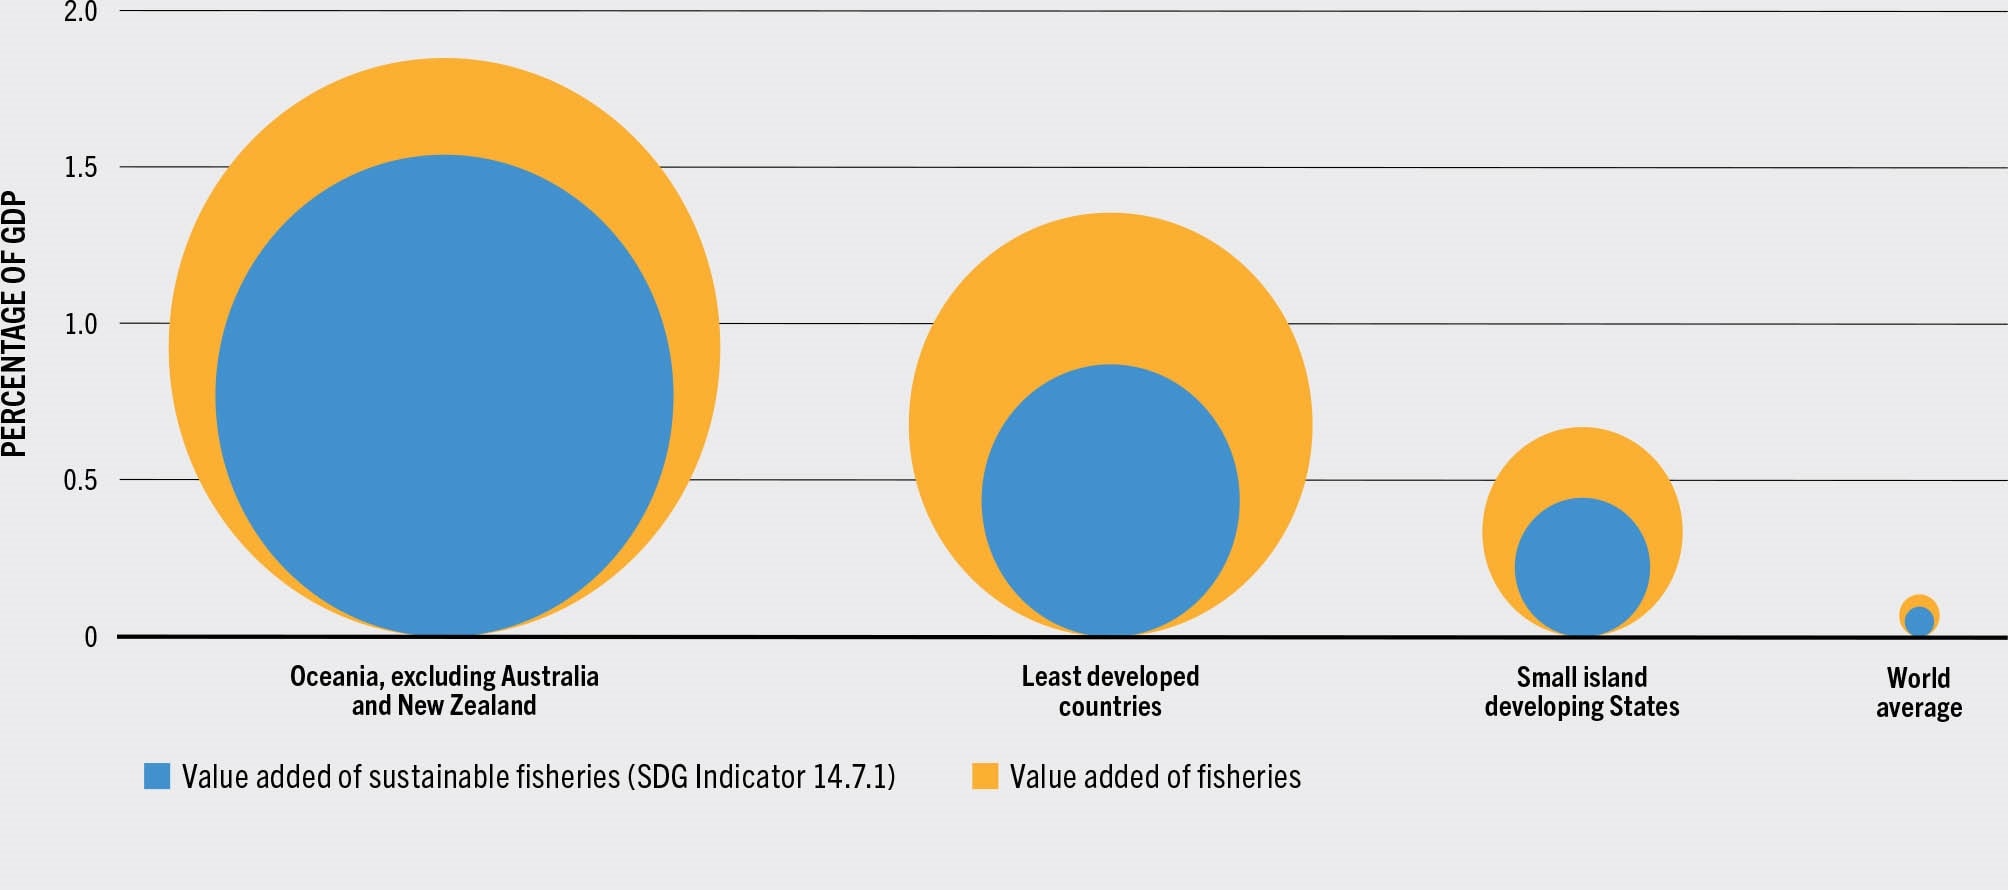
SDG Indicator 14.7.1 (Sustainable fisheries as a percentage of GDP in small island developing States, least developed countries and all countries) combines the value added of fisheries with the biological sustainability of regional stocks into a single, internationally comparable indicator that allows countries to better understand the importance of sustainable fisheries for their national economies (FAO, 2022g). In 2019 (UNSD, 2022b), sustainable fisheries accounted for just under 0.1 percent of gross domestic product (GDP) worldwide, 0.46 percent in SIDS and 0.88 percent in LDCs. The figure is far higher in some countries, such as the Comoros, which saw the value of its sustainable fisheries as a proportion of GDP grow from 4.5 percent in 2011 to 7 percent in 2019.
Central to estimating the value of sustainable fisheries is the biological sustainability of stocks. The sustainable management of fishery stocks remains critical for ensuring that fisheries continue to generate economic growth and support equitable development, meeting the needs of today without compromising future generations.
The production and the value added of the sector have expanded consistently in recent years, generating economic dividends and contributing to sustained economic growth (Figure 62). Yet these economic dividends can only be maintained into the future through prudent management of fishery stocks. Some regions are experiencing significant pressures on their stocks, with Oceania (excluding Australia and New Zealand) – the region where the contribution of sustainable fisheries to national GDP (1.54 percent) is the highest – seeing average sustainability levels falling across the board. This has led to a worsening overall trend for regions such as Eastern and South-Eastern Asia, where sustainable fisheries as a proportion of GDP fell from 1.06 percent in 2011 to 0.80 percent in 2019.
FIGURE 62ECONOMIC CONTRIBUTION OF FISHERIES AND AQUACULTURE, 2019 (SDG INDICATOR 14.7.1)
SOURCE: FAO.
The current methodology for estimating SDG Indicator 14.7.1 provides an international baseline for assessing the sector (UNSD, 2022e). However, adjustments and parallel indicators may better reflect differing national contexts. Whereas currently the regular calculation for the majority of countries relies on the stock status by region, with more national data becoming available for SDG Indicator 14.4.1 (Proportion of fish stocks within biologically sustainable levels), calculation enhancements within SDG Indicator 14.7.1 can be implemented focusing on the multiplier for stock sustainability. Furthermore, there are ongoing country trials to enhance reporting on SDG Indicator 14.7.1 and adjust the indicator to measure GDP and the value of sustainable fisheries for different groups of the population such as women, subsistence fishers and rural workers (Box 23).
BOX 23TOWARDS ENHANCED REPORTING AND EXPANDED COVERAGE ON SDG INDICATOR 14.7.1 THROUGH CAPACITY-BUILDING ACTIONS – COUNTRY EXAMPLES
A key characteristic of SDG Indicator 14.7.1, which measures the economic contribution of sustainable fisheries, is that it does not impose any additional reporting burden on countries. Increased reporting is often expensive and requires governments to weigh up costs and possible benefits. The baseline methodology developed for SDG Indicator 14.7.1 relies solely on information already available from national accounts systems to address these issues and ensure that it has the best global representation possible.
FAO is currently fine-tuning the analysis associated with the indicator methodology by checking the possibility of additional data being reported by countries based on their national context and needs. In partnership with the Secretariat of the Pacific Community, pilot trials are ongoing in Kiribati and Samoa. Like many small island developing States (SIDS), Kiribati and Samoa are both nations with rich fishing histories and where fishing continues to play a critical role in the livelihoods and economic well-being of the population. By collecting the necessary data – including demographic information, the economic value of subsistence fisheries and value addition at each step of the value chain – a better understanding of the true contribution of fisheries to overall GDP and to the livelihoods of different population groups may be formed. Analysing the contribution of women, rural communities and those employed in the sector can significantly enhance the usefulness of the information collected for the industry and policymakers.
Given the varying capacity and trade-off costs for SIDS and other developing countries to collect and provide additional information, any expansion of the current methodology would be done on a case-by-case basis. The experience and lessons learned in tailoring SDG Indicator 14.7.1 to the national context of these Pacific Island countries may serve as a benchmark for other countries facing similar challenges and willing to enhance their understanding of the contribution of fisheries within their national economies and its benefits to different population groups.
SDG Indicator 14.b.1 – assessing degree of recognition and protection of access rights for small-scale fisheries
The year 2022 confirms the importance for SDG Target 14.b of providing access for small-scale artisanal fishers to marine resources and markets. Indeed, 2022 is the International Year of Artisanal Fisheries and Aquaculture (IYAFA), which provides an enormously important platform to make progress in the degree of application of a legal/regulatory/policy/institutional framework which recognizes and protects access rights for small-scale fisheries, as measured through SDG Indicator 14.b.1 (UNSD, 2022f).
Since 2015, most regions have expanded the adoption of regulatory frameworks supporting small-scale fisheries and promoting participatory decision-making processes (Figure 63). The average global score for SDG Indicator 14.b.1 reveals an increasing trend, for which reporting by countries has risen from 3 (out of a maximum of 5) in 2018 to 4 in 2020 and then to 5 in 2022 (UNSD, 2022b). At the regional level, overall scoring has remained stable or improved. However, Northern Africa and Western Asia scored lower in 2022 than in 2020.
FIGURE 63PROGRESS IN THE DEGREE OF APPLICATION OF A LEGAL/REGULATORY/POLICY/INSTITUTIONAL FRAMEWORK WHICH RECOGNIZES AND PROTECTS ACCESS RIGHTS FOR SMALL-SCALE FISHERIES BY REGION, 2018–2022 (SDG INDICATOR 14.B.1)
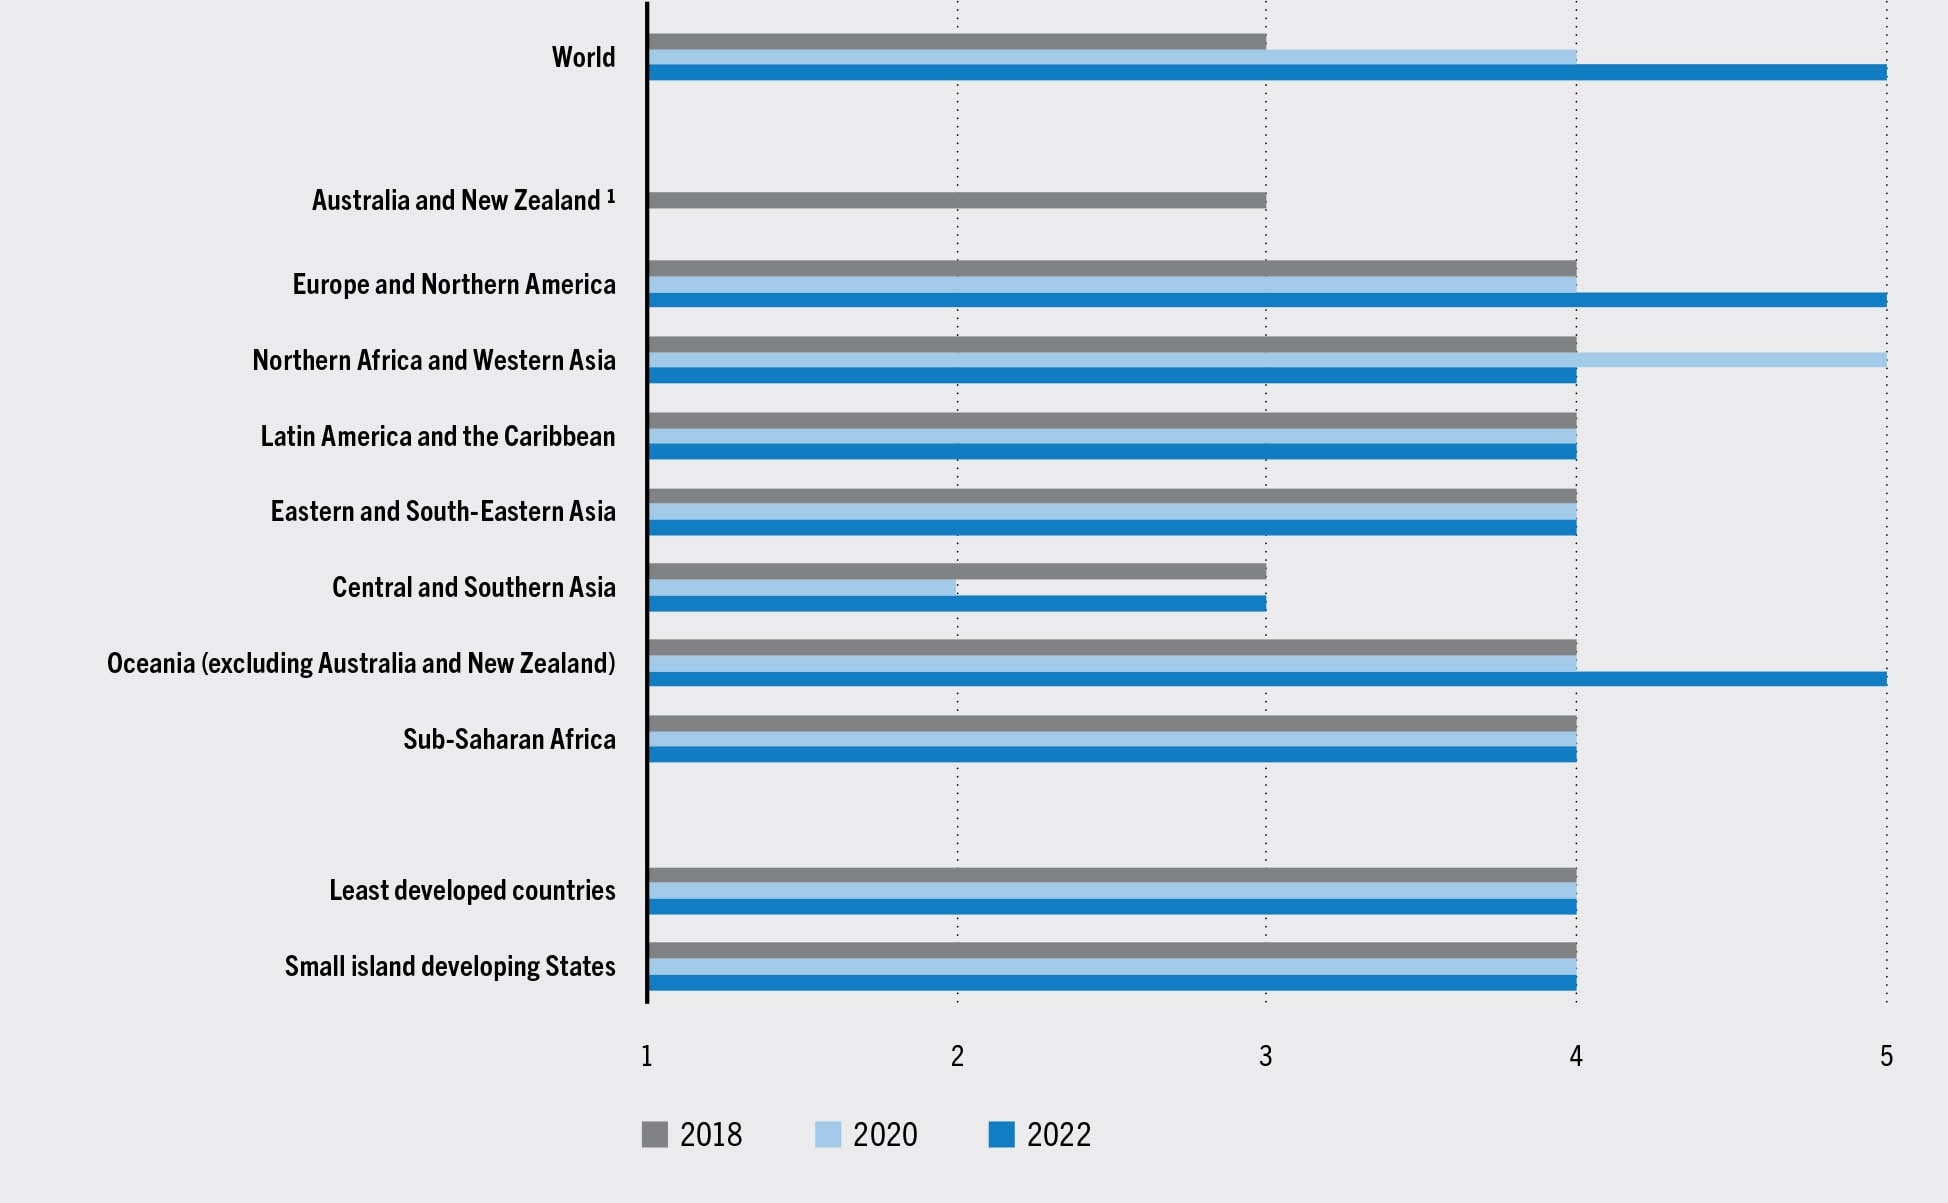
NOTE: The chart shows the average level of implementation of the indicator by countries within each grouping, from the lowest level (1) to the highest level (5).
SOURCE: FAO.
While these figures reflect an overall improvement, it is important to also consider the reporting rate (Table 17). At the global level, the percentage of States reporting has remained relatively stable over the years, with 52 percent reporting in 2022 and 2020 compared with 63 percent in 2018 (FAO, 2022h). Within a particular regional grouping, differences in the number and composition of reporting States could affect the indicator and explain the fluctuations of regression or improvement observed in certain regional scores over the years. Average scores in 2022 for Central and Southern Asia, Northern Africa and Western Asia, and sub-Saharan Africa are the least likely to be representative of the region, considering the drop in the number of relevant States reporting between 2018 and 2022 within these regions, respectively, from 9 to 5, 10 to 7, and 26 to 13. It is thus clear that efforts need to be redoubled and there is no room for complacency.
TABLE 17TRENDS IN THE RATE OF REPORTING BY FAO MEMBERS ON SDG INDICATOR 14.B.1 BY REGION, 2018–2022
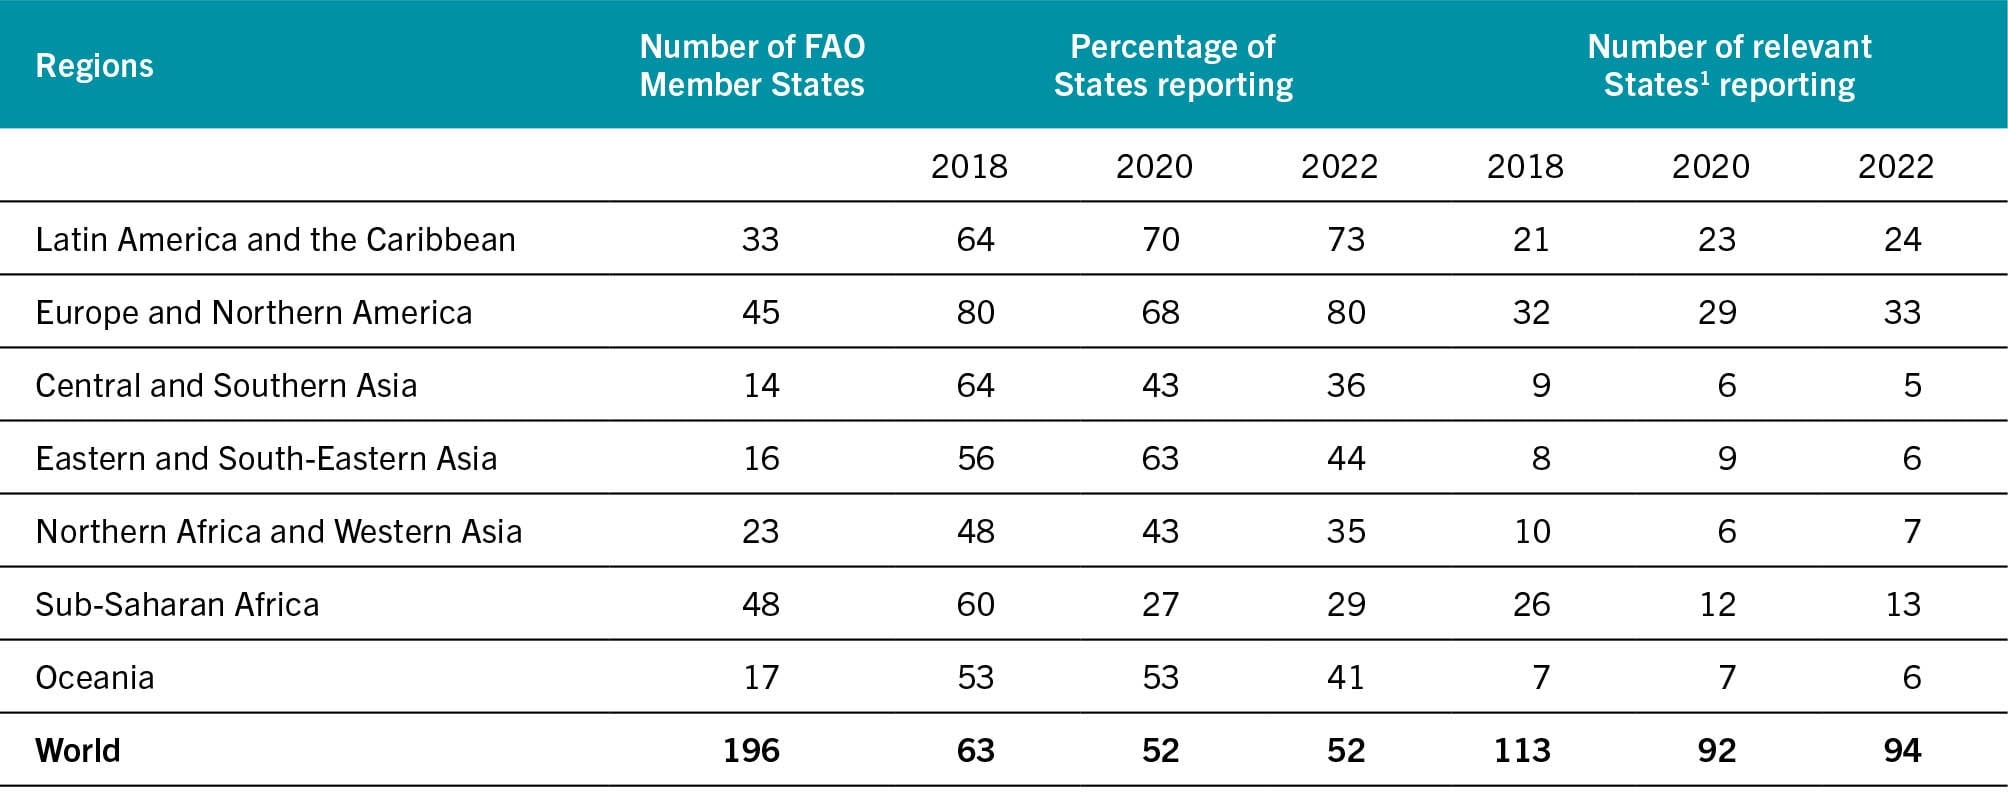
NOTE: Figures include FAO Associate Members.
SOURCE: FAO.
The SDG Indicator 14.b.1 score relies on three main features. The first is the development and application of enabling frameworks, a fundamental prerequisite. This requires, for example, that legislation is supportive of small-scale fisheries. A dedicated section on small-scale fisheries in the FAOLEX Legal Database will be released in 2022 to facilitate legal and regulatory reform in support of small-scale fisheries in the future, while guidance on legislating for sustainable small-scale fisheries (FAO, 2020g, 2022i) is available online. Some countries, such as Cabo Verde, are taking a lead in crafting such legislation, in which the Voluntary Guidelines for Securing Sustainable Small-Scale Fisheries in the Context of Food Security and Poverty Eradication (SSF Guidelines) are specifically included.
Second is the assessment of concrete action in support of small-scale fisheries. A number of countries are taking a strategic approach through the participatory development of National Plans of Action to implement the SSF Guidelines. This is happening for example in the United Republic of Tanzania, Namibia, Madagascar and Malawi (see the section Partnerships to advance the implementation of the Voluntary Guidelines for Securing Sustainable Small-scale Fisheries).
Finally, the score depends on the measurement of the participation of small-scale fisheries actors in decision-making. It is important to recall that while SDG 14 refers only to marine fisheries, inland fisheries would equally benefit from better access to resources and markets. Results from the Illuminating Hidden Harvests (IHH) study (FAO, Duke University and WorldFish, forthcoming; see the section Illuminating Hidden Harvests: the contributions of small-scale fisheries to sustainable development) provide new evidence in this respect. The study highlights the global recognition that co-management is necessary for effective and just governance. Indeed, 35–40 percent of catches from marine and inland small-scale fisheries from 58 IHH country and territory case studies originated from marine and inland fisheries formally governed with provisions for co-management. However, only about one-fifth of fishers in those marine or inland fisheries rate their effective participation as high. This is testimony that an enabling environment alone does not guarantee meaningful participation; it must be enacted also through capacity development and inclusive institutional set-ups.
In addition, the IHH study found that 22 countries (representing 48 percent of global marine capture fisheries production) exported on average almost 26 percent of their marine small-scale fisheries catch by volume in the period 2013–2017. In nine countries (representing 25 percent of global inland capture fisheries production), just over 16 percent on average of the inland small-scale fisheries catch was exported in the same period. This is a first attempt to assess the participation of small-scale fisheries in an increasingly globalized world.
There are numerous other actions in support of achieving SDG Target 14.b, for example, the Regional Plan of Action for Small-Scale Fisheries of the General Fisheries Commission for the Mediterranean (GFCM, 2022), support to the African Continental Non-State Actors Coordination Platform in Fisheries and Aquaculture (AU-IBAR, 2021) and the 2030 Latin America and Caribbean Regional Knowledge Management Platform (ECLAC, 2022). Nevertheless, countries still require much support in their progress towards achieving SDG Target 14.b and reporting on SDG Indicator 14.b.1.

