
In 2020, global capture fisheries production (excluding algae6) was 90.3 million tonnes (Table 1) – a fall of 4.0 percent compared with the average of the previous three years. The decrease concerned both marine capture fisheries and inland waters (3.9 percent and 4.3 percent, respectively) and is most likely due to both the disruption in fishing operations because of the COVID-19 pandemic (Box 2) and the ongoing reduction in China’s catches (10 percent lower in 2020 compared with the average of the previous three years). The 2017–2019 average was high because of the peak experienced in 2018 (96.5 million tonnes) due to relatively high catches of anchoveta (Engraulis ringens). However, the long-term trend in global capture fisheries continues to be relatively stable. Catches have generally fluctuated between 86 million tonnes and 93 million tonnes per year since the late 1980s (Figure 7).
FIGURE 7TRENDS IN GLOBAL CAPTURES
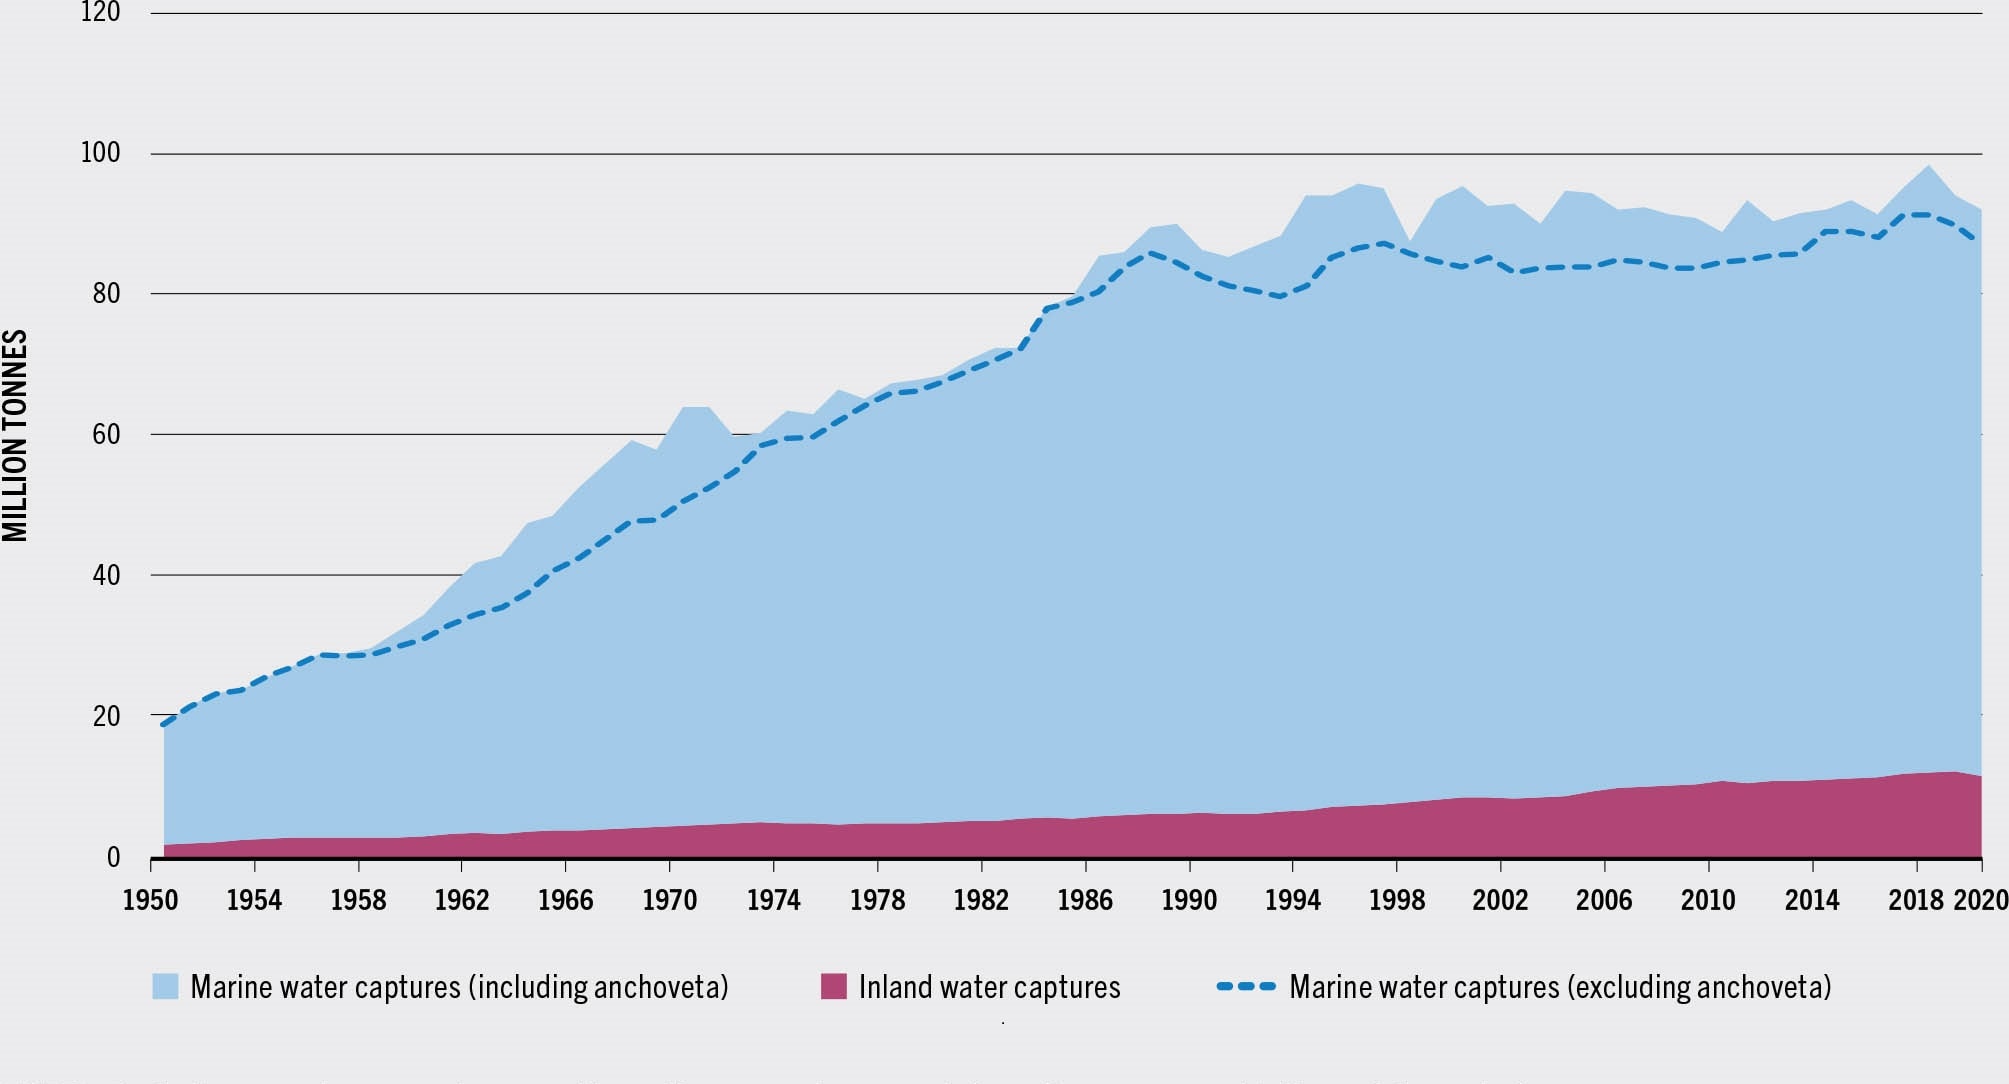
SOURCE: FAO.
China remains the top capture producer despite the downward revision of its catches for the period 2009–20167 and a decline of around 19.3 percent between 2015 and 2020. China accounted for almost 15 percent of global captures in 2020, more than the total captures of the second- and third-ranked countries combined. The top seven capture producers (China, Indonesia, Peru, India, Russian Federation, United States of America and Viet Nam) accounted for almost 49 percent of total global capture production (Figure 8), while the top 20 producers accounted for over 73 percent.
FIGURE 8TOP TEN GLOBAL CAPTURE PRODUCERS, 2020
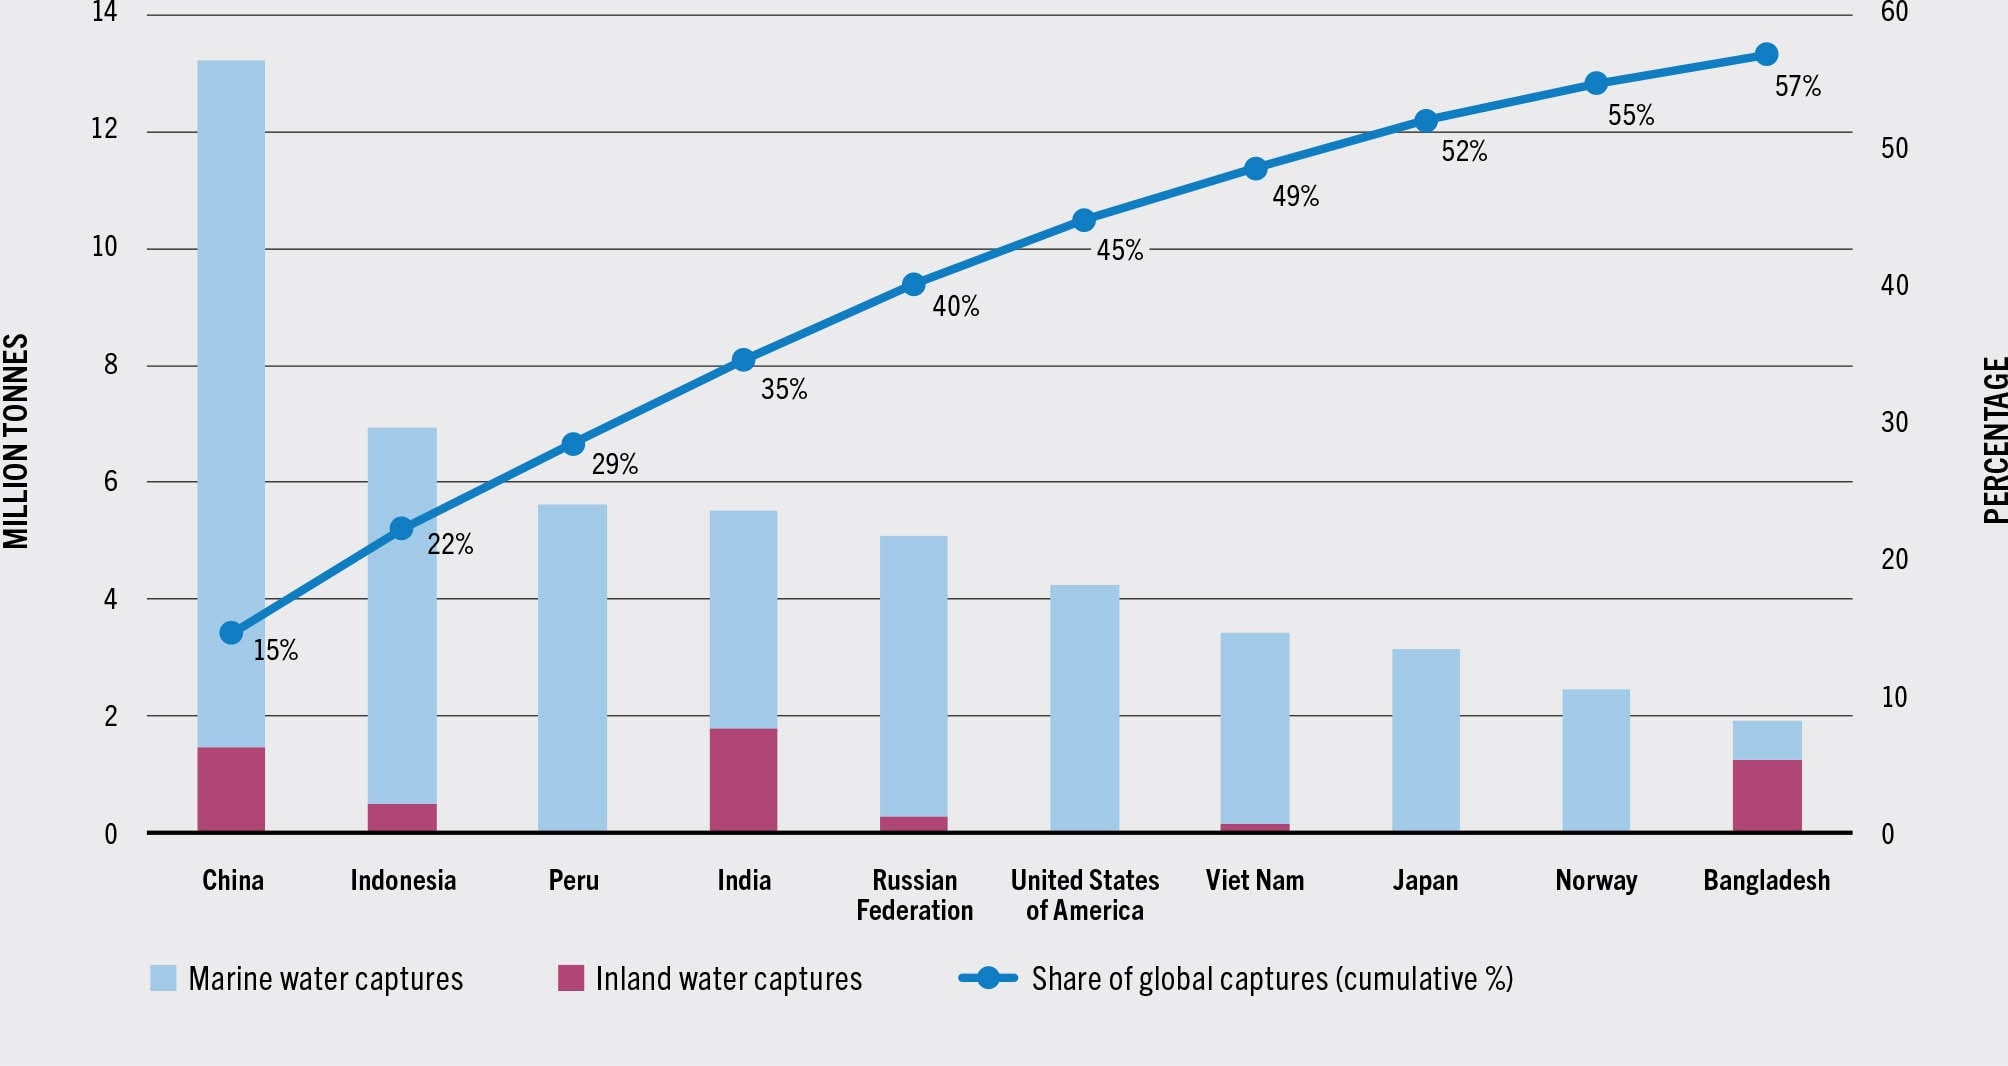
SOURCE: FAO.
Catch trends in marine and inland waters, representing, respectively, 87.3 percent and 12.7 percent of the global production of capture fisheries in 2018–2020, are discussed further below.
Marine capture production
In 2020, global marine captures were 78.8 million tonnes, a decline of 6.8 percent from the peak of 84.5 million tonnes in 2018, when relatively high catches of anchoveta were reported by Peru and Chile (Table 2).
TABLE 2MARINE CAPTURE PRODUCTION: MAJOR PRODUCING COUNTRIES AND TERRITORIES
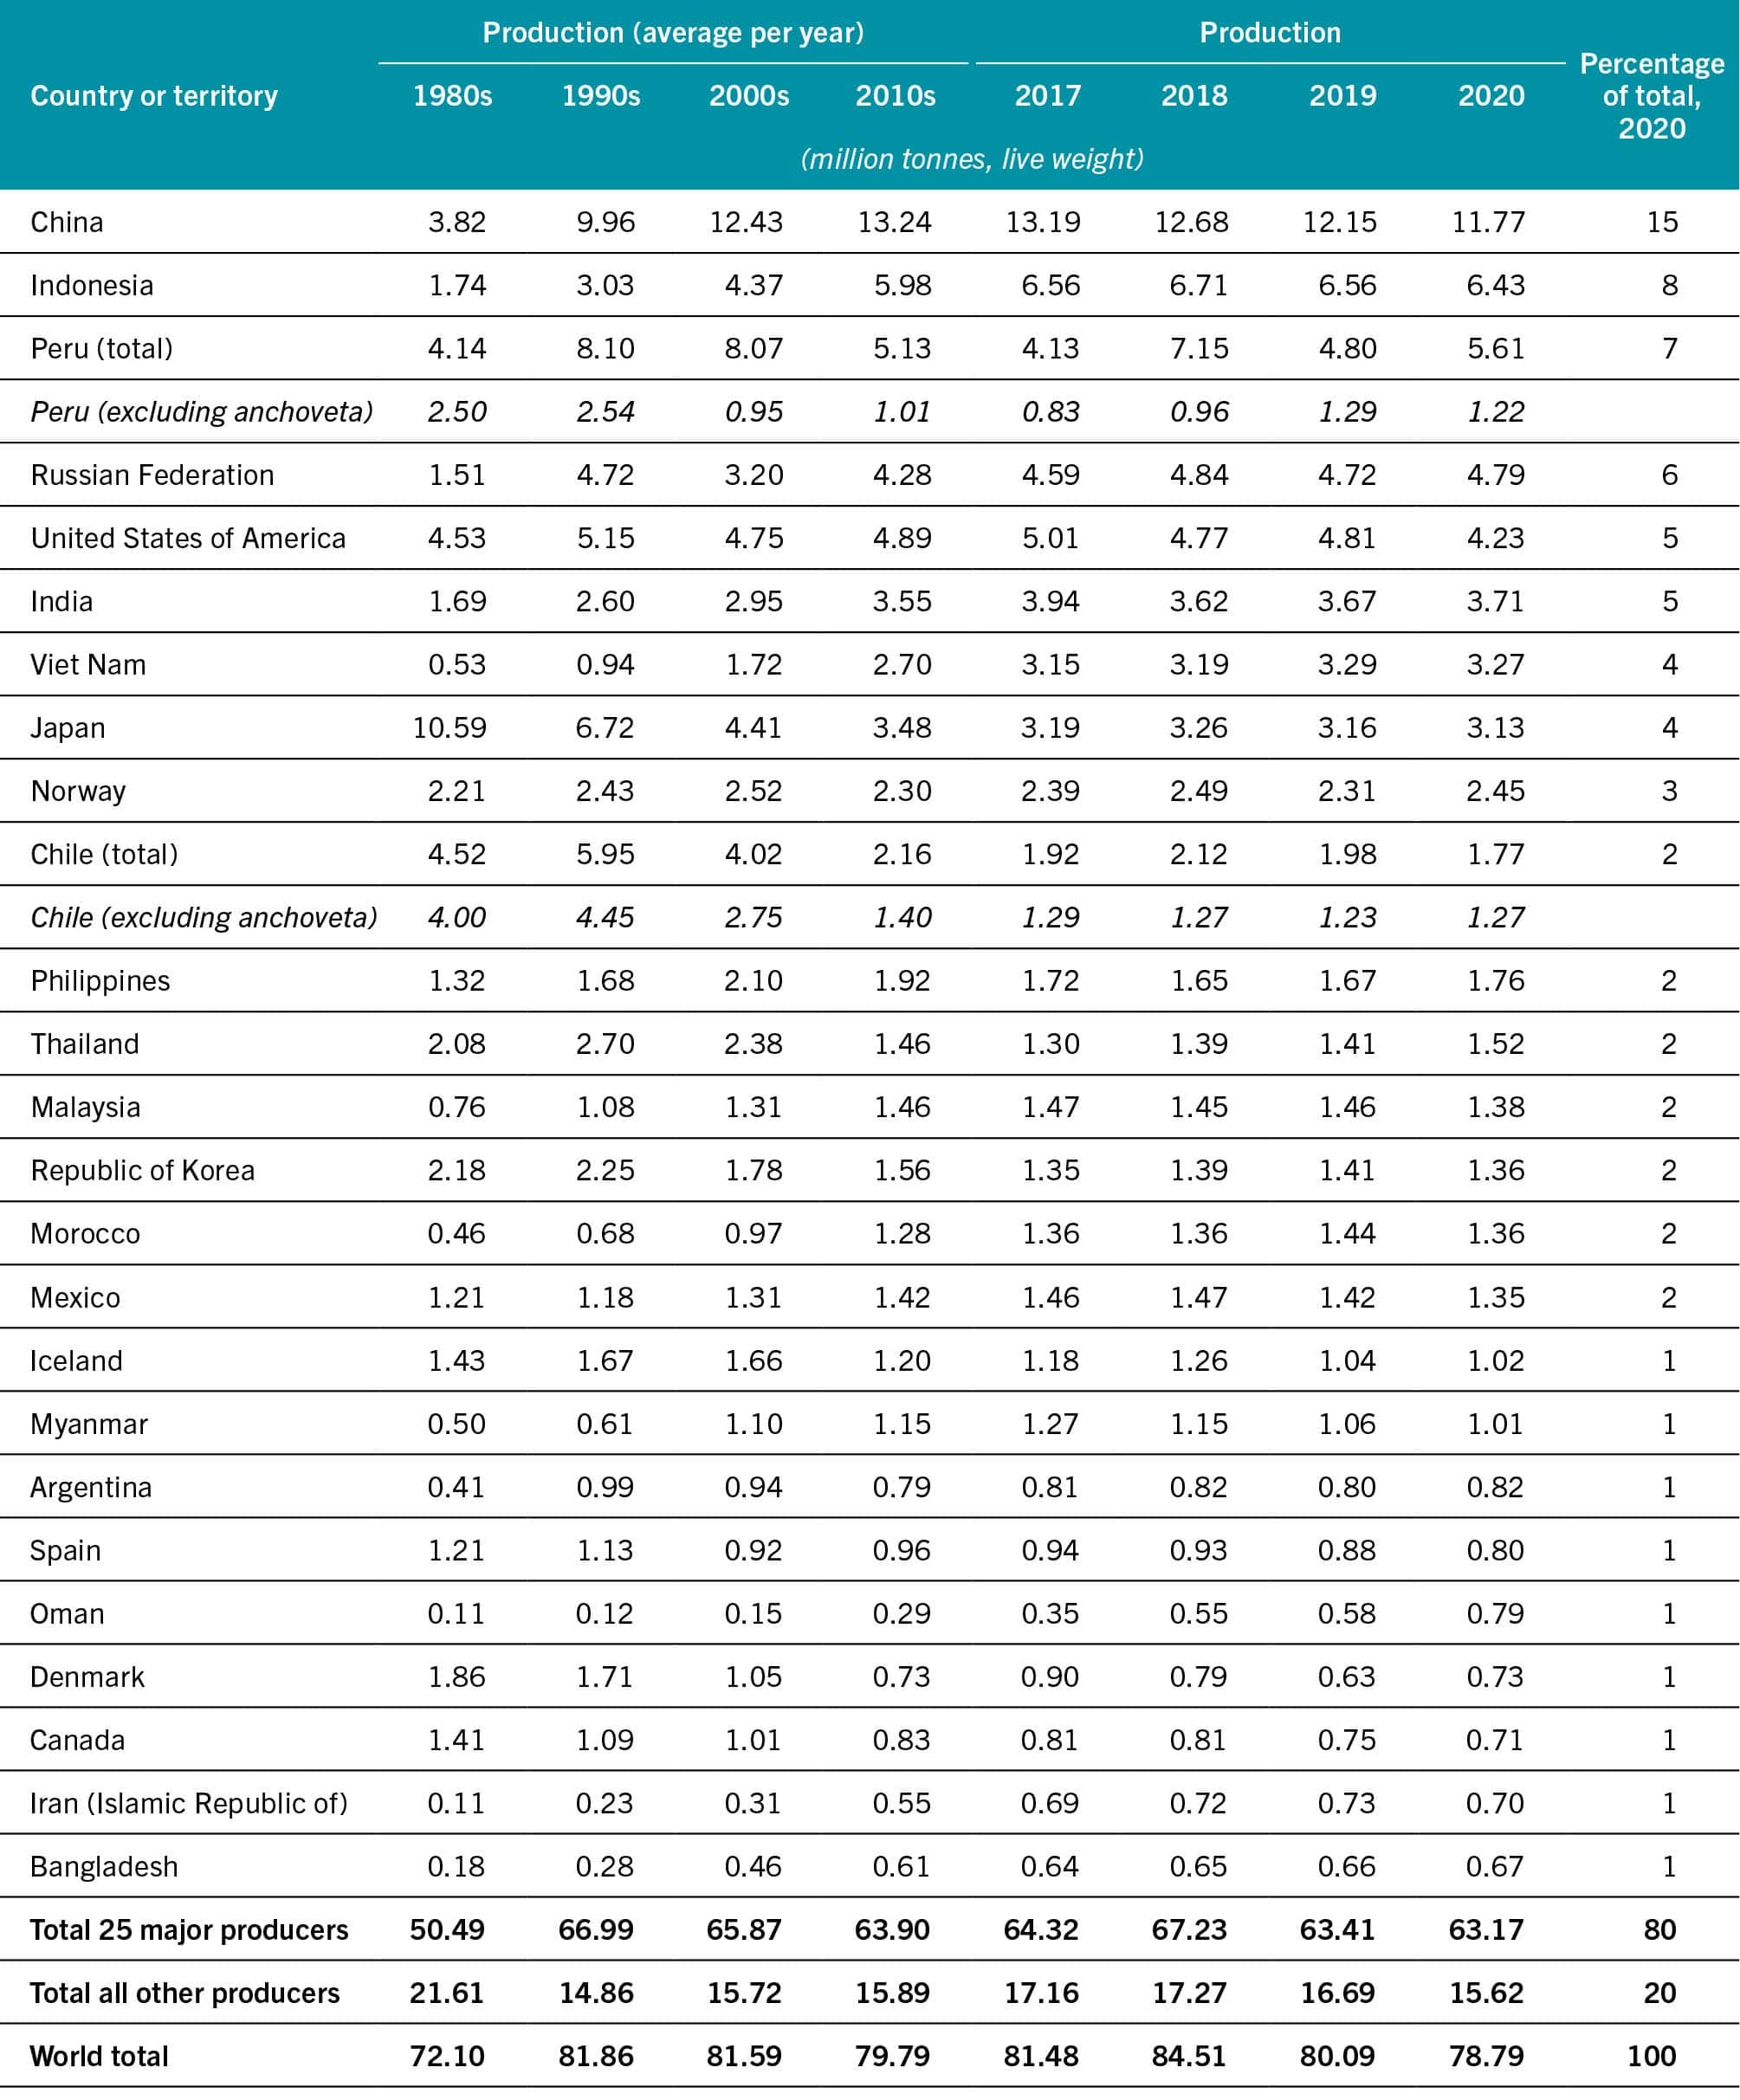
SOURCE: FAO.
Marine captures were severely affected by the disruption to fishing operations caused by the COVID-19 pandemic during 2020. However, assessing the impact of the crisis on marine water catches is difficult and needs to be considered in the context of longer-term trends in the sector, including the ongoing reduction in catches reported by China in recent years. The abundance of species such as anchoveta, Pacific sardine (Sardinops sagax) and Pacific jack mackerel (Trachurus symmetricus), which are substantial but highly variable due to El Niño events and variations in oceanographic conditions, is also a major influence on interannual changes in global marine captures.
Compared with 2019 (i.e. prior to the COVID-19 pandemic), global marine captures decreased by 1.6 percent in 2020, well within the limits of interannual fluctuations in previous years. Of the top ten producers for global capture production, most reported catches in 2020 were either at the same level as or higher than the catches for 2019 (e.g. Peru, India, Russian Federation and Norway).
Catches of major species have undergone marked variations over the years, as well as fluctuations in the catches among the top producing countries. A case in point is Indonesia, which reported an increase in marine catches from under 4 million tonnes in the early 2000s to over 6.7 million tonnes in 2018; these increases are in part explained by changes to the country’s data collection, processing and open data access with the implementation of Satu Data (One Data) in 2016. Despite the initiatives to improve Indonesia’s data collection, there are still major fluctuations in its marine catches, in addition to issues of late or non-reporting of data to FAO.
Global production of marine capture fisheries continues to be highly concentrated among a small number of producers (Figure 9a). In 2020, similar to previous years, the top seven producers accounted for over 50 percent of total marine captures, and China alone accounted for 14.9 percent of the world total (Table 2), followed by Indonesia (8.2 percent), Peru (7.1 percent), the Russian Federation (6.1 percent), the United States of America (5.4 percent), India (4.7 percent) and Viet Nam (4.2 percent).
FIGURE 9MARINE CAPTURE PRODUCTION, AVERAGE 2018–2020
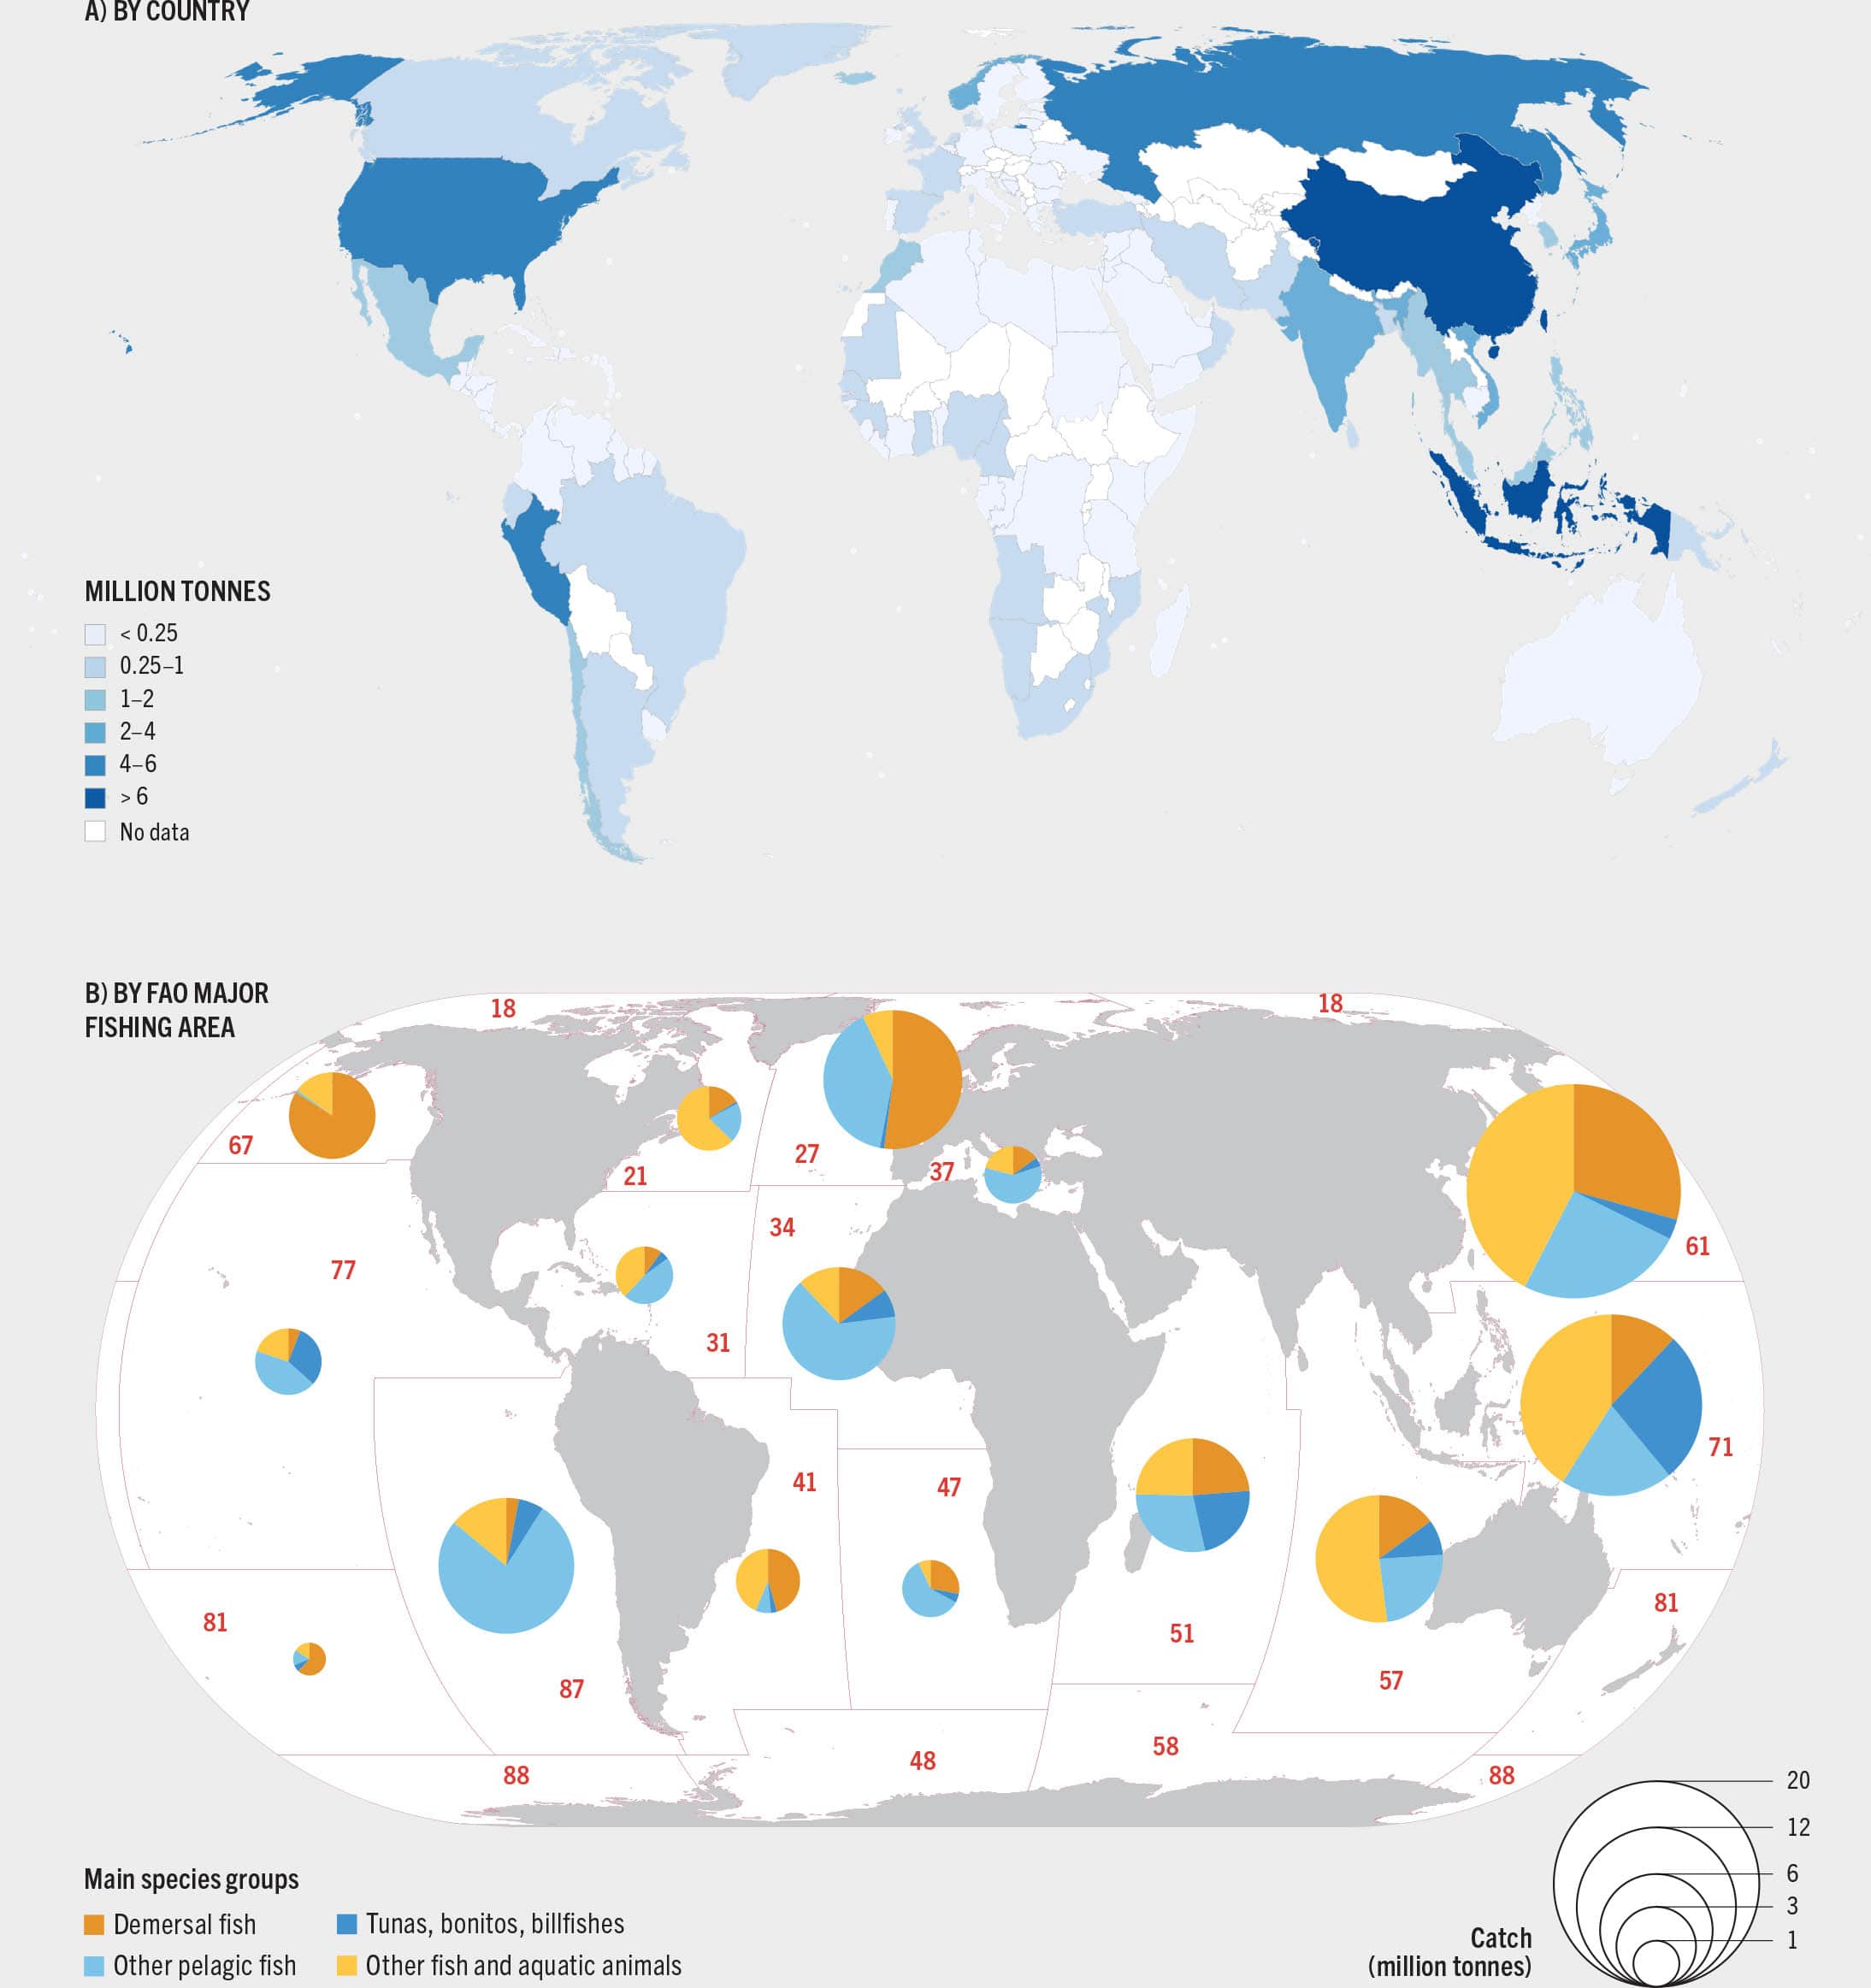
NOTE: Data expressed in live weight equivalent.
SOURCE: FAO.
While China remains the world’s top producer of marine captures, its catches declined from 14.4 million tonnes in 2015 to 11.8 million tonnes in 2020, representing a decrease of 18.2 percent from 2015 and 7.2 percent from 2018 (an average annual decrease of 3.9 percent). A continuation of a catch reduction policy beyond the Thirteenth and Fourteenth Five-Year Plans (2016–2020 and 2021–2025) is expected to result in further decreases in coming years.
While total catches for China in the FAO database are generally considered to be complete, improvements are needed to more accurately assign China’s distant-water fishery catches by area and disaggregate catches by species.
Of the 11.8 million tonnes reported by China in 2020, a total of 2.3 million tonnes came under “distant-water fishery”, with details on species and fishing area only provided for distant-water catches marketed in area 61, the Northwest Pacific. A portion of the remainder of China’s distant-water fishery catches was attributed to other fishing areas through data available from the regional fisheries management organizations (RFMOs) and the remaining 1.8 million tonnes were entered in the FAO database under “marine fishes not elsewhere included” in area 61, possibly overstating the catches occurring in this area and the overall amount of unspecified marine fish caught by China.
The FAO global marine capture database includes catches for more than 2 600 species (including “not elsewhere included” categories); finfish represent about 85 percent of total marine capture production, with small pelagics as the main group, followed by gadiformes and tuna and tuna-like species. An overview of marine catch data by main species group and by FAO Major Fishing Area is shown in Figure 9b.8
In 2020, catches of anchoveta once again made it the top species, at almost 4.9 million tonnes per year, albeit lower than the 2018 peak that exceeded 7.0 million tonnes. Alaska pollock (Gadus chalcogrammus) was second, at 3.5 million tonnes, while skipjack tuna (Katsuwonus pelamis) ranked third for the eleventh consecutive year, at 2.8 million tonnes (Table 3).
TABLE 3MARINE CAPTURE PRODUCTION: MAJOR SPECIES AND GENERA
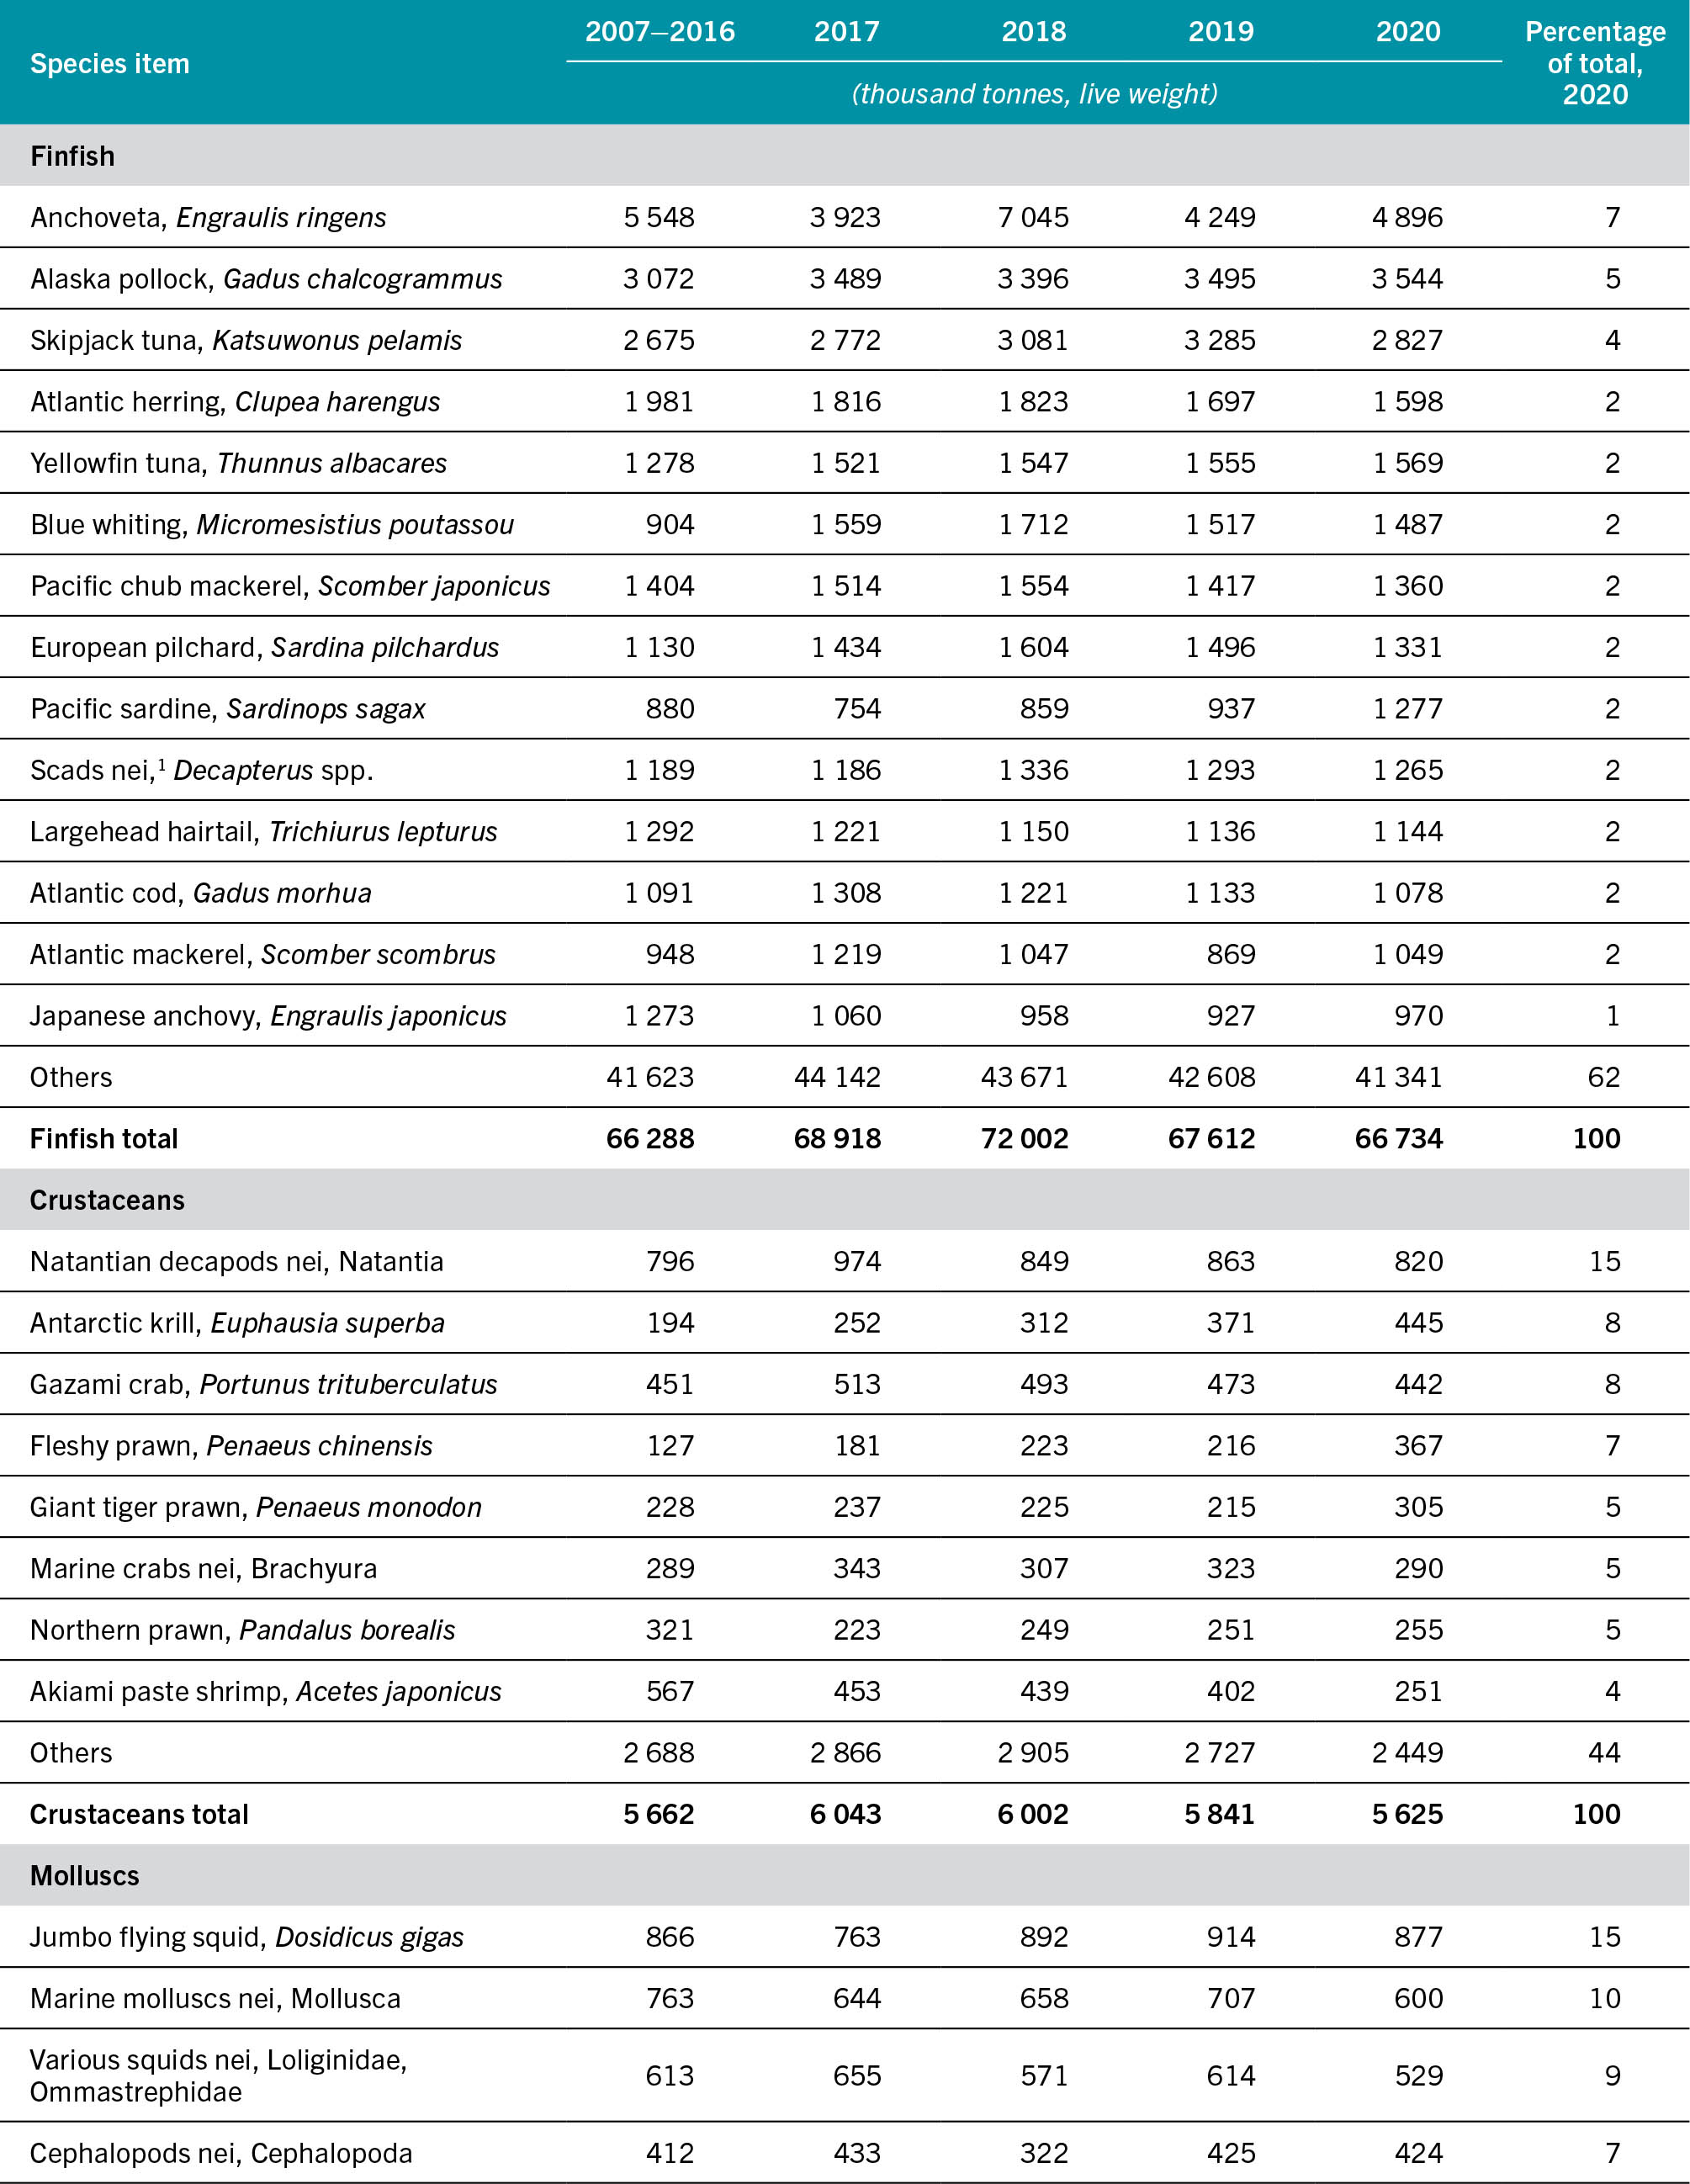
NOTE: Excluding aquatic mammals, crocodiles, alligators, caimans and algae.
SOURCE: FAO.
Despite measures implemented in 2020 to contain COVID-19 – which, in many cases, negatively impacted demand with restrictions on transportation and access to global markets, as well as closure of the food service sector – catches of four of the most highly valuable groups (tunas, cephalopods, shrimps and lobsters) remained at some of their highest levels in 2020 or declined marginally from peak catches recorded in the previous five years:
- Tuna and tuna-like species catches continued to reach some of the highest levels recorded, although catches decreased from 8.2 million tonnes in 2019 to 7.8 million tonnes in 2020 as fresh tuna exports and the sashimi market were impacted by COVID-19 restrictions. Most recent increases in catches have been in area 71, the Western Central Pacific, which increased from about 2.7 million tonnes in the mid-2000s to almost 3.8 million tonnes in 2019, with a decline of more than 5 percent in 2020 (3.6 million tonnes). Within this species group, skipjack and yellowfin tuna (Thunnus albacares) accounted for over 55 percent of catches.
- Cephalopod catches declined to between 3.5 million tonnes and 3.8 million tonnes following their peak catches of 4.9 million tonnes in 2014. Nevertheless, they remained at the relatively high levels that have marked their almost continuous growth over the last 20 years; in 2020, catches were 3.7 million tonnes. Cephalopods are fast-growing species highly influenced by environmental variability, which probably explains the fluctuations in their catches, including for the three main squid species – jumbo flying squid (Dosidicus gigas), Argentine shortfin squid (Illex argentinus) and Japanese flying squid (Todarodes pacificus).
- Shrimp and prawn catches recorded a new high in 2017 of almost 3.4 million tonnes, mostly due to the continued recovery in catches of Argentine red shrimp (Pleoticus muelleri), which offset declines in the other main shrimp species, notably akiami paste shrimp (Acetes japonicus) and southern rough shrimp (Trachysalambria curvirostris). In 2020, catches were 3.2 million tonnes, continuing the trend of recent years with catches fluctuating between 3.1 million tonnes and 3.4 million tonnes per year.
- Lobster catches decreased to 255 000 tonnes in 2020 – the lowest level since 2009 – as lobster was one of the high-value species most impacted by COVID-19 restrictions and the closure of global export markets. As restrictions are eased, catches are expected to recover to the levels above 300 000 tonnes seen in recent years, particularly of American lobster (Homarus americanus), which accounts for over half of catches in this group.
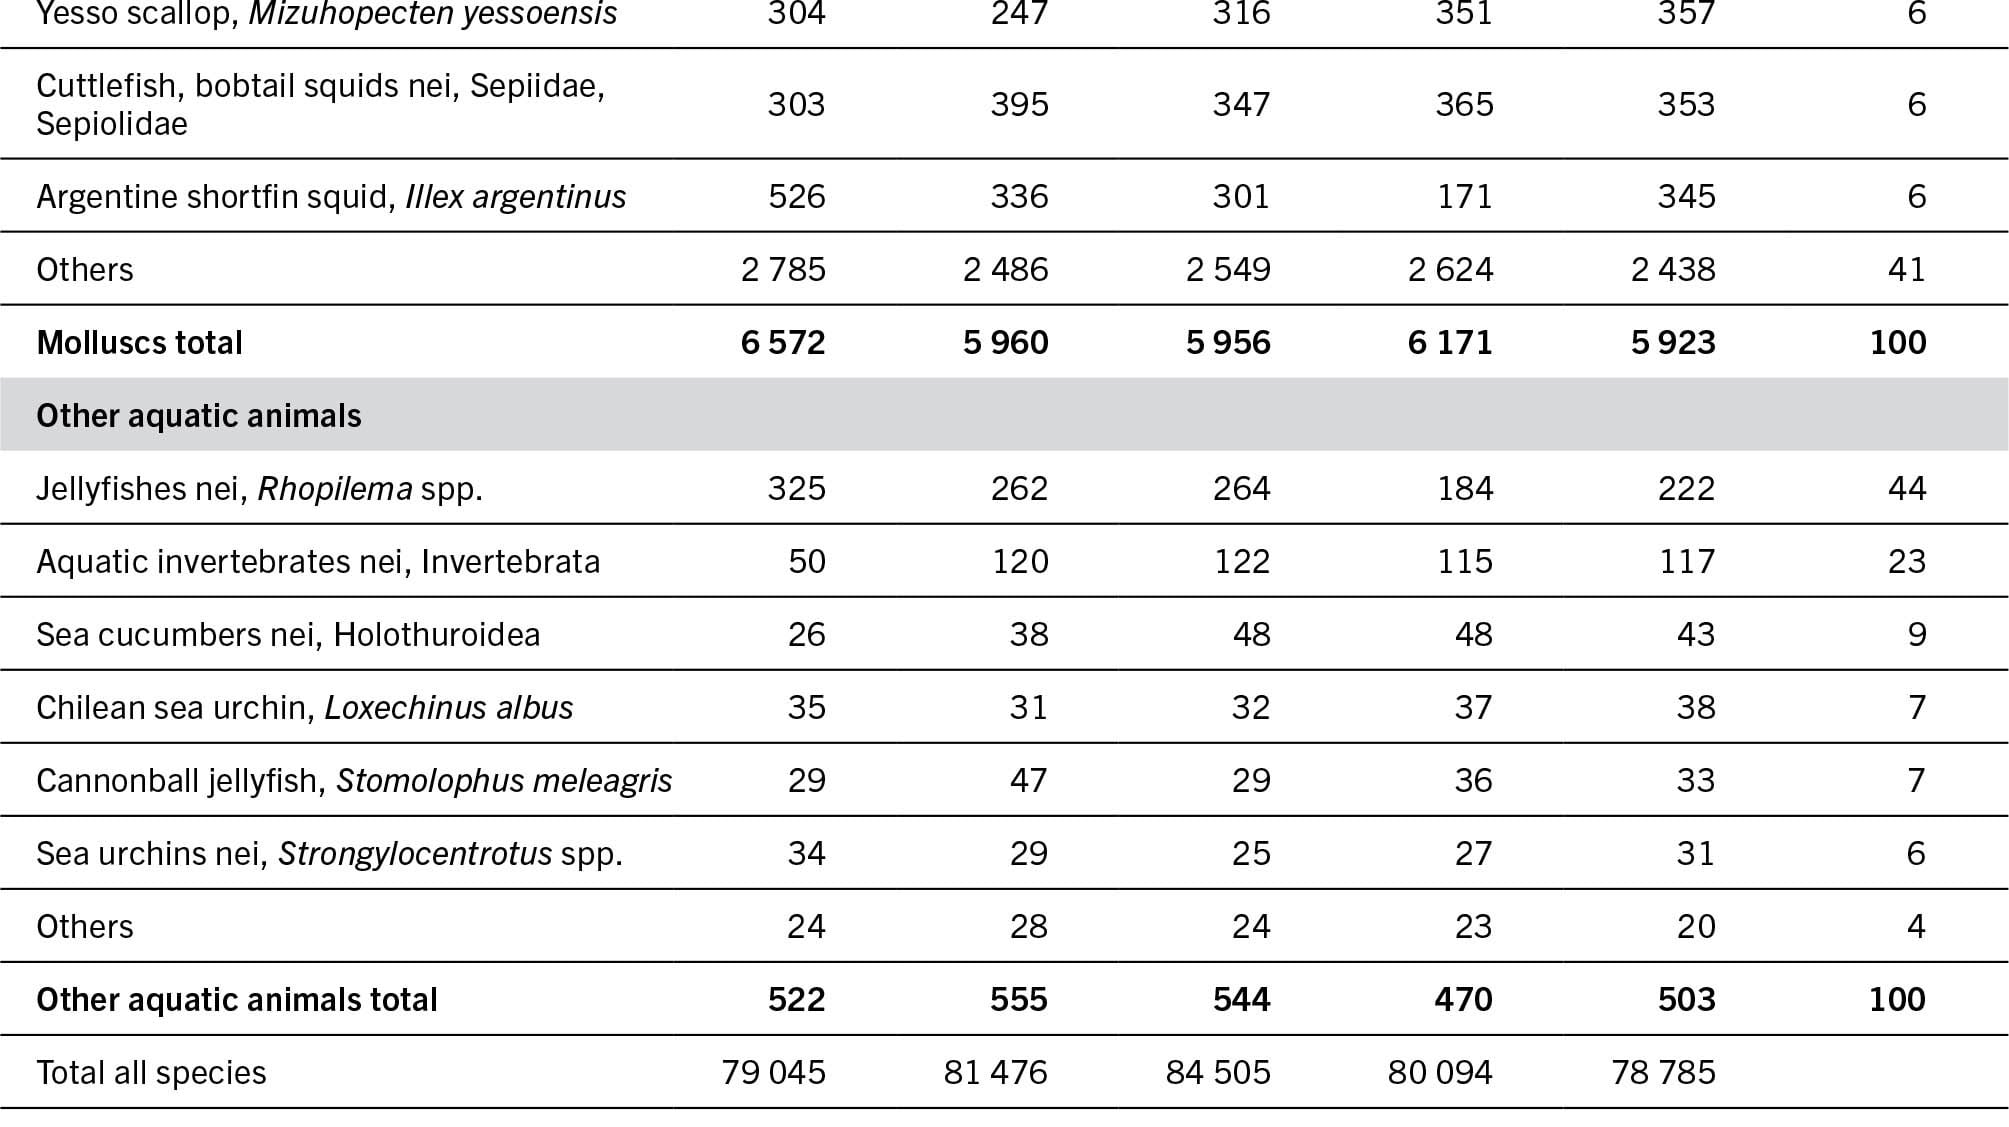
Catch statistics by FAO Major Fishing Area for the last five years, as well as marine catches in recent decades, are presented in Table 4 for the following categories (Figure 10):
- temperate areas (areas 21, 27, 37, 41, 61, 67 and 81);
- tropical areas (areas 31, 51, 57 and 71);
- upwelling areas (areas 34, 47, 77 and 87);
- Arctic and Antarctic areas (areas 18, 48, 58 and 88).
TABLE 4INLAND AND MARINE CAPTURE PRODUCTION: FAO MAJOR FISHING AREAS
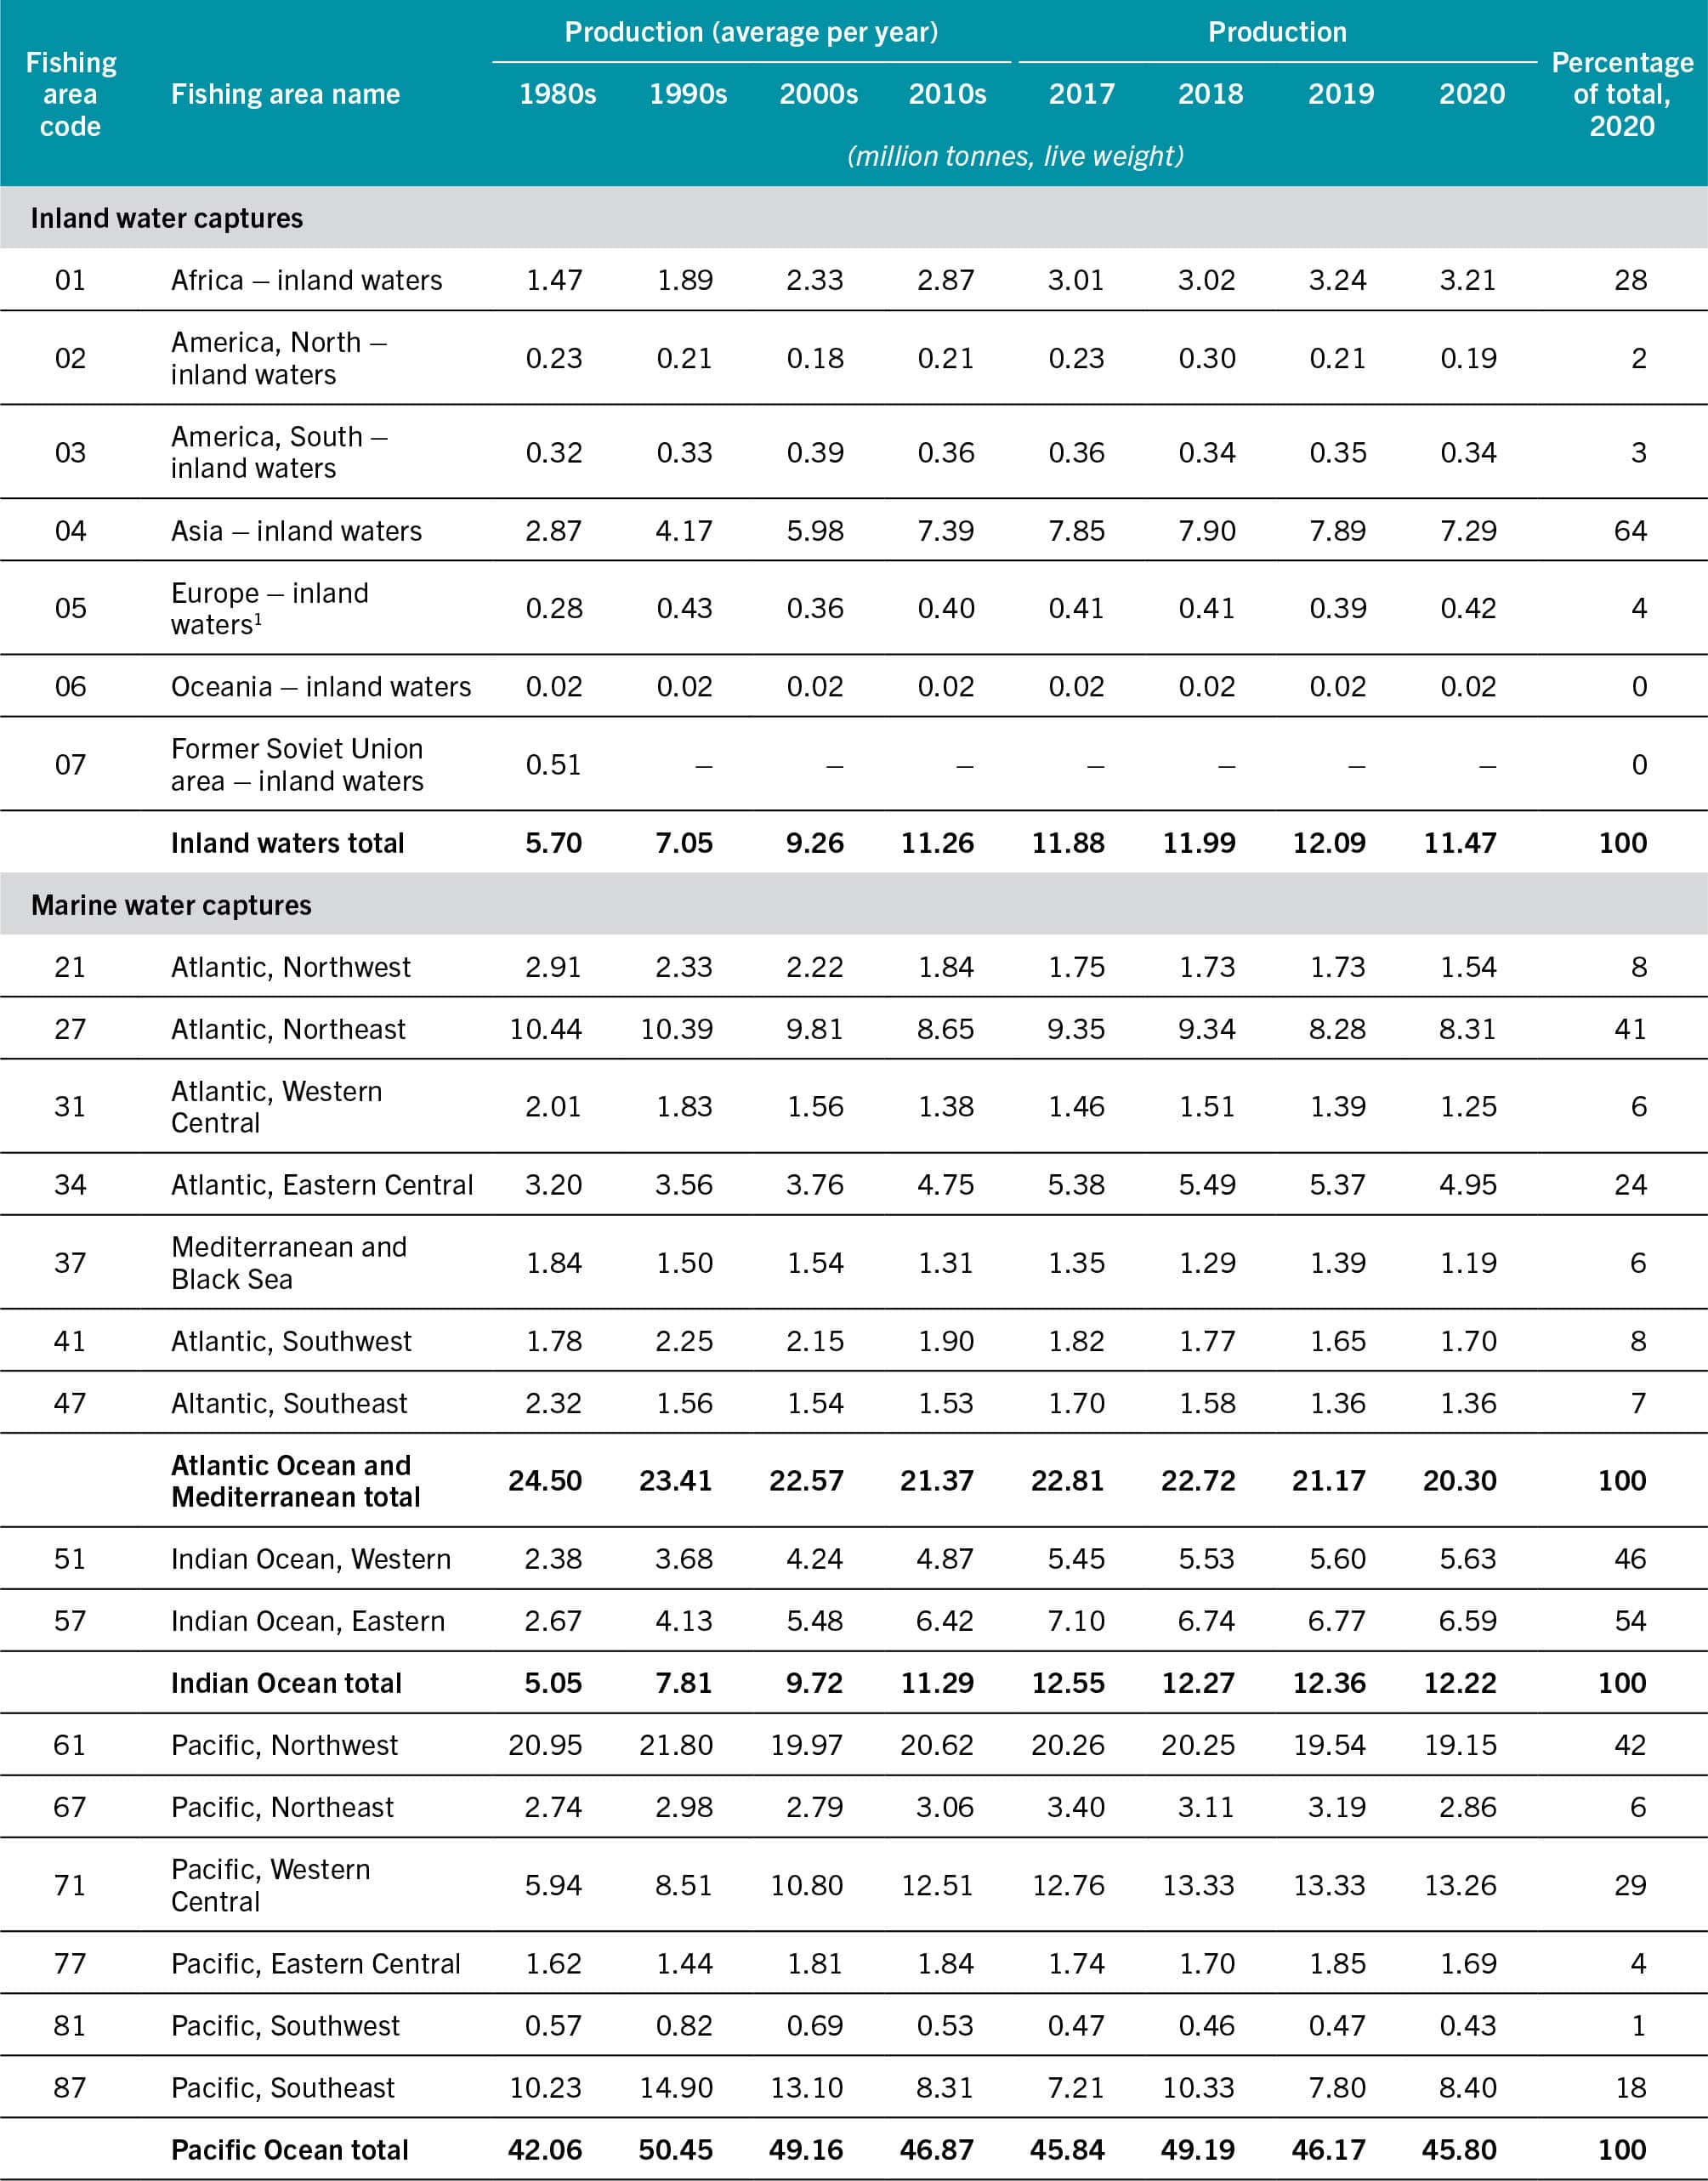

NOTE: Excluding aquatic mammals, crocodiles, alligators, caimans and algae.
SOURCE: FAO.
FIGURE 10MARINE CAPTURE PRODUCTION: TRENDS IN THREE MAIN CATEGORIES OF FISHING AREAS
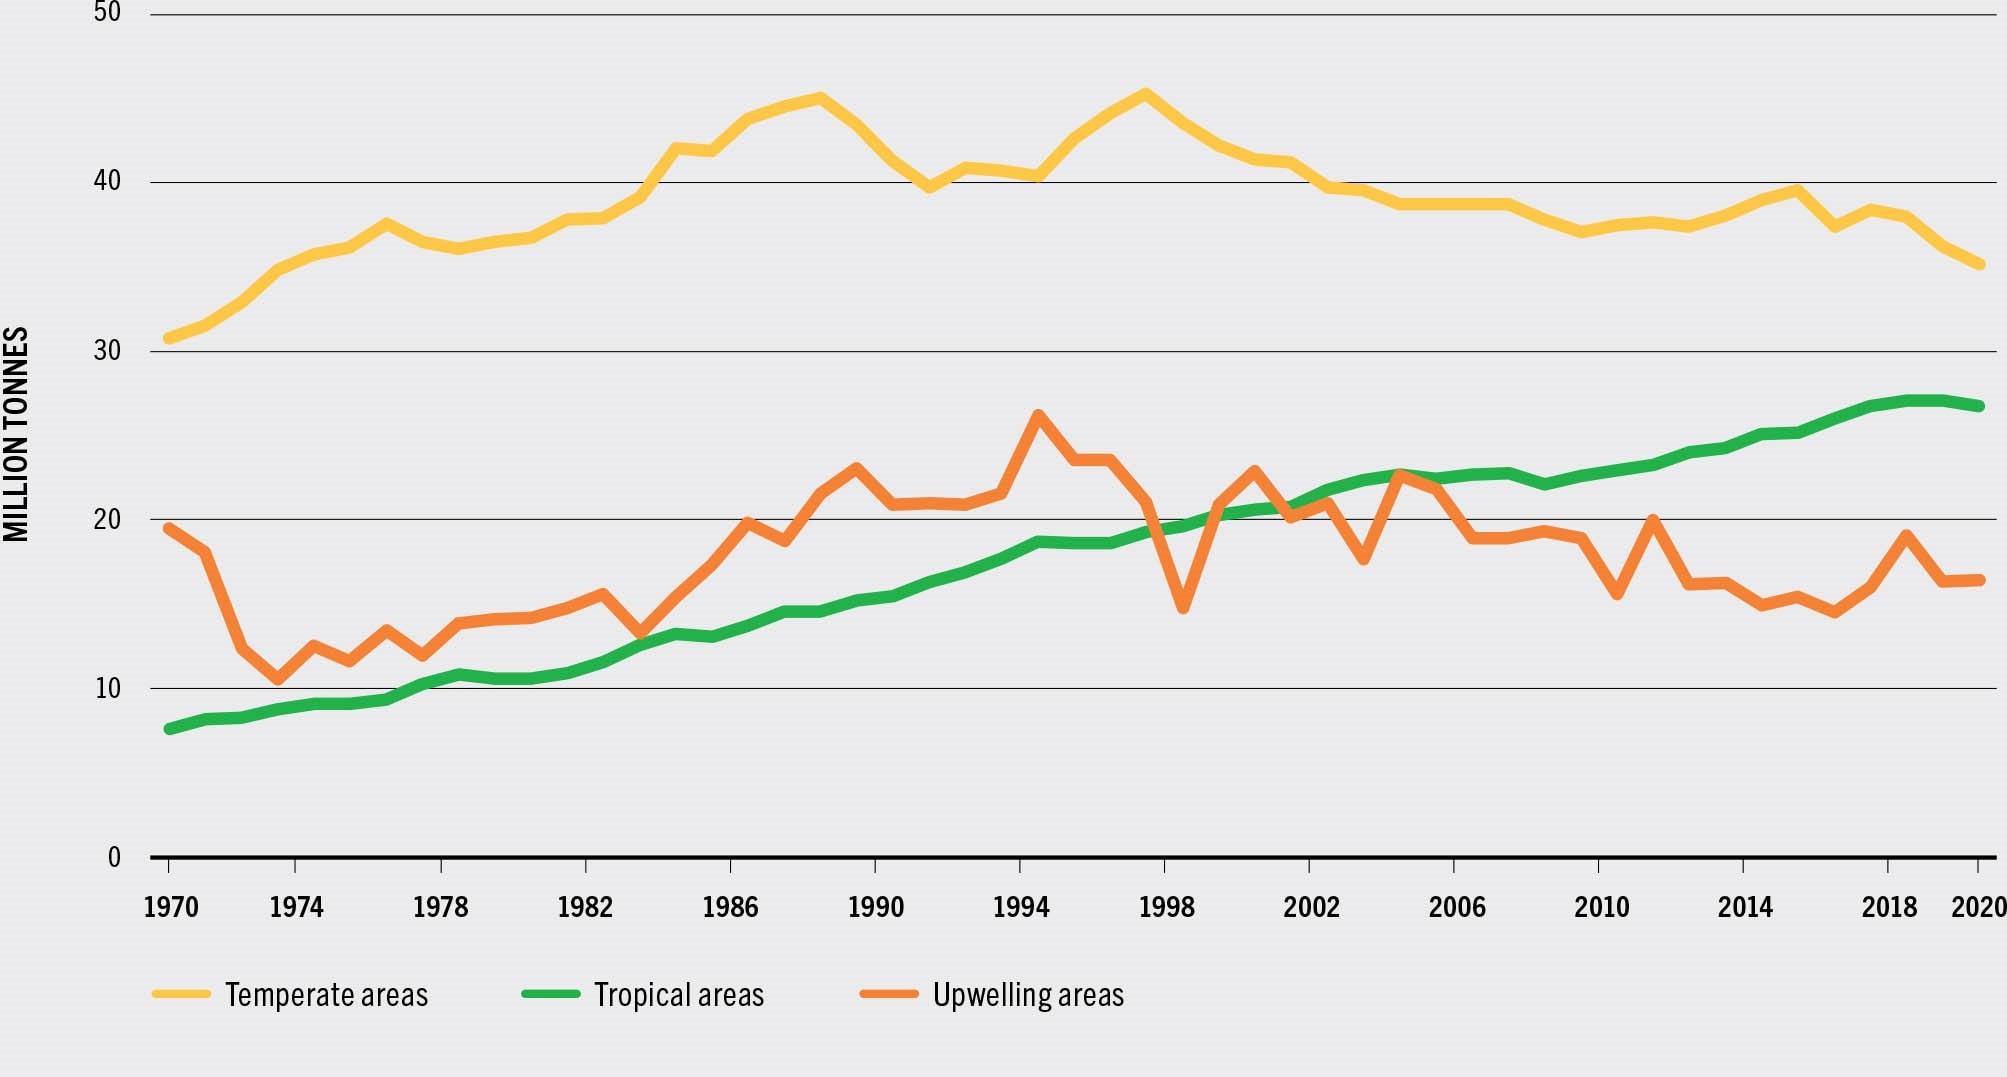
SOURCE: FAO.
In 2020, catches in temperate areas were 35.2 million tonnes, marginally lower than in previous years. Otherwise, catches have generally remained stable at between 36.2 million tonnes and 39.6 million tonnes per year since the early 2000s, following the two highest peaks in catches (about 45 million tonnes) in 1988 and 1997.
Area 61, the Northwest Pacific, recorded the highest production at 19.2 million tonnes, or 24 percent of global marine landings, in 2020. As stated above, catches for this area include a proportion of China’s distant-water fishing fleet catches (recorded as “marine fishes not elsewhere included”), which are caught in other fishing areas but are assigned to area 61 in the absence of detailed information on where they were effectively caught.
Catches in other temperate areas have been mostly stable in the last ten years, with the exception of recent decreases in areas 41 and 81, the Southwest Atlantic and the Southwest Pacific, partly the result of greatly reduced catches by distant-water fishing nations targeting cephalopods in the Southwest Atlantic and various species in the Southwest Pacific.
In tropical areas, catches in the Indian Ocean (areas 51 and 57) and the Western Central Pacific (area 71) reached their highest levels recorded at, respectively, 12.5 million tonnes (2017) and 13.3 million tonnes (2018). Catches have since decreased but remain only marginally below the peak catches of recent years.
In the Indian Ocean, catches have increased steadily since the 1980s, particularly in area 57, the Eastern Indian Ocean, with catches of small pelagics, large pelagics (tunas and billfish) and shrimps driving most of the increase.
Area 71, the Western Central Pacific, reported the second largest landings by area in 2020 with 13.3 million tonnes. Catches have also increased steadily since the 1950s, with tuna and tuna-like species accounting for most of the increase. Skipjack tuna in particular has increased from 1.0 million tonnes to almost 1.9 million tonnes in the last 20 years, while catches for the other main species groups have mostly remained stable.
In area 31, the Western Central Atlantic, catches have declined from the peak catches of 2.5 million tonnes in the mid-1980s, but have been relatively stable since the mid-2000s, fluctuating between 1.2 million tonnes and 1.6 million tonnes per year. Trends in total production are largely dependent on catches by the United States of America of Gulf menhaden (Brevoortia patronus), a clupeoid species that is processed into fishmeal and fish oil and accounts for over 30 percent of the total catches.
Catches in upwelling areas are characterized by high interannual variability. Their combined catches are highly influenced by catches in area 87, the Southeast Pacific, where El Niño oceanographic conditions strongly influence the abundance of anchoveta. Such catches account for 50–70 percent of total catches in area 87.
The long-term trend in area 87 has been one of declining catches since the mid-1990s, even taking into account the fluctuation in catches of anchoveta. Annual catches have decreased from over 20 million tonnes in 1994 to between about 7 million tonnes and 10 million tonnes in recent years – driven by decreasing catches of two of the main species: anchoveta and Chilean jack mackerel (Trachurus murphyi). However, high-value catches of jumbo flying squid have grown significantly since the early 2000s, partially offsetting the decline in catches of other species. Catches of jumbo flying squid grew from about 128 000 tonnes in 2000 to peak at 1 million tonnes in 2015, before fluctuating in subsequent years and reaching 880 000 tonnes in 2020.
In area 34, the Eastern Central Atlantic Ocean, catches have increased almost continuously, reaching 5.5 million tonnes in 2018, the highest catches recorded, before declining to 4.9 million tonnes in 2020. In area 47, the Southeast Atlantic, the opposite trend is recorded, with catches progressively decreasing from the peak of 3.3 million tonnes in 1978 to 1.4 million tonnes in 2020.
In area 77, the Eastern Central Pacific, catches have generally remained static, ranging from 1.6 million tonnes to 2 million tonnes per year.
While total catches in Antarctic fishing areas (areas 48, 58 and 88) are relatively minor, catches have increased sharply in recent years, from 270 000 tonnes in 2017 to 462 000 tonnes in 2020, the highest catches since the early 1990s. Catches in the region are almost entirely driven by Antarctic krill (Euphausia superba), which increased from less than 100 000 tonnes in the late 1990s to 455 000 tonnes in 2020, following a decline in the early 1990s. Catches of the second-most important species, Patagonian toothfish (Dissostichus eleginoides), continue to be relatively stable at between 10 500 tonnes and 12 200 tonnes per year.
Inland waters capture production
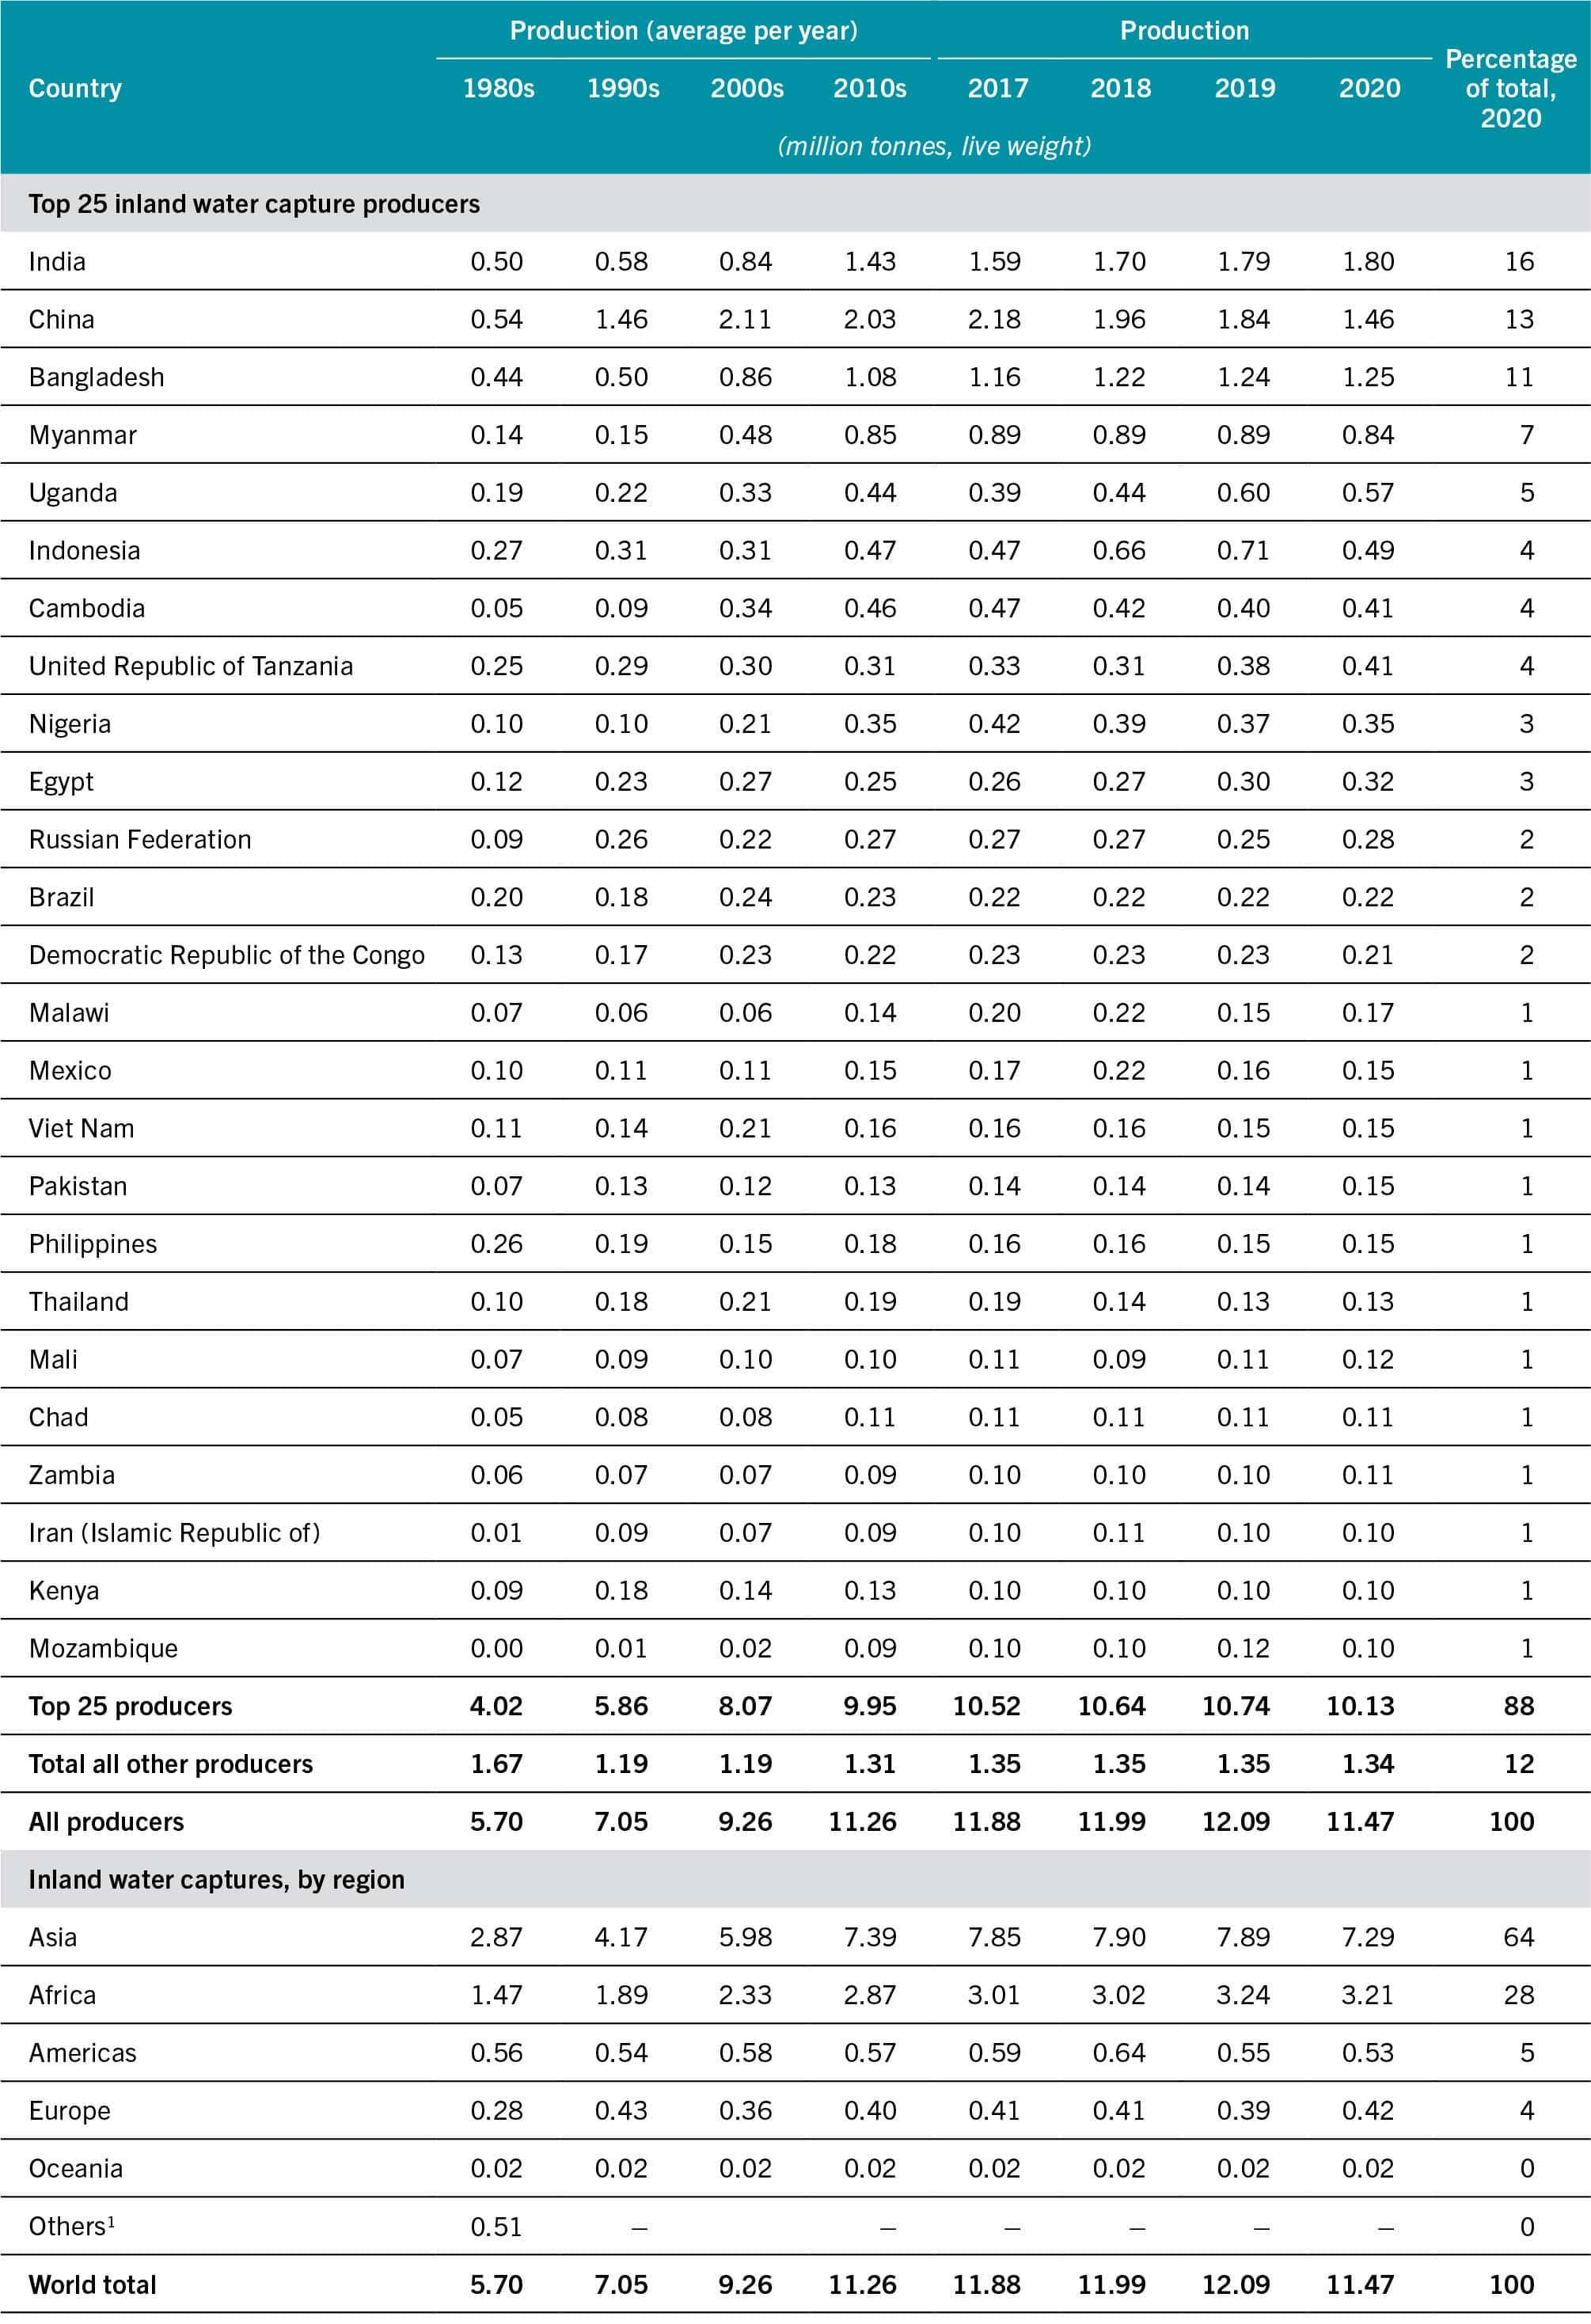
In 2020, total global catches in inland waters were 11.5 million tonnes (Table 5), a decrease of 5.1 percent from 2019. As with marine capture production, fishing operations in inland waters were severely impacted by the COVID-19 pandemic during 2020, and this was compounded by the decline in China’s catches. Despite the decrease in 2020, inland water catches remain at historically high levels and only marginally below the highest levels of 12.0 million tonnes recorded in 2019.
TABLE 5INLAND WATERS CAPTURE PRODUCTION: MAJOR PRODUCING COUNTRIES AND TERRITORIES
NOTE: Excluding aquatic mammals, crocodiles, alligators, caimans and algae.
SOURCE: FAO.
The long-term rising trend in inland fisheries production can partially be attributed to improved reporting and assessment at the country level. Nevertheless, many of the data collection systems for inland waters are still unreliable, or in some cases non-existent; furthermore, improvements in reporting may also mask trends in individual countries. Equally important, many countries do not report catches for inland fisheries, or they report only partial catches, while FAO estimates a proportionately higher amount of the total catches for inland waters compared with marine waters.
For the first time since the mid-1980s, China was not the top producer of inland water catches in 2020 and instead the highest catches were reported by India at 1.8 million tonnes. While China continues to be one of the largest producers of inland water capture fisheries, reported catches have decreased by over 33 percent from 2.2 million tonnes in 2017 to 1.5 million tonnes in 2020. This significant decrease is the result of recently introduced policies by China’s Ministry of Agriculture and Rural Affairs, most notably a ten-year fishing ban in the waters of the Yangtze River, that aim for conservation of living aquatic resources, with the underlying rationale that improvements in and expansion of inland aquaculture and culture-based fisheries can meet the increased demand for aquatic food9 arising from the reduction in catches from inland capture fisheries.
With the exception of China, the increase in inland water catches continues to be driven by several major producing countries – notably India, Bangladesh, Myanmar and Uganda (Figure 11). Most of the countries reporting declining catches represent a relatively low contribution to global production of inland water captures, although some supply important quantities to national or regional diets – in particular, Cambodia, Brazil, Viet Nam and Thailand.
FIGURE 11TOP FIVE INLAND WATERS CAPTURE PRODUCERS
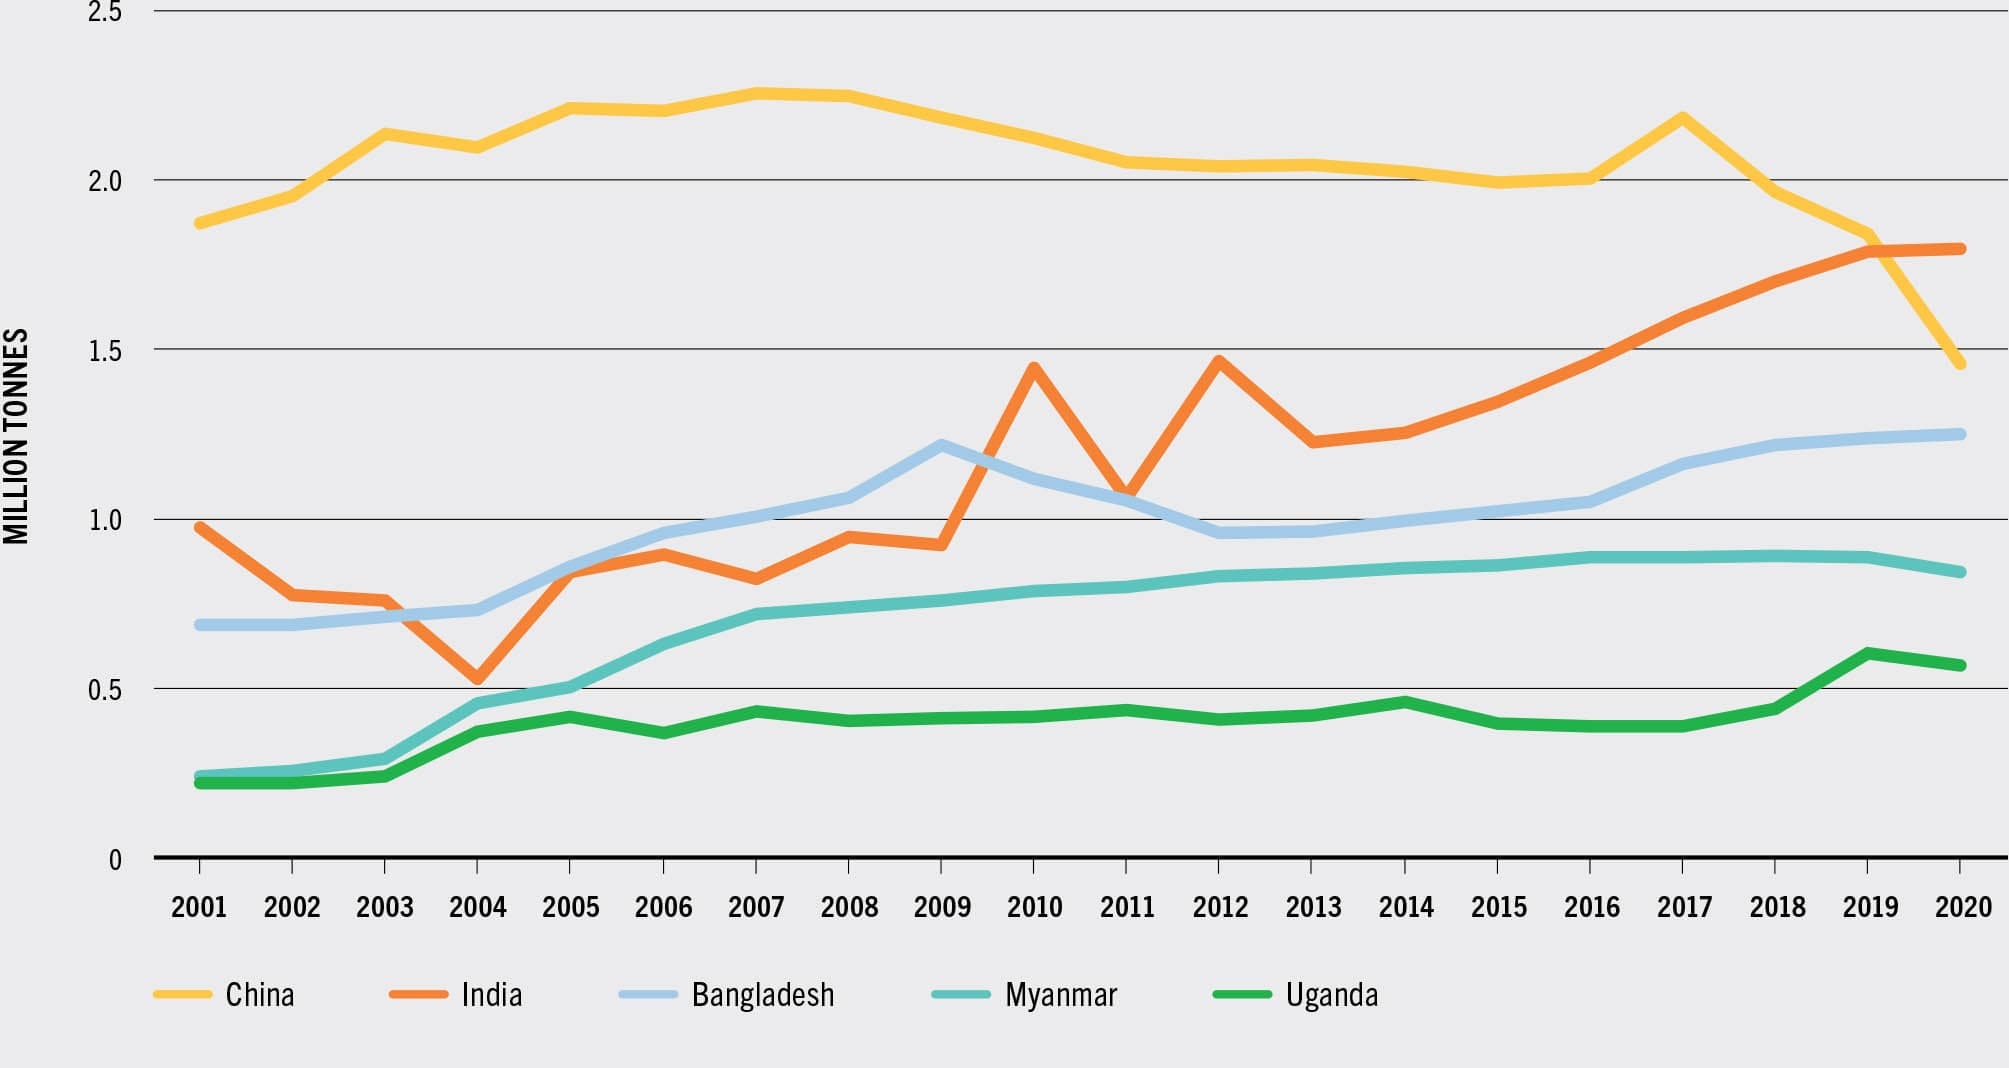
SOURCE: FAO.
Inland water captures are more concentrated than marine captures among major producing nations endowed with important waterbodies or river basins (Figure 12). In 2020, 13 countries produced over 75 percent of total inland captures, compared with 20 countries for marine captures.
FIGURE 12INLAND CAPTURE PRODUCTION BY COUNTRY, AVERAGE 2018–2020
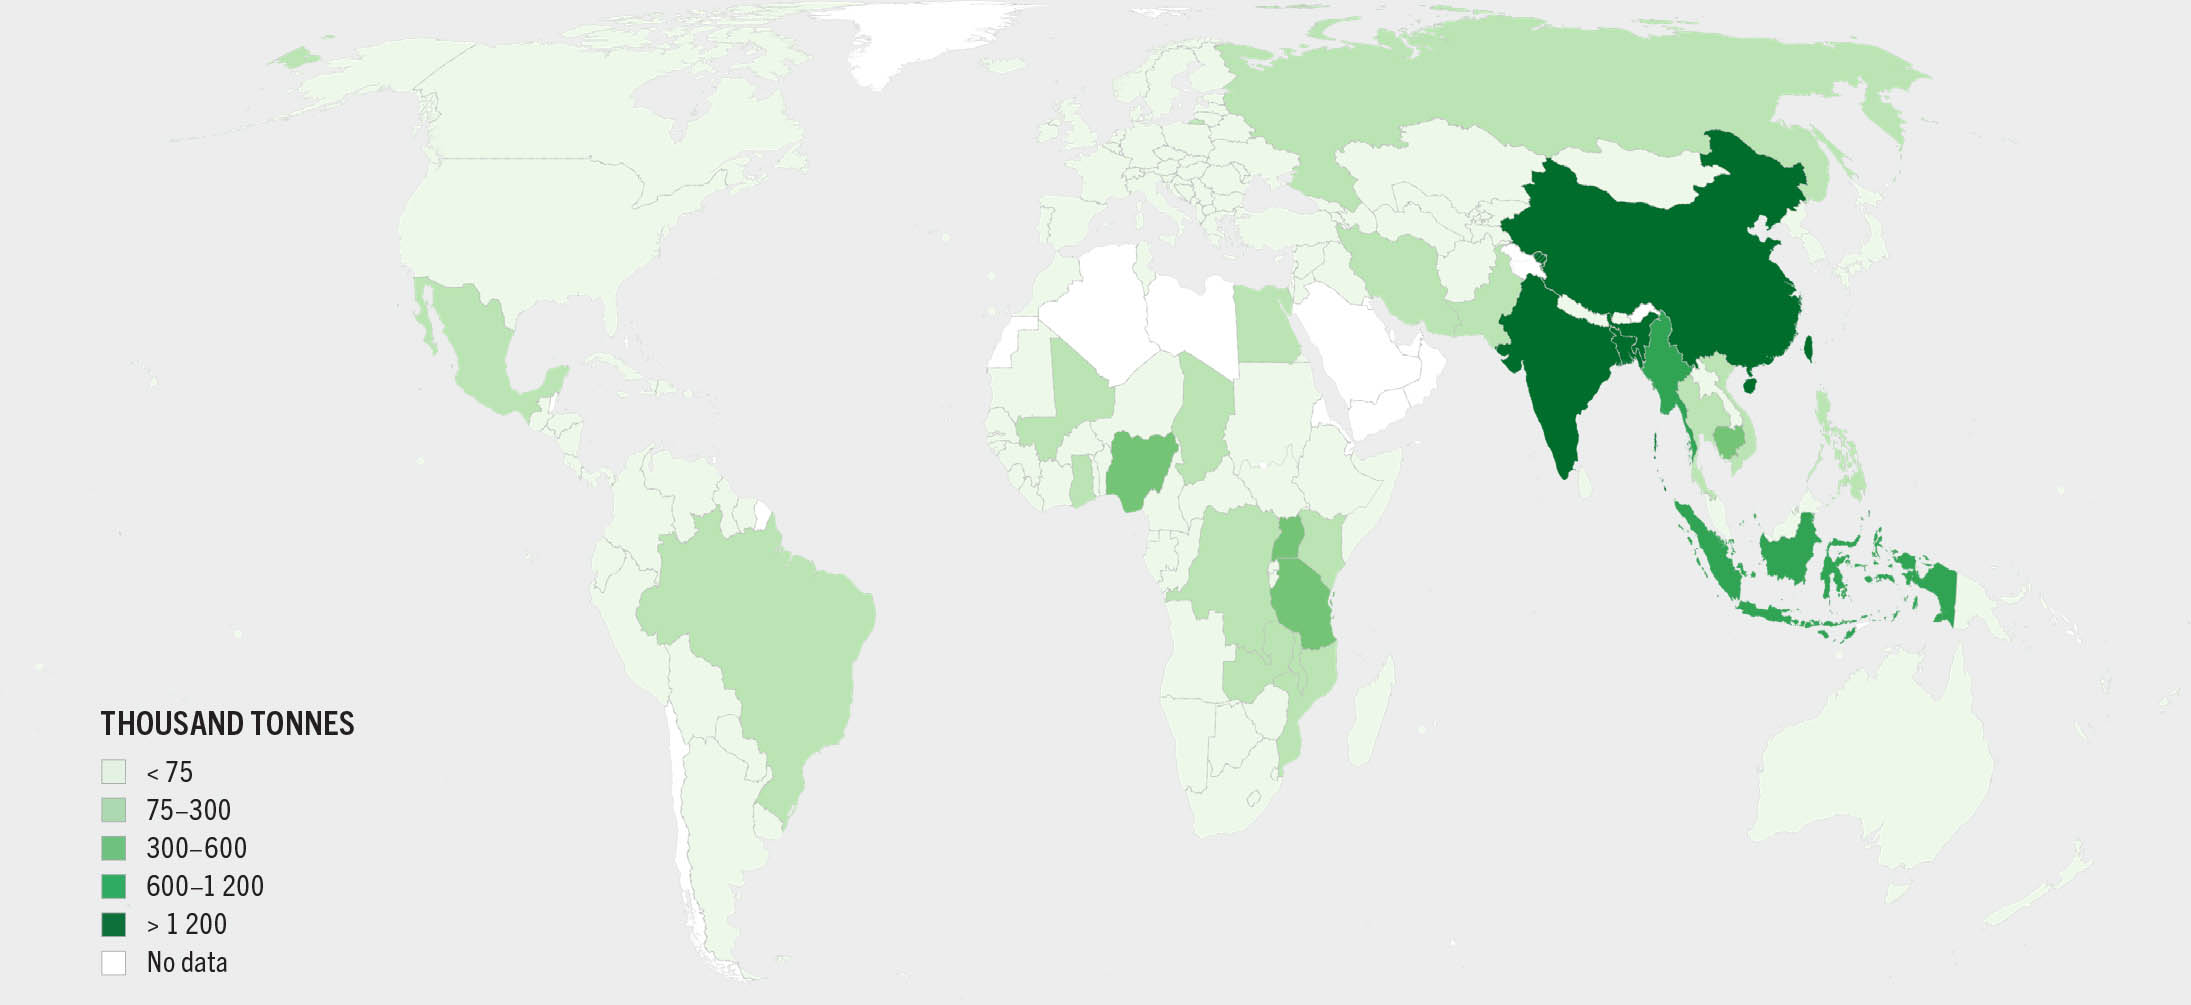
NOTE: Data expressed in live weight equivalent.
SOURCE: FAO.
For the same reason, the top producers of inland water captures are also more concentrated geographically and are particularly important in terms of the contribution to total captures in Asia, where inland water catches provide an important food source for many local communities. Asia has consistently accounted for around two-thirds of global inland water production since the mid-2000s, while the top four producers are all located in Asia and accounted for over 46 percent of total inland water catches in 2020.
At the global level, Africa accounts for over 25 percent of inland captures, which represent an important source of food security, particularly in the case of landlocked and low-income countries. The combined catches for Europe and the Americas account for around 8 percent of total inland captures, while in Oceania catches are negligible.
Three major species groups account for over 75 percent of total inland water catches. The first group, “carps, barbels and other cyprinids”, has shown a continuous increase, rising from about 0.7 million tonnes per year in the mid-2000s to almost 1.9 million tonnes in 2020, and explains most of the increase in catches from inland waters in recent years. Catches of the second-largest group, “tilapias and other cichlids”, have also started to increase in recent years from 0.7 million tonnes to 0.9 million tonnes per year. Catches of the third-largest group, “freshwater crustaceans”, have generally remained stable at between 0.4 million tonnes and 0.45 million tonnes per year; however, in 2020, catches fell to 0.3 million tonnes, mostly as a result of the decrease in China’s inland water catches.
Data sources and quality of FAO capture statistics
National reports are the main, although not the only, source of data used to maintain and update FAO’s capture fishery databases. Hence, the quality of FAO statistics is highly dependent on the accuracy, completeness and timeliness of the data collected by national fisheries institutions and reported annually to FAO.
Often, the data submitted are incomplete, inconsistent or do not comply with international reporting standards, and FAO works to curate the data in collaboration with countries to improve their data collection and reporting, expanding to cover more species. As a result, the species breakdown (an indicator of quality and coverage in reported catches) more than doubled between 1996 (1 035 species) and 2020 (2 981 species). However, a significant proportion of catches are still not reported at the species level, particularly for groups such as sharks, rays and chimaeras in marine capture. In the case of inland water captures, the category of freshwater fishes nei (Actinopterygii) accounts for around 50 percent of global inland water captures in recent years.
The quality and completeness of data also vary considerably between marine and inland water captures, with marine catches having generally more complete data available by species than do inland captures.
Alternatively, FAO informs users of the countries where the long-term official catch series may be subject to inconsistencies due to breaks in the time series as a result of changes in the data collection. While improvements in national data collection and reporting systems are always welcome, unless accompanied by corrections to historical data, they can result in abrupt changes to the total national catch and, if species breakdown is also improved, to trends at the species level.
Issues of timeliness or the non-reporting of data to FAO affect the quality and completeness of FAO’s estimates of total capture fisheries. The late submission of questionnaires makes it challenging for FAO to process, validate and review the capture fisheries statistics – in particular for the most recent year – prior to the official release of the data, usually in mid-March every year. In the absence of national reports or in the event of inconsistencies in the data, FAO may make estimates based on the best data available from alternative official data sources (including data published by RFMOs, or through standard methodologies).
FAO continues to express concern that a number of countries have not responded to FAO questionnaires in recent years or report incomplete data. These countries include some large capture producers such as Indonesia, Brazil, Mauritania and Cambodia. Issues regarding the timeliness or non-reporting of data to FAO were exacerbated in 2020 by the disruption in regular data collection activities caused by the COVID-19 pandemic.
Improvements in the overall quality of the catch data in FAO’s global databases can only be obtained by enhancing the national data collection systems, to produce better information that can support policy and management decisions at the national and regional levels (Box 1). FAO continues to support projects to improve national data collection systems, including sampling schemes based on sound statistical analysis, coverage of fisheries subsectors not sampled before, and standardization of sampling at landing sites.

