
TRADE OF FISHERIES AND AQUACULTURE PRODUCTS25, 26
International trade of aquatic products25 has grown significantly during recent decades, expanding over continents and regions. This expansion has been driven to a large extent by economic growth and cultural and technological advancement associated with globalization. Liberal trade policies, as well as logistical and technological innovations enabling globalized communications, have fostered economic interdependence and accelerated cultural dissemination, including food habits, across borders. Producers have been able to access increasingly distant markets, while consumers have seen their aquatic food options greatly diversified beyond the species caught or farmed in local waters. At the same time, income growth, a larger middle class and urbanization, particularly in low- and middle-income countries, have caused aggregate demand for traded aquatic food products to increase considerably. Today, trade in aquatic products plays an important role as a generator of export revenue, employment and value addition, and as a contributor to global food security, involving diverse and interlinked actors in shipping, processing, wholesale and retail. This is highly significant for several small island developing States where exports of aquatic products comprise a large proportion of the total value of merchandise trade and of total gross domestic product (GDP).
In 2020, 225 states and territories reported some trading activity of fisheries and aquaculture products. World exports of aquatic products, excluding algae,25 totalled 59.8 million tonnes live weight, worth USD 151 billion.27 This represents the second consecutive decline, down from the record high of USD 165 billion reached in 2018. It is important to note that this figure covers trade in products only, meaning it does not capture the extent of trade in fisheries and aquaculture services, such as consulting, quality control, certification and labelling, trade promotion and marketing, maintenance and repair. The overall value generated by these services is not known, as it is usually recorded together with the value of services related to other activities. The value of traded aquatic products accounted for 11 percent of total agricultural trade (excluding forestry) and for about 1 percent of total merchandise trade in 2020. These shares are much higher in many countries, exceeding 40 percent of the total value of merchandise trade in Cabo Verde, Iceland, Kiribati or Maldives, for example. In 2020, the value of trade in aquatic food products was comparable to the total value of trade in all terrestrial meats (Figure 45). From 1976 to 2020, the value of trade in aquatic products increased at an average annual rate of 6.9 percent28 in nominal terms and 3.9 percent in real terms. The nominal value of exports of aquatic products was nearly 20 times higher in 2020 compared with 1976 (Figure 46). This is comparable to the expansion of the value of global merchandise trade, which increased at a rate of 6.8 percent per year in nominal terms between 1976 and 2020, and by 3.7 percent in real terms (World Trade Organization, 2022). Meanwhile, the total quantity of aquatic products exported has increased at an average rate of 2.9 percent per year (live weight equivalent). The faster rate of growth in the value of trade of aquatic products relative to the quantity reflects the increasing proportion of trade volumes comprising high-value species and products undergoing processing or other forms of value addition. Other contributors include inflation and growth in demand, leading to price increases in the long term.
FIGURE 45GLOBAL EXPORT VALUE OF AQUATIC FOOD PRODUCTS AND TERRESTRIAL MEATS, 2020
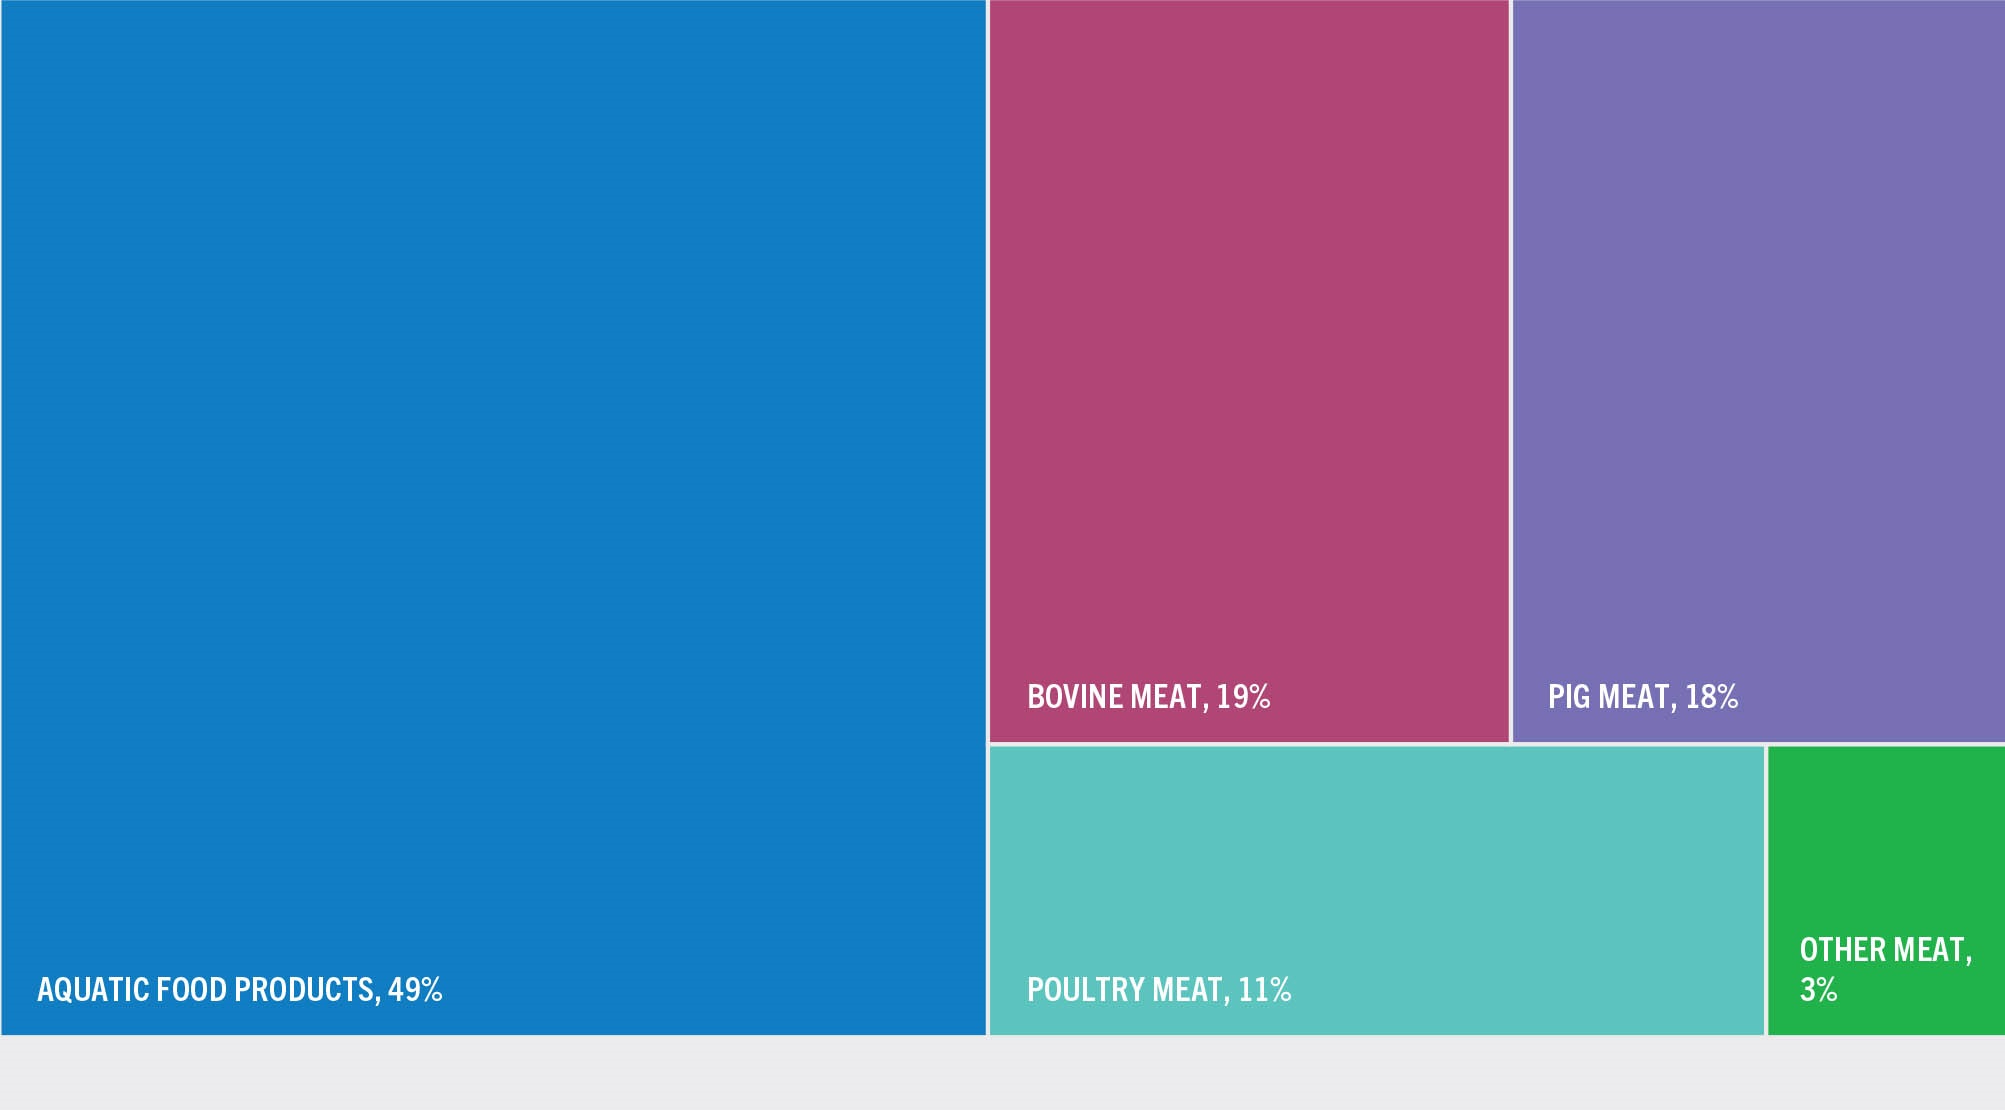
SOURCE: FAO.
FIGURE 46WORLD MERCHANDISE AND AQUATIC PRODUCT1 EXPORT VALUE, FIXED-BASE INDICES (1976 = 100), 1976–2020
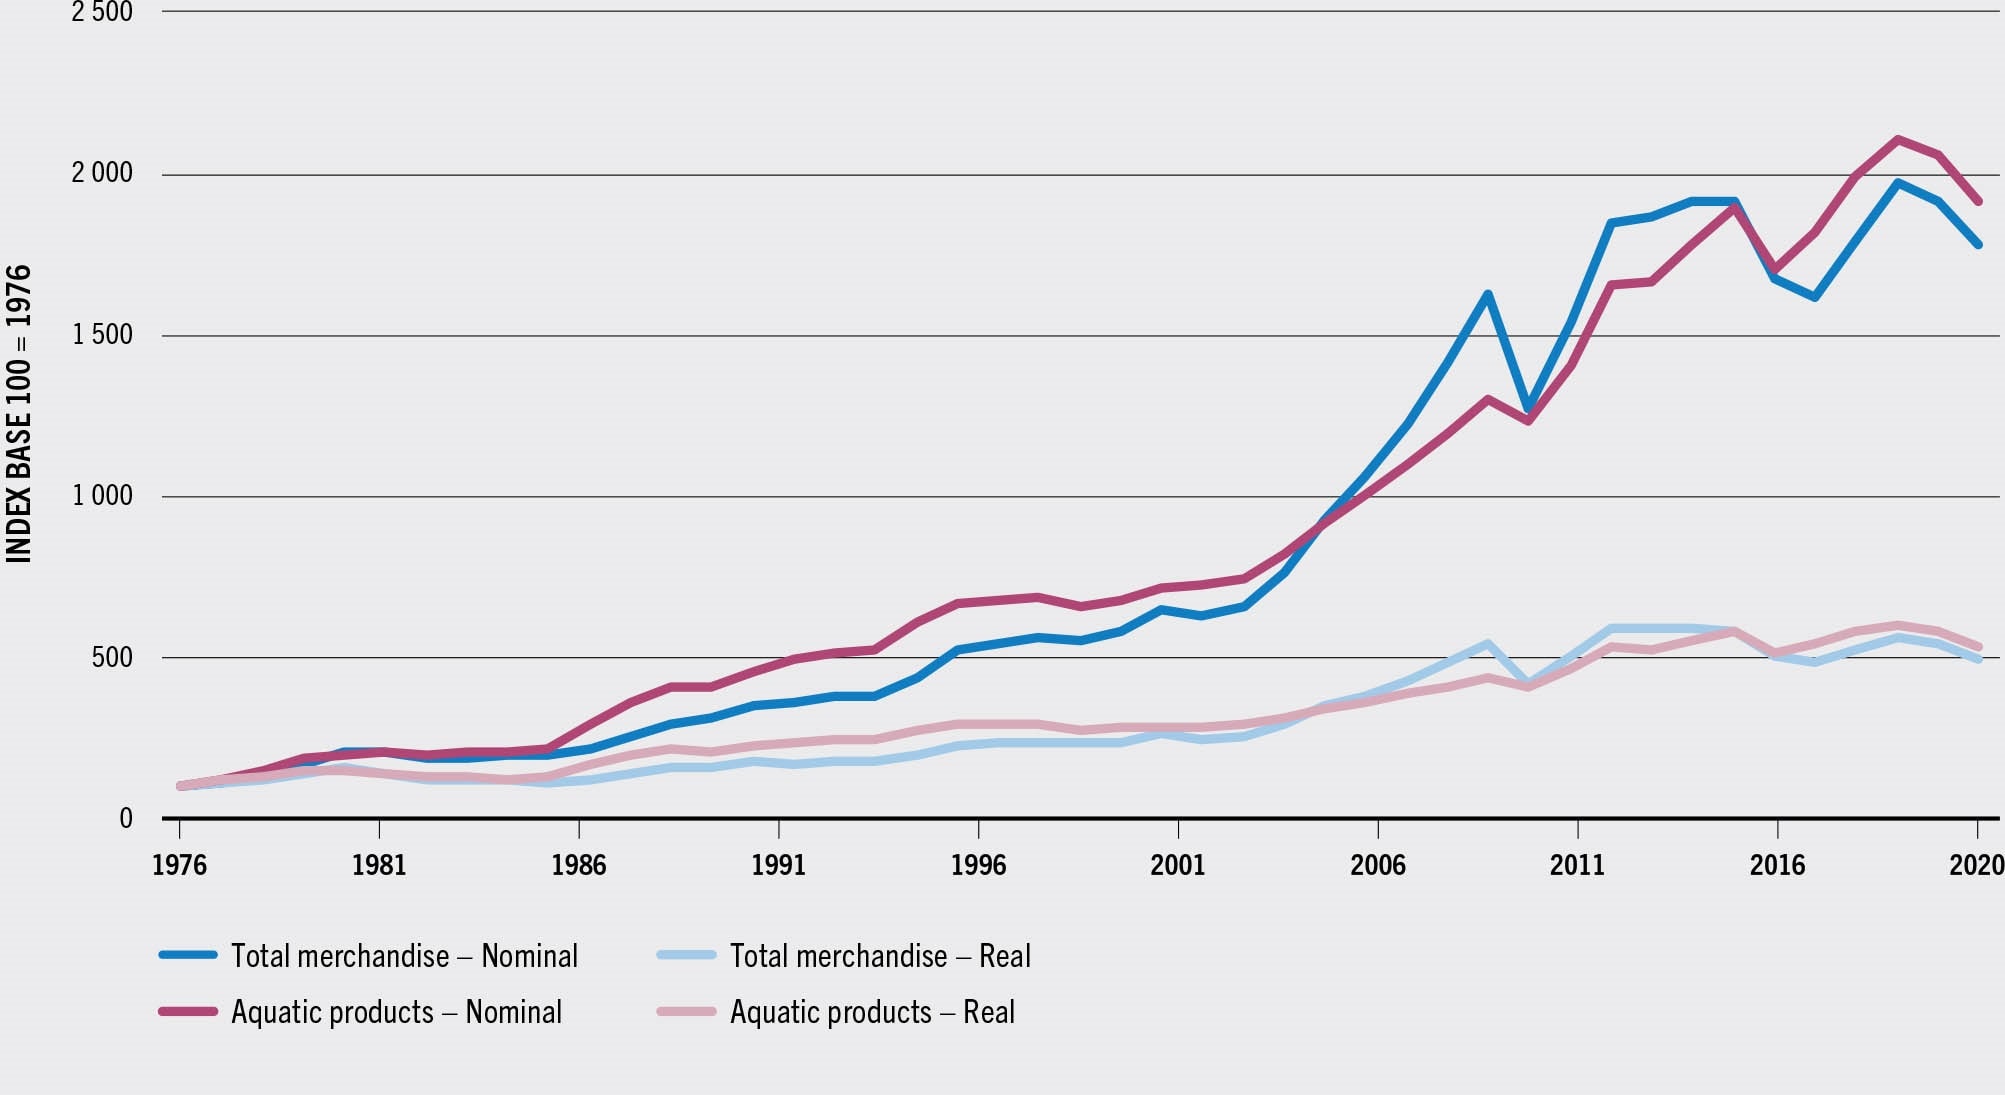
SOURCE: FAO.
In the last decade, several of the key trends characterizing the development of trade in aquatic products since the 1970s have either slowed or reversed. Growth rates in both value and volume have slowed, in absolute and per capita terms. This mirrors slower growth in global trade in general and marks a new phase of maturing global markets in which most aquatic products are traded along well-established routes between long-term trading partners, with relatively limited opportunities for new markets. In parallel, many aquatic food producers in non-high-income countries who have traditionally supplied markets in high-income countries are increasingly supplying a rising domestic demand.
Historically, an important feature of trade flows in aquatic products has been the role of non-high-income nations as suppliers to high-income countries. More developed economies have large populations of urbanized middle class with high levels of disposable income and insufficient domestic supply. This has historically meant that high-income countries have accounted for a large share of world imports of aquatic products (Figure 47). In 1976, high-income countries accounted for 90 percent of the global value of aquatic product imports. In contrast, in 2020, the share of high-income countries in the global value of aquatic product imports was 75 percent. This rise in the share of non-high-income countries reflects the fact that demand has increased at a faster rate in these countries than in high-income countries. This has been particularly true in East and Southeast Asian countries where the urbanized middle class has been expanding rapidly. Looking at the origin of imports in 2020, 56 percent of the value of imports of high-income countries originated from high-income countries (Figure 48), while 39 percent of the value of imports of non-high-income countries originated from high-income countries.
FIGURE 47PERCENTAGE OF GLOBAL VALUE OF IMPORTS OF AQUATIC PRODUCTS1 by economic class, 1976–2020
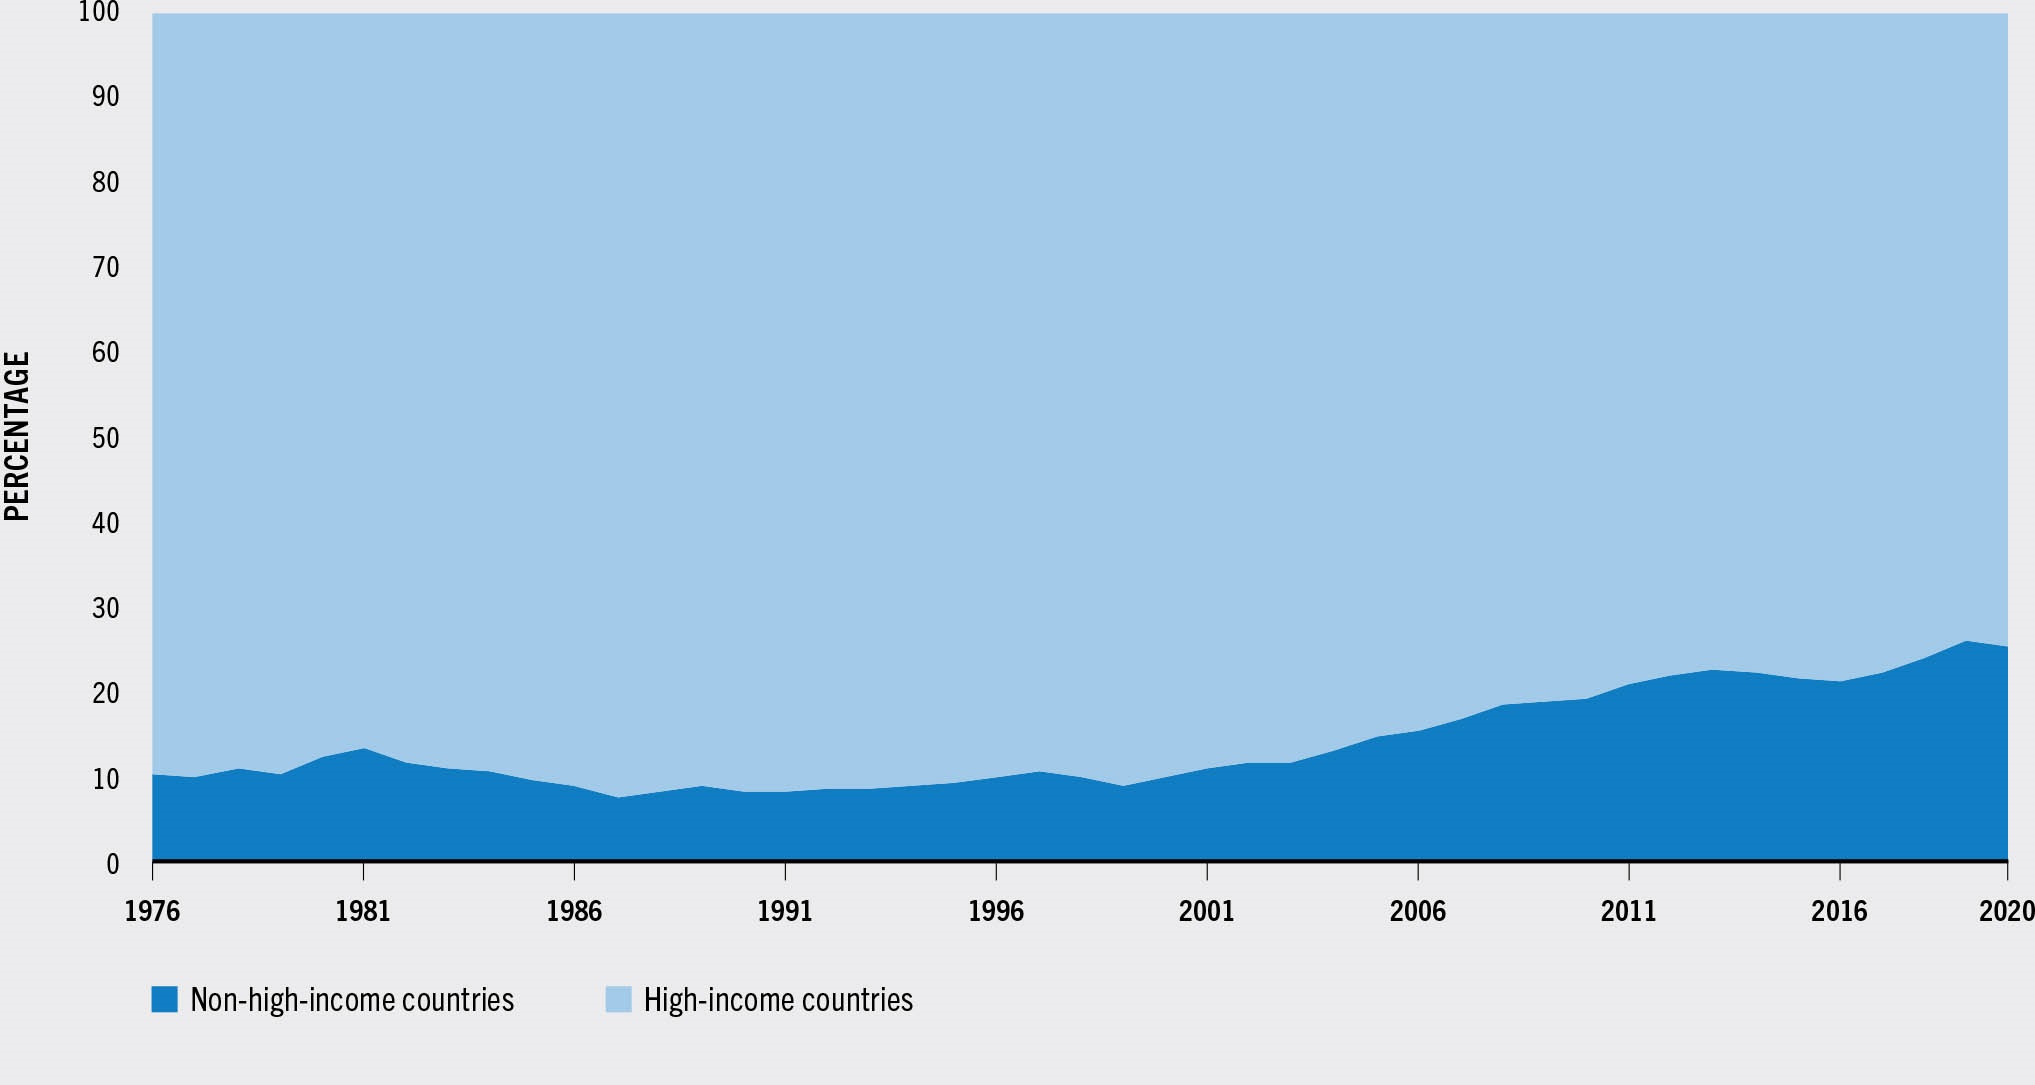
SOURCE: FAO.
FIGURE 48GLOBAL AQUATIC IMPORTS BETWEEN HIGH-INCOME COUNTRIES AND NON-HIGH-INCOME COUNTRIES BY VALUE, 2020
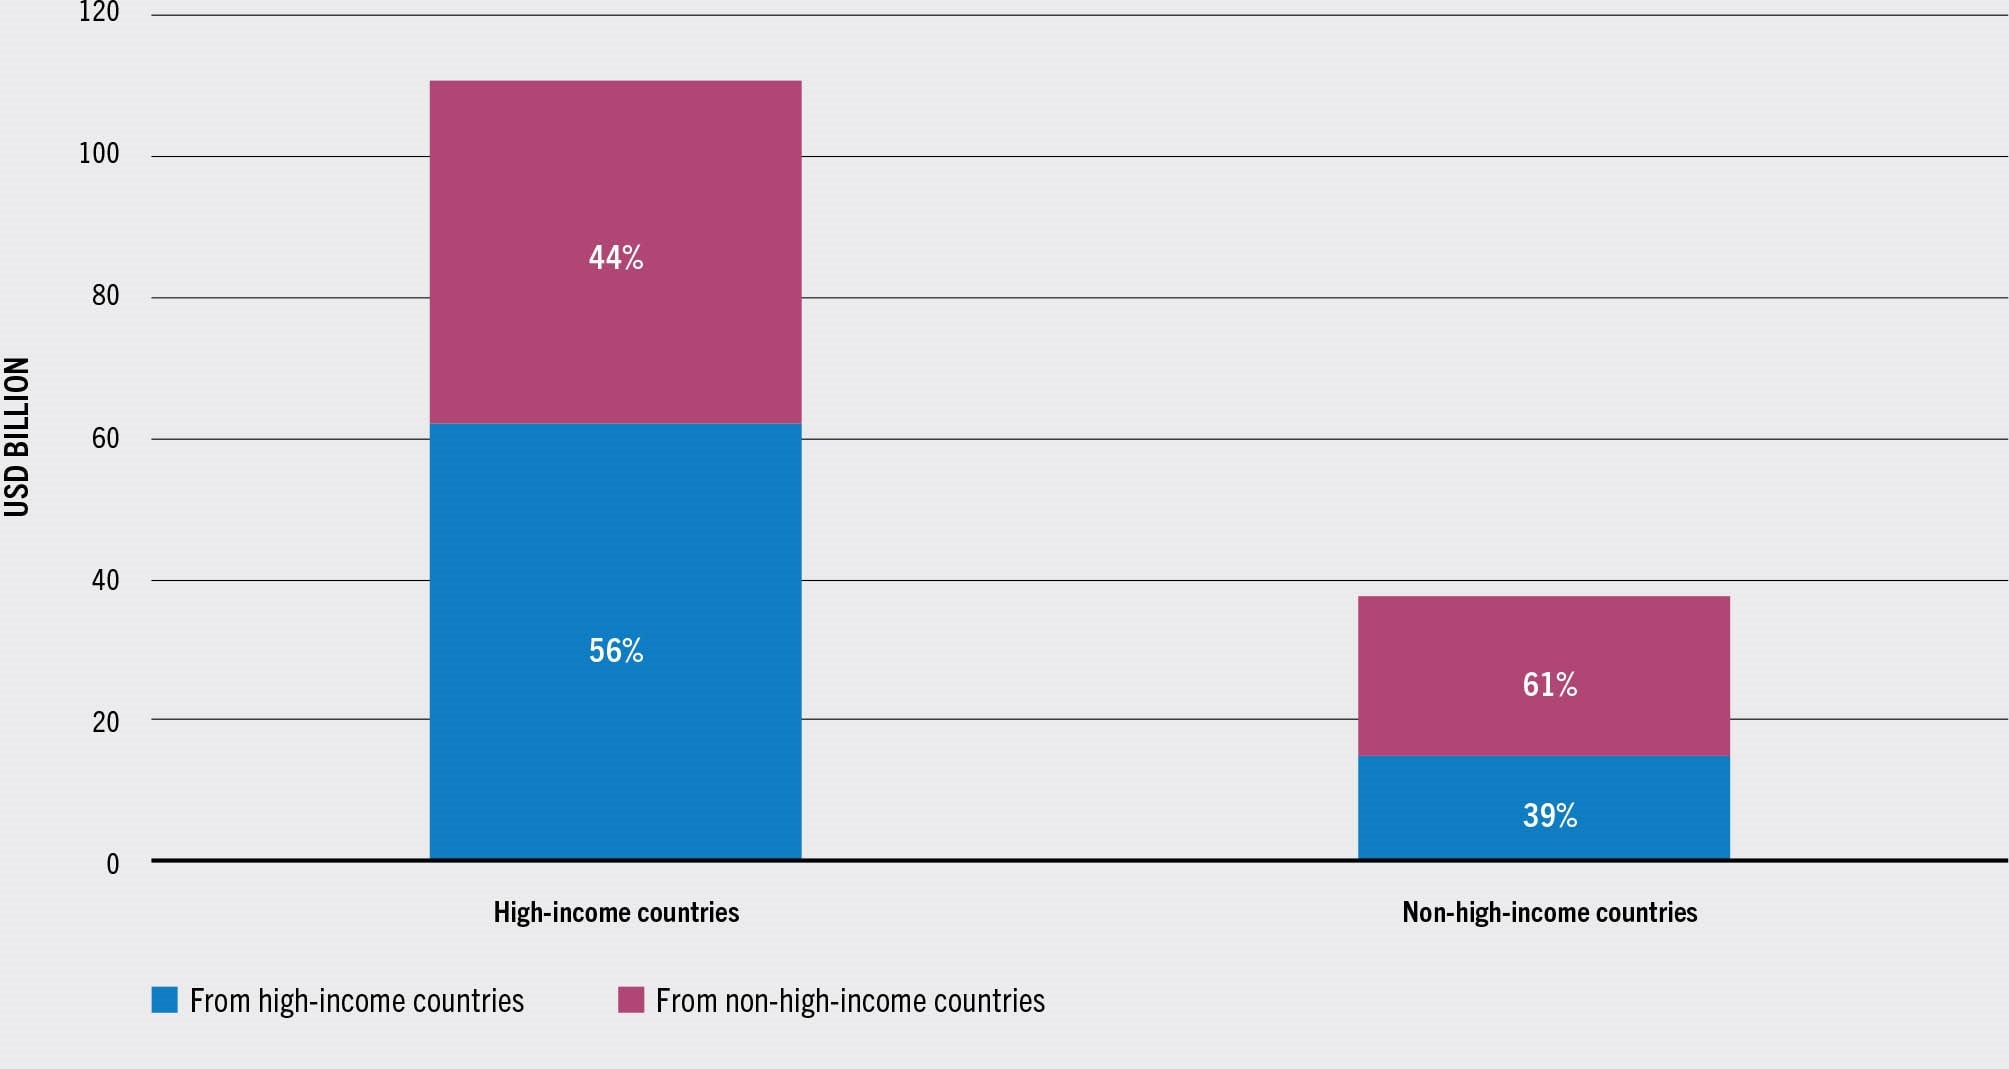
SOURCE: FAO.
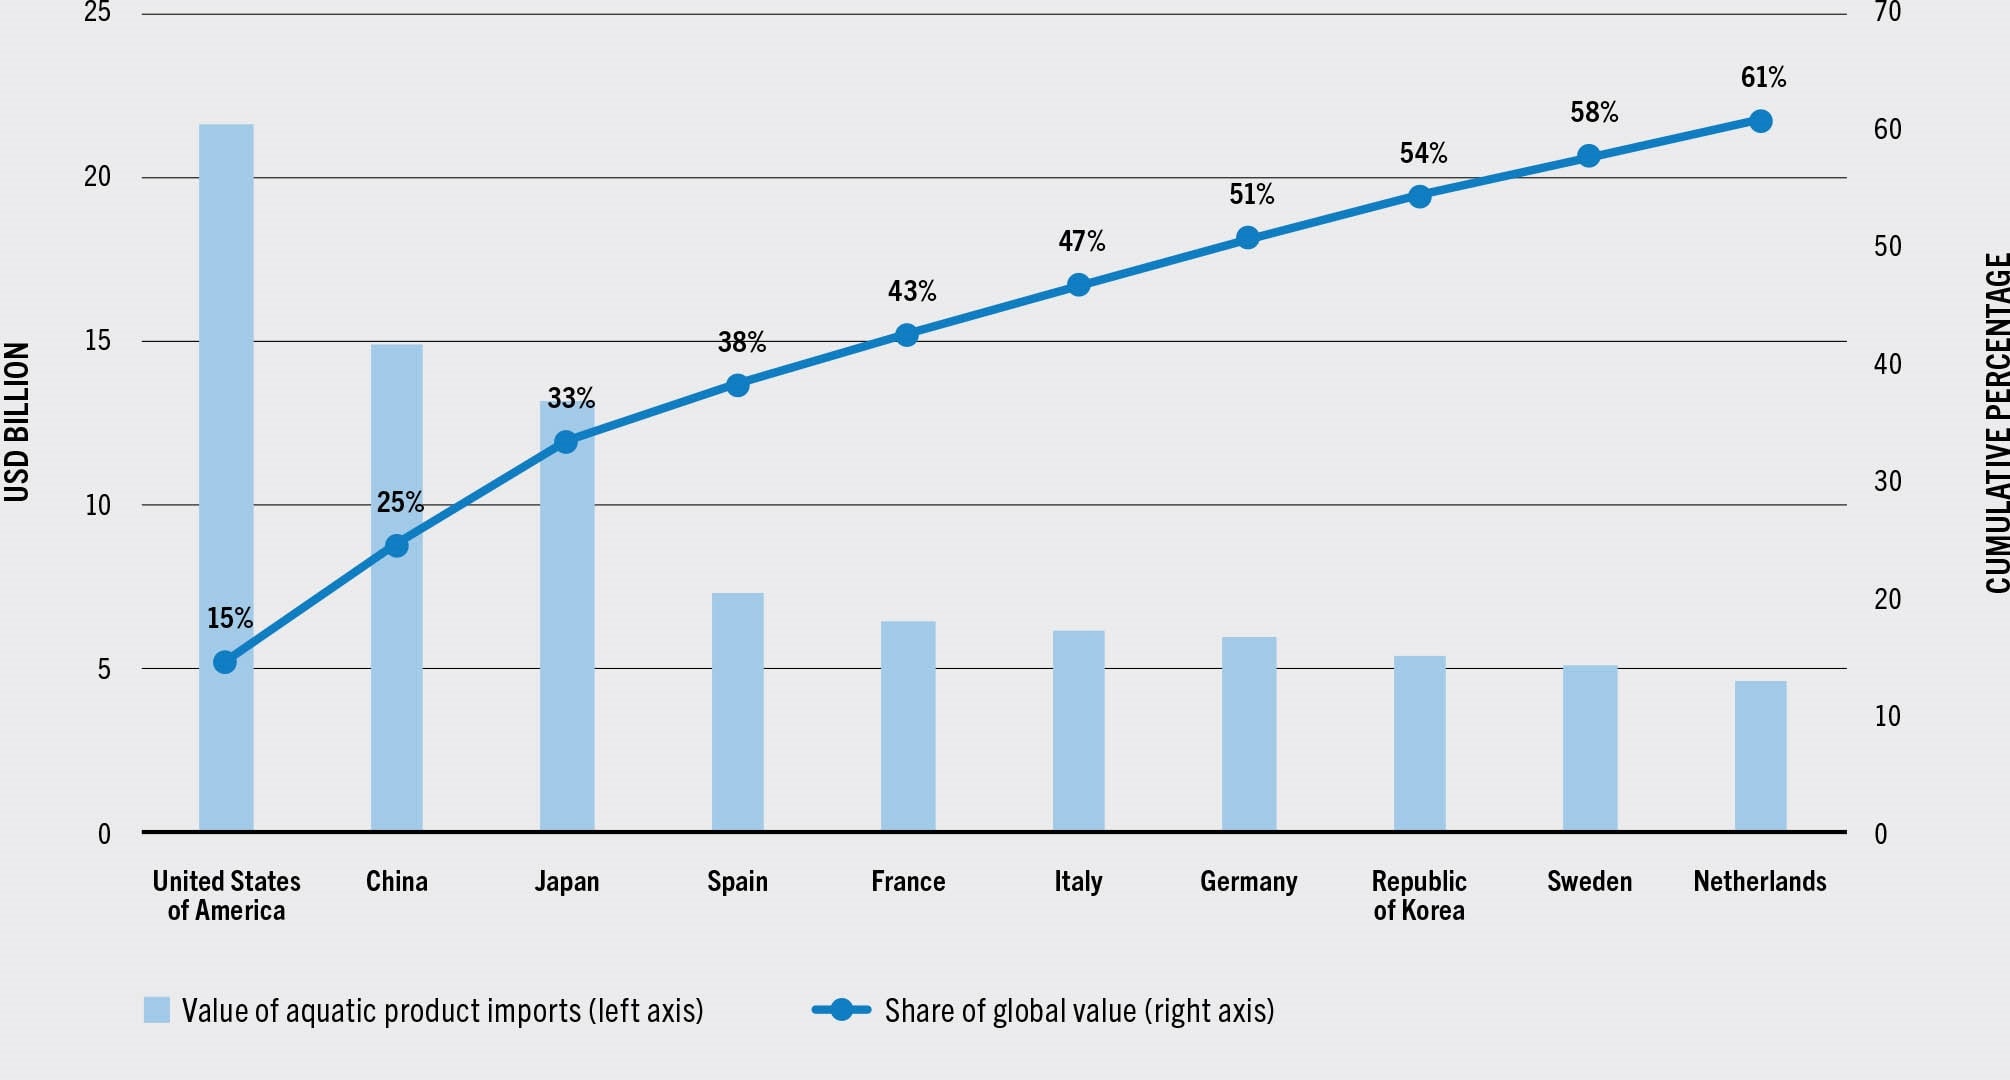
The European Union was the largest single market, accounting for 34 percent (and 16 percent, excluding intra-European Union trade) of the global value of aquatic imports in 2020. In terms of individual countries, the largest importing country in 2020 was the United States of America, accounting for 15 percent of world import value of aquatic products (Figure 49), followed by China (10 percent), Japan (9 percent), Spain (5 percent) and France (4 percent). However, it is worth mentioning that, in terms of volume (live weight), China is the top importing country of aquatic products, far ahead of the United States of America. China imports large quantities of species not locally produced, not only for domestic consumption but also as raw material to be processed in China and then re-exported.
FIGURE 49TOP TEN IMPORTING COUNTRIES OF AQUATIC PRODUCTS1 by value, 2020
SOURCE: FAO.
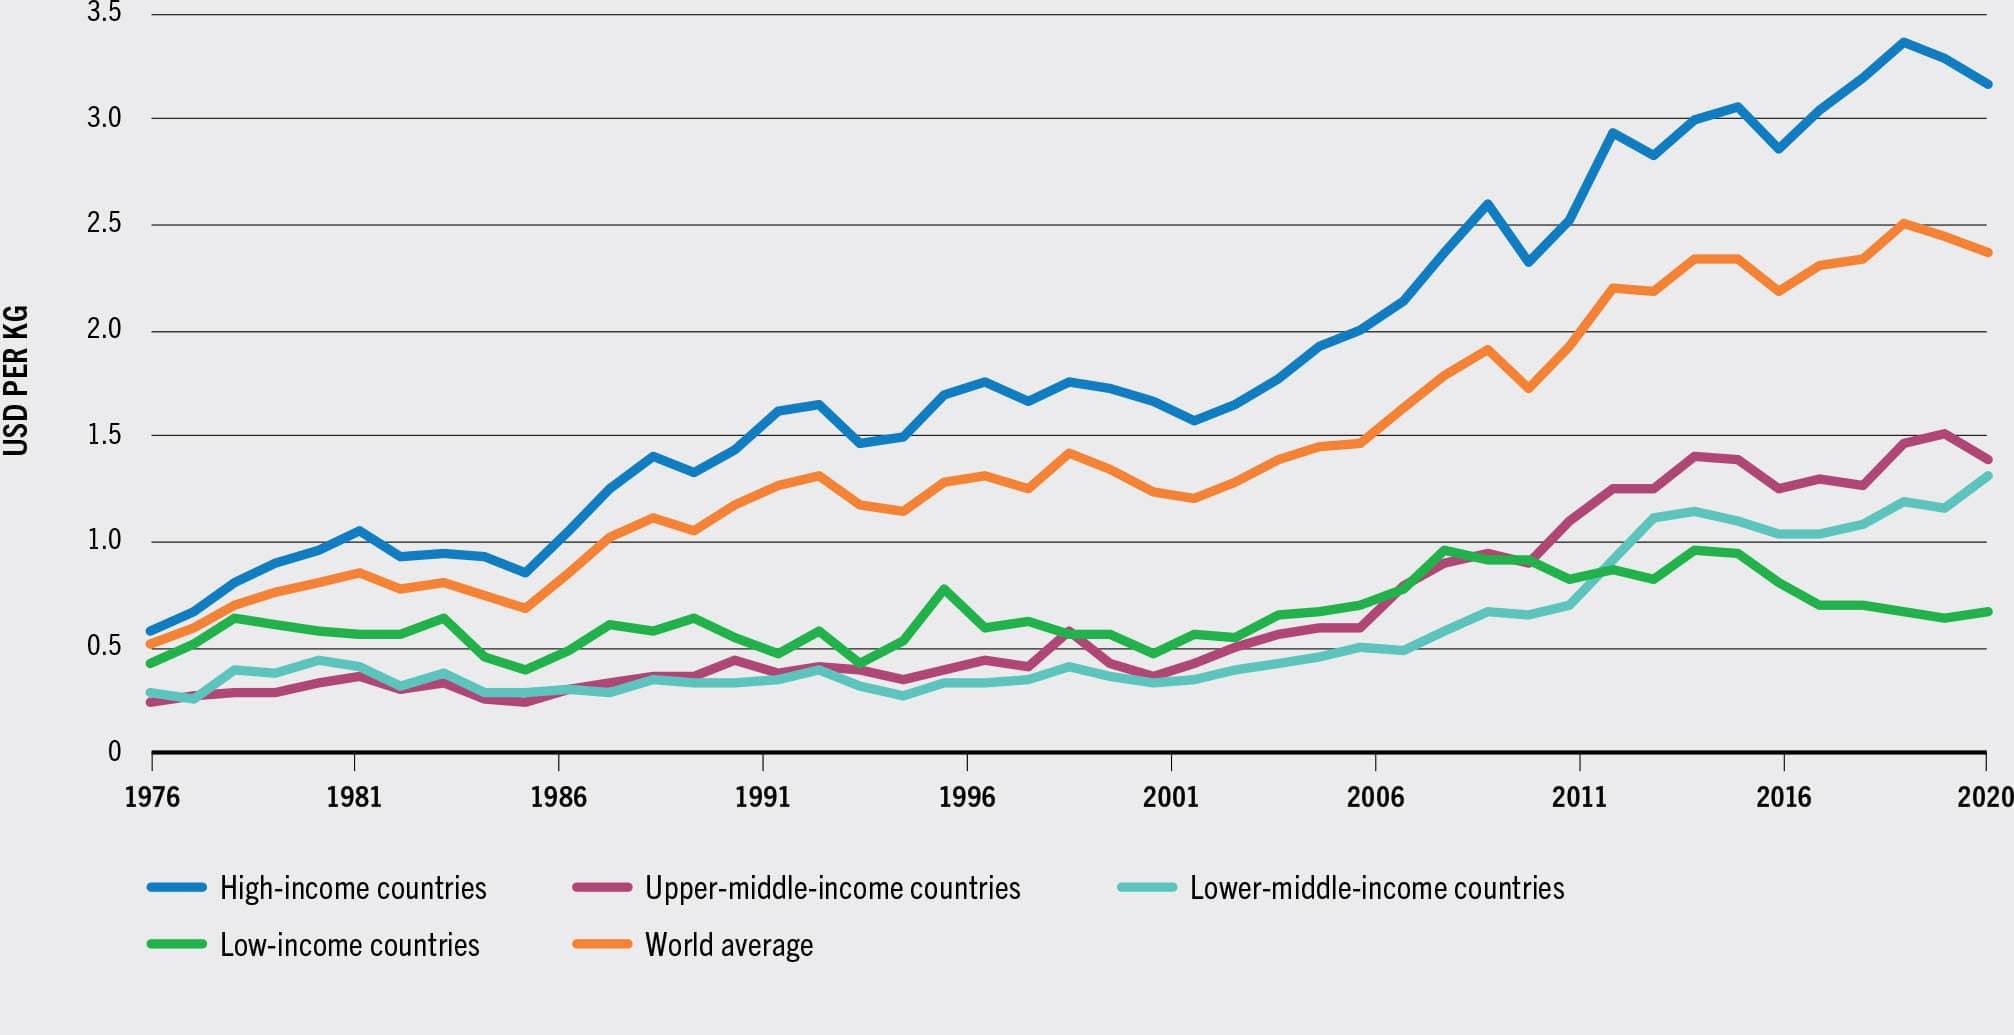
Despite the rising importance of non-high-income countries as importers of aquatic products, significant differences in the average unit value of imports persist between high-income and non-high-income countries (Figure 50). It reflects the preference for high-value species and for more value-added products in high-income countries. In 2020, imports of high-income countries averaged USD 3.2 per kilogram (live weight equivalent) compared with USD 1.4 per kilogram for all remaining countries.
FIGURE 50UNIT VALUE OF IMPORTS OF AQUATIC PRODUCTS BY ECONOMIC CLASS OF IMPORTERS, 1976–2020
SOURCE: FAO.
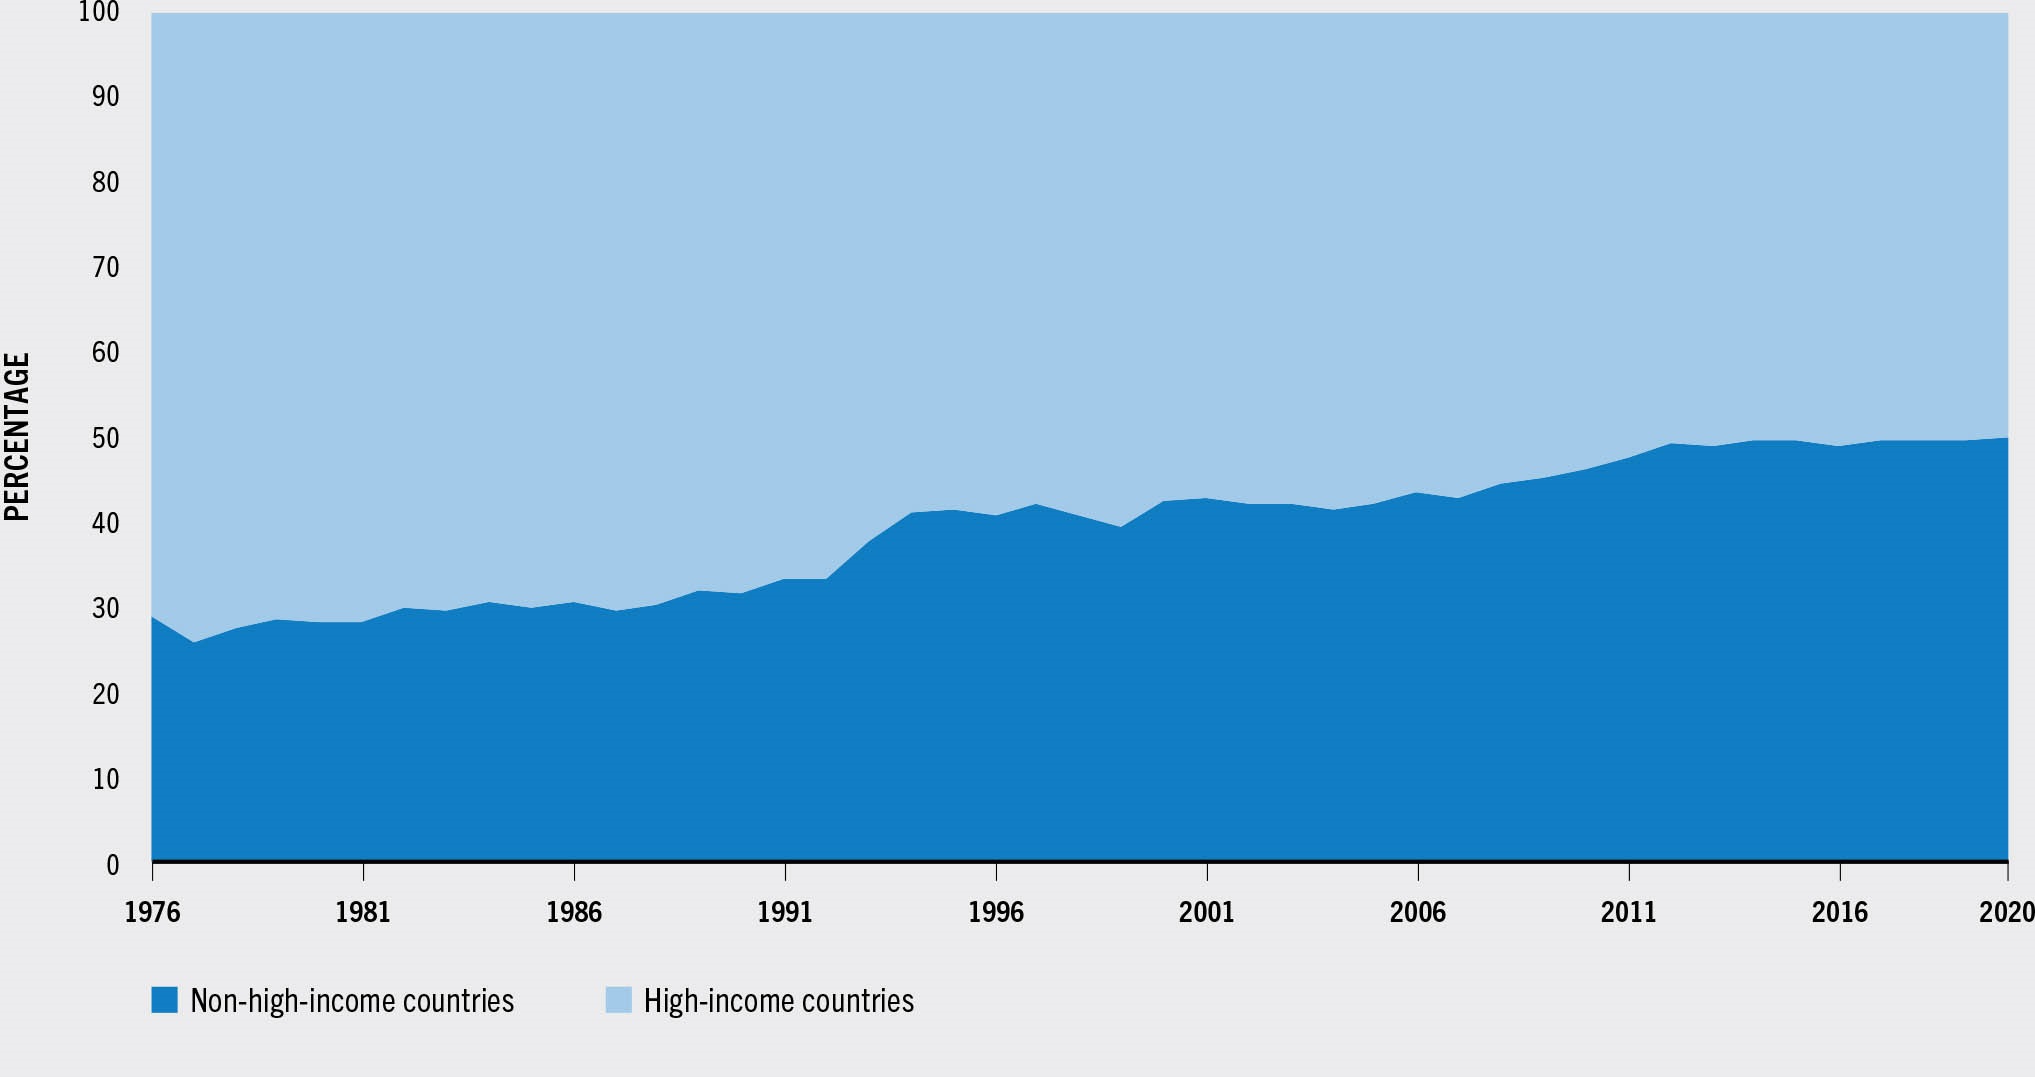
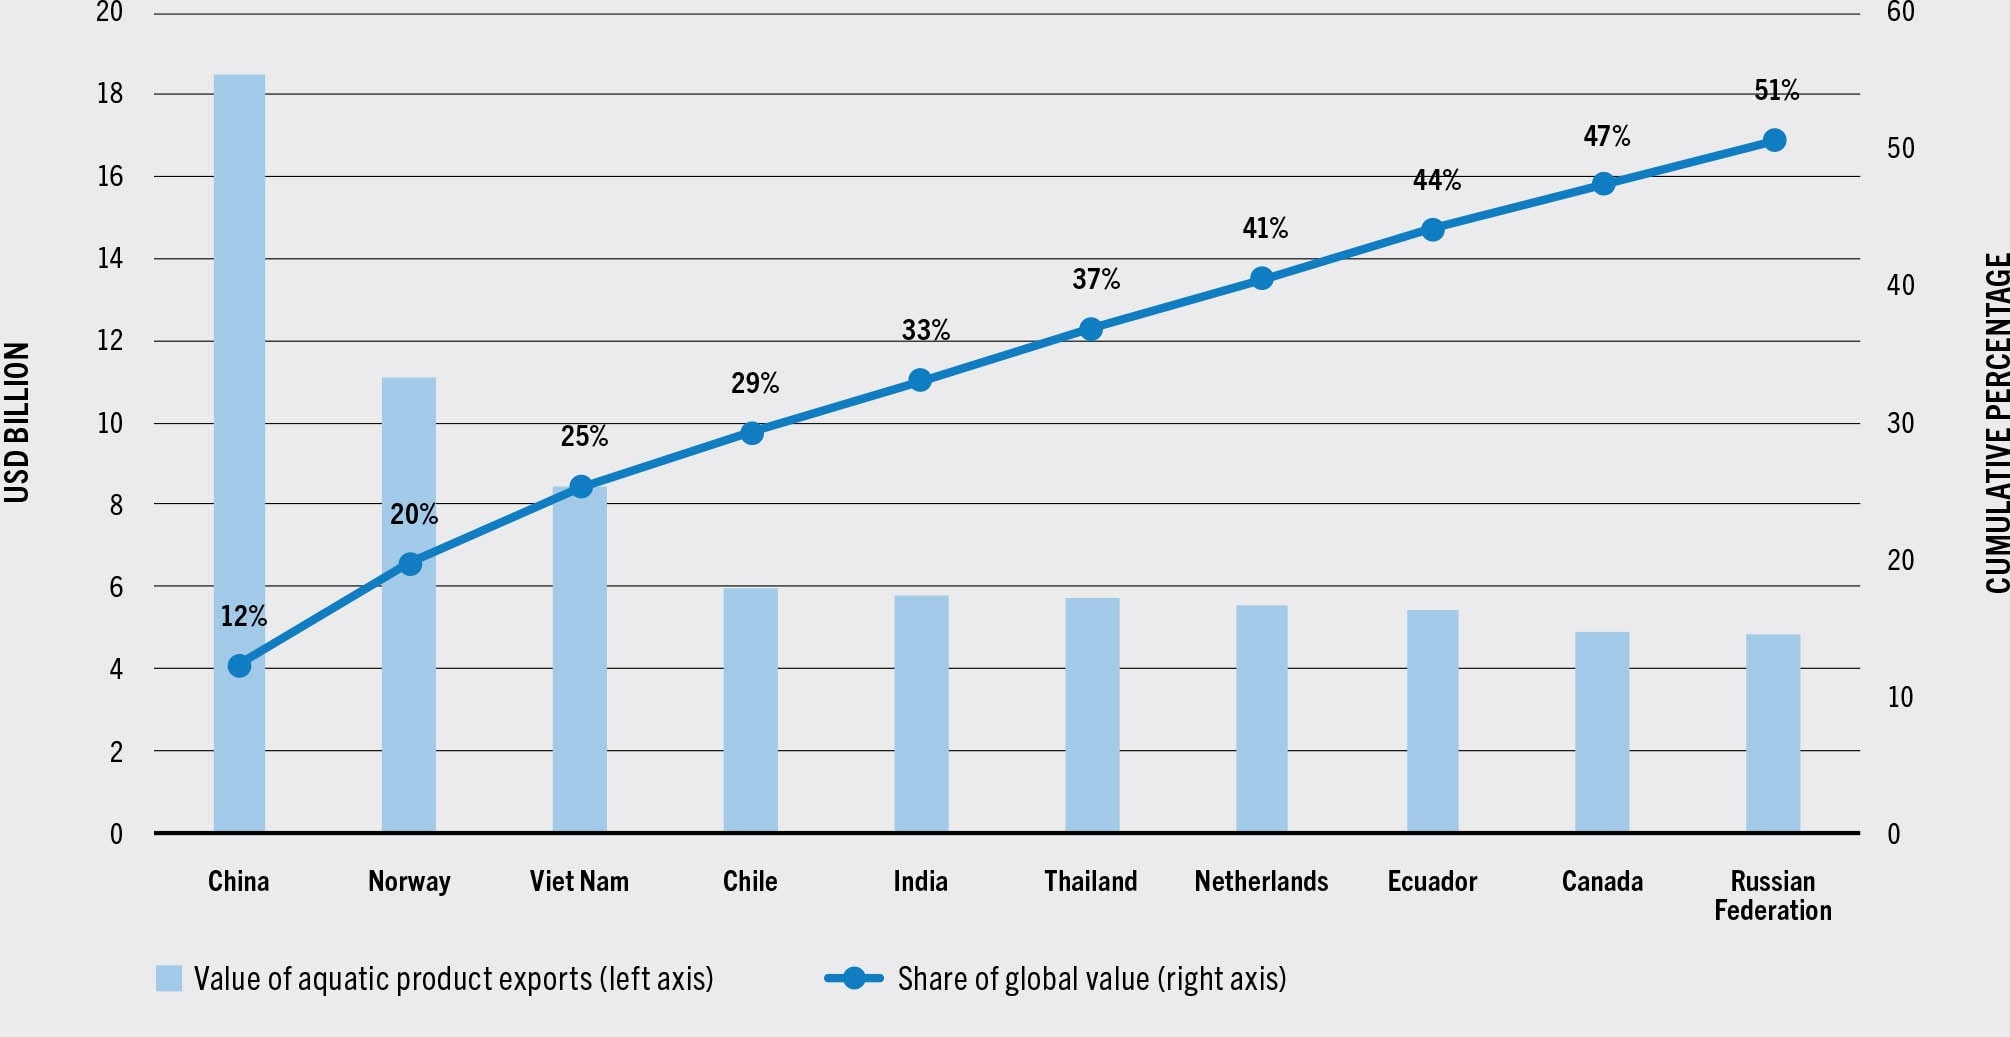
Even though emerging economies became larger importers of aquatic products, the dominant trend in global trade development since the 1970s is their increasing importance as exporters. In 1976, high-income countries accounted for 71 percent of the value of global exports of aquatic products, compared with 50 percent in 2020 (Figure 51). In quantity terms, the share of high-income countries has declined from 67 percent to 46 percent over the same period. The rising prominence of non-high-income nations has been supported by trade liberalization, strong growth in aquaculture production and significant investment in establishing the trading relationships, knowledge and infrastructure necessary for export market development. In addition to their role as global suppliers of aquatic products, non-high-income nations have also become increasingly important as supply chain intermediaries, importing raw material and re-exporting processed or otherwise value-added products. While emerging economies have assumed increasingly important roles as international suppliers of aquatic products, some high-income countries remain significant exporters (Figure 52). Among the top five exporting countries of aquatic products in 2020, two were high-income countries (Norway and Chile), and the remainder non-high-income countries (China, Viet Nam and India).
FIGURE 51PERCENTAGE OF GLOBAL VALUE OF EXPORTS OF AQUATIC PRODUCTS BY ECONOMIC CLASS, 1976–2020
SOURCE: FAO.
FIGURE 52TOP TEN EXPORTING COUNTRIES OF AQUATIC PRODUCTS BY VALUE, 2020
SOURCE: FAO.
China has risen to become the world’s largest producer, exporter and processor of aquatic products. Its exports comprise both large quantities of domestically produced cephalopods, shrimp, tilapia and bivalve molluscs and processed whitefish such as Alaska pollock and cod. As indicated previously, a share of Chinese exports consists of processed aquatic products made from imported raw material. In 2020, China exported USD 18 billion worth of aquatic products, accounting for 12 percent of the global total. Although this share has declined slightly from its 2015 peak, it remains well above historical levels. As a comparison, in 1976, China accounted for only 1.6 percent of the global exports of aquatic products in value. In 2020, China’s top export destinations were Japan, the United States of America and the Republic of Korea, respectively accounting for 18 percent, 11 percent and 9 percent of China’s total aquatic product export value.
Norway has been the second largest exporter of aquatic products since 2004. In 2020, Norway exported USD 11 billion worth of aquatic products, accounting for 7.4 percent of the global total. Norway is the world’s largest producer of farmed Atlantic salmon, and it also records significant catches of small pelagics and groundfish species such as cod. The European Union is by far Norway’s most important market, accounting for 60 percent of Norwegian export value. Viet Nam has been the third largest exporter of aquatic products since 2014 and has become by far the world’s leading producer and exporter of farmed pangasius, supplemented by a large farmed shrimp industry and a significant processing sector. In 2020, Viet Nam exported USD 8.5 billion worth of aquatic products, accounting for 5.6 percent of the global total. Chile, the fourth largest exporter of aquatic products, has leveraged its geographical advantages to develop an extensive aquaculture industry, with the world’s second largest salmonid production supplemented by smaller quantities of mussels. In 2020, Chilean exports of aquatic products totalled USD 5.9 billion, accounting for 3.9 percent of the global value. Supported by strong shrimp production growth, India had become the fourth major exporter in 2017. However, India was overtaken by Chile in 2020 as the value of India’s exports has been on a downward trend since 2018. In 2020, the total value of India’s exports of aquatic products reached USD 5.8 billion, down from USD 7.2 billion in 2017. Other major exporters include the European Union, Thailand, Ecuador, Canada and Indonesia. The European Union itself is the largest exporter in global terms, but the vast majority (78 percent of value) is intra-European Union trade. Moreover, a large proportion of these trade flows consist of re-exported products, either after processing or after initial entry into the European Union market from external sources. In Thailand, a large industry has been established around processing, with a particular focus on canned tuna produced from raw material landed directly in Thai ports by foreign long-distance fleets. Thailand has also built up a large shrimp aquaculture industry, but it has been badly affected in the last decade by disease outbreaks. Ecuadorian exports of aquatic products have increased significantly over the past decade, boosted by the surge in tuna and farmed shrimp production. Canada and the United States of America combined make up 6.4 percent of global export value, but much of this trade takes place between the two nations, with each representing the other’s leading trading partner. Indonesia is also one of today’s largest suppliers of farmed shrimp to the world market, while also playing a key role as a tuna and tilapia exporter.
Despite experiencing strong growth in the value of its aquatic product exports over time, Africa accounted for under 5 percent of the global export value in 2020. Morocco and Mauritania export significant quantities of cephalopods and small pelagics, mainly to the European and Japanese markets, but also to African countries. Several Western African nations also export substantial volumes of tuna, mainly canned, to Europe. As importers of aquatic products, African nations play a relatively small role in global terms, accounting for 3.3 percent of the total import value in 2020. African imports primarily consist of small pelagics of low unit values. However, it is worth noting that while Africa is a net exporter in terms of value, the continent is a net importer in terms of volume. Considering that many food-insecure nations are located in Africa (FAO et al., 2021), it is also important to recognize the role that trade may play in supporting food security. Trade can have an impact on food security via multiple channels, of which perhaps the most immediate is nutrient transfer. Imports of large volumes of small pelagic species of low unit value by African nations are nutritionally rich, in particular in terms of their high levels of micronutrients. The export of species with higher unit values, such as tuna, shrimp and cephalopods, in conjunction with the import of these nutritionally rich species, amounts to an advantageous exchange in nutritional terms. At the same time, the generation of export revenue has potentially positive implications for food security by contributing to employment and income generation. Income gains translate into increased food affordability which can reduce food insecurity and malnutrition via improved access to aquatic food and nutrition (FAO et al., 2021).
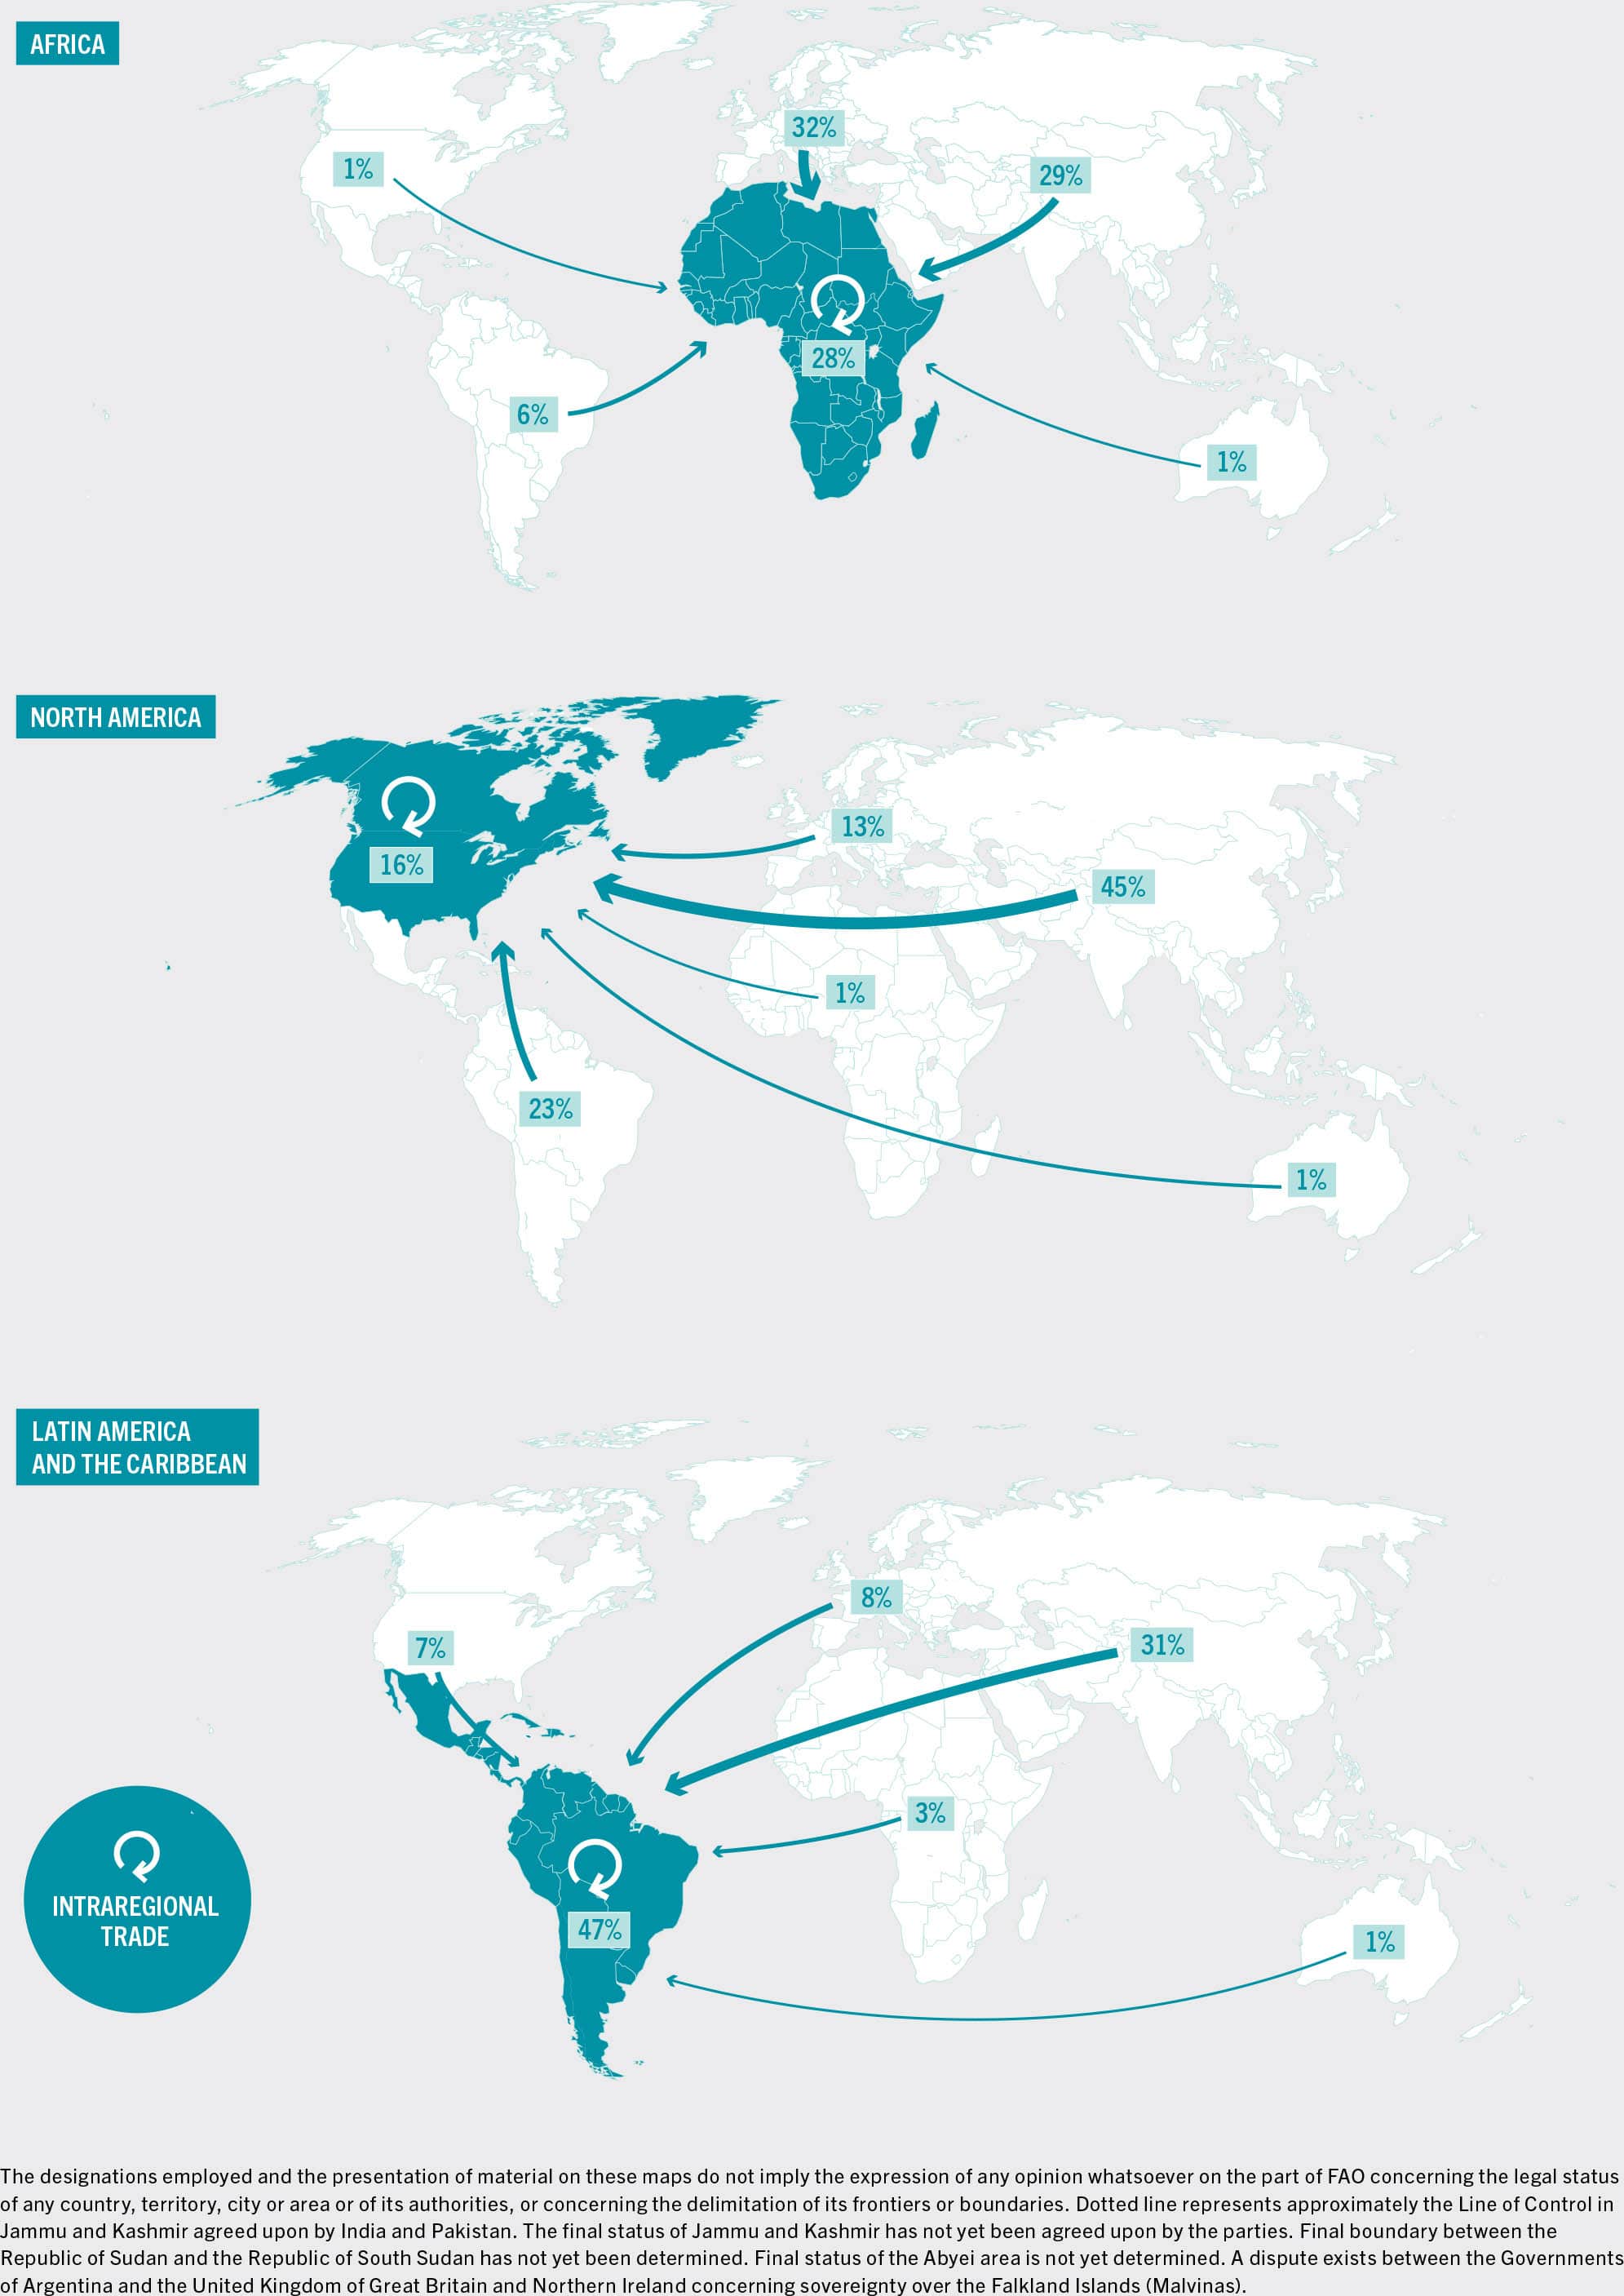
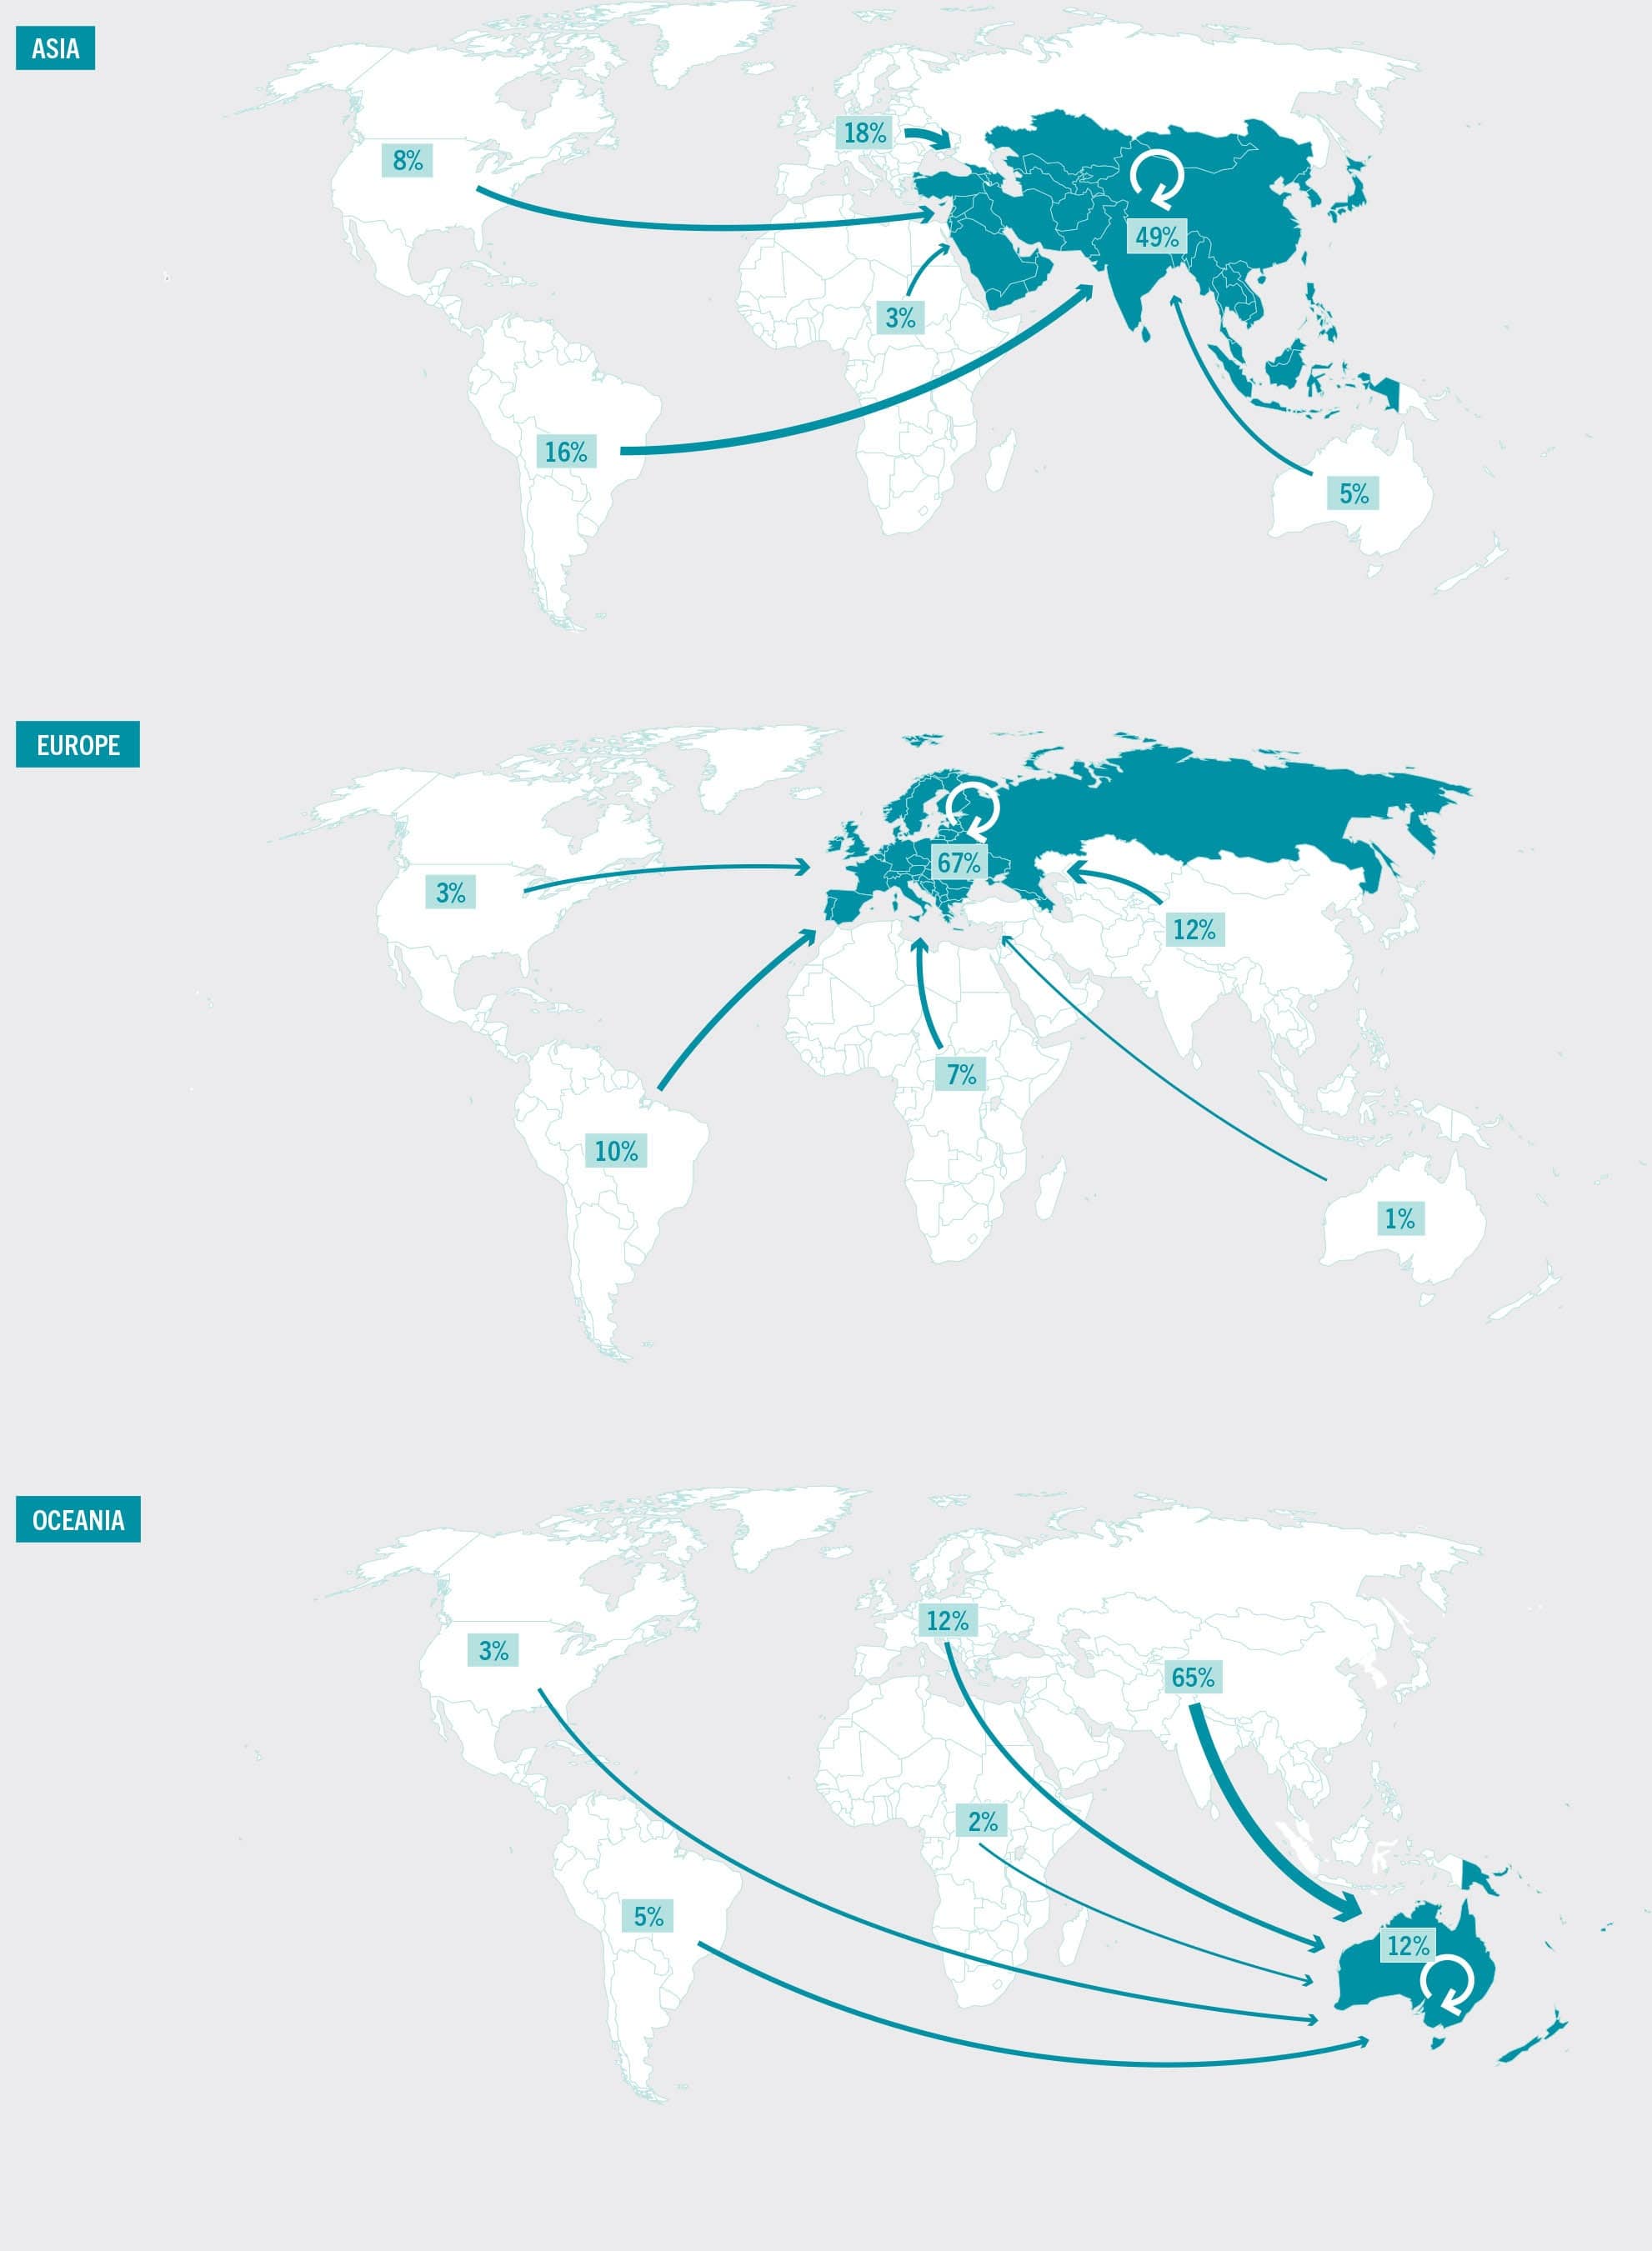
International trade has been accelerated by the creation of the World Trade Organization (WTO), and also within the context of multilateral, regional and bilateral trade agreements. These agreements, which establish preferential terms of trade between two or more trading partners, have become increasingly important in facilitating international trade by reducing or removing barriers including tariffs and technical barriers to trade (TBT). In particular, interregional trade has been enabled by regional trade agreements (RTAs), which have been increasing since the 1990s (Figure 53). However, it is worth noting that this trade is often not adequately reflected in official statistics, in particular for Africa and selected countries in Asia and Oceania. RTAs such as the European Union Customs Union, the North American Free Trade Agreement, the Association of Southeast Asian Nations, the Southern African Development Community and the Southern Common Market have been key drivers of global trade expansion in recent decades, and trade in fisheries and aquaculture products has benefited as part of this broader trend. RTAs often extend beyond trade terms and may also include provisions covering fisheries management and traceability, which can strengthen institutional oversight of shared resources and contribute to sustainable fisheries management.
FIGURE 53TRADE FLOWS OF AQUATIC PRODUCTS BY REGION (SHARE OF TOTAL IMPORTS, IN VALUE), 2020
SOURCE: FAO.
Tariff policies have historically been used by governments to generate income from trade, to protect domestic industries from international competition and as punitive measures taken against other nations in the context of trade disputes. Aquatic products are classified as industrial goods by the WTO, meaning they are grouped under non-agricultural market access negotiations. Under the WTO principle of most-favoured nation, applied tariffs for fisheries and aquaculture products range from 0 percent to 30 percent, with an average of 14 percent (FAO, 2017b). Bound tariffs, which are effectively the maximum tariff in a given category under WTO rules, range from 0 percent to 60 percent, with an average of 35 percent. These figures point to the generally low level of applied tariffs on imports of fisheries and aquaculture products, despite some reintroduced tariffs and some concern over tariff escalation in the case of processed and value-added products. The large high-income importing countries, such as the European Union, the United States of America and Japan, apply reduced or zero tariffs on the majority of imports from countries qualifying for such treatment under the Generalized System of Preferences, which contributed to the rapid development of aquatic product exports in economically emerging countries. In contrast, many emerging countries still apply relatively high tariffs for fisheries and aquaculture products that can reflect fiscal policies or protective measures. Tariff escalation29 continues to be a serious issue for many countries and products, particularly in accessing some high-income markets and expanding regional trade.
Technical barriers to trade are non-tariff barriers that can include any regulations, requirements or standards that impose an additional burden on trading parties. These may include both mandatory requirements or regulations and voluntary standards. Product standards, sanitary and phytosanitary measures, procedures for import licensing and rules of origin, and labelling requirements are all examples of TBTs applied to aquatic products. Traders of perishable aquatic products are also affected by customs and clearance procedures. The WTO TBT Agreement recognizes that these requirements, standards and procedures are necessary to protect human health, ensure product quality and safeguard the environment, but they should be non-discriminatory. In practice, TBTs can effectively block market access for countries lacking the necessary capacity, infrastructure, technology and technical knowledge to address them. TBTs are an important topic for fisheries and aquaculture products. In particular, the United Nations Conference on Trade and Development estimates there are on average 2.5 times more technical measures applied to fisheries and aquaculture products than to manufactured products.
Traceability and catch documentation are core components of compliance with food safety regulations and controls to combat illegal, unreported and unregulated fishing (IUU fishing). Ecolabels and certification schemes communicating to buyers and consumers that aquatic products are sourced from well-managed fisheries can impose additional burdens on exporters. Thus, it has become increasingly important to ensure that TBTs applied to aquatic products strike a fair balance between allowing market access and protecting both consumers and the resource. International cooperation in the design and assessment of TBTs, and subsequent efforts to facilitate compliance by streamlining procedures and harmonizing standards, are important prerequisites for achieving this balance. The FAO Agreement on Port State Measures to Prevent, Deter and Eliminate Illegal, Unreported and Unregulated Fishing also contributes to protect both consumers and the resource, by allowing countries to impose trade restrictions at the port of entry in order to avoid the unloading of products originating from IUU fishing. The WTO Trade Facilitation Agreement that entered into force in February 2017 is expected to help overcome some of the challenges associated with customs procedures and expedite the movement, release and clearance of goods across borders.
Growth in trade of aquatic products in the long term is driven by trade policy shifts in addition to economic and demographic fundamentals, but over shorter time horizons, trade dynamics are dependent on a number of different factors. First, as for trade in general, trade in aquatic products is quite sensitive to economic conditions. Levels of aquatic food consumption correlate positively with income, meaning that periods of economic recession typically lead to a contraction in trade of aquatic products. Other important factors include geopolitical shifts, currency trends, logistical costs and delays, and major shocks to supply such as disease outbreaks or climatic events.
For example, in recent years, two significant developments have affected aquatic product trade. First, in 2018 new tarriff regimes between the United States of America and China, two of the world’s largest trading partners, affected several heavily traded fisheries and aquaculture products, including lobster and tilapia. While new tariff regimes represent obstacles for existing suppliers, the new environment creates opportunities for alternative suppliers. An example is how the additional costs borne by China’s tilapia sector, traditionally the major supplier to the top market of the United States of America, have translated into a competitive advantage for the emerging Latin American tilapia export industry.
Another change affecting the dynamics of trade in fisheries and aquaculture products is the exit of the United Kingdom from the European Union. This transition has resulted in the introduction of new procedures for customs checks, food safety inspections and documentation, and product labelling. The additional administrative burden led to severe logistical bottlenecks for aquatic product traders of the United Kingdom in early 2021, disproportionally affecting small and medium businesses. Although progress has been made in streamlining these processes, uncertainties remain regarding the specifics of the framework under which trade will be conducted in the future.
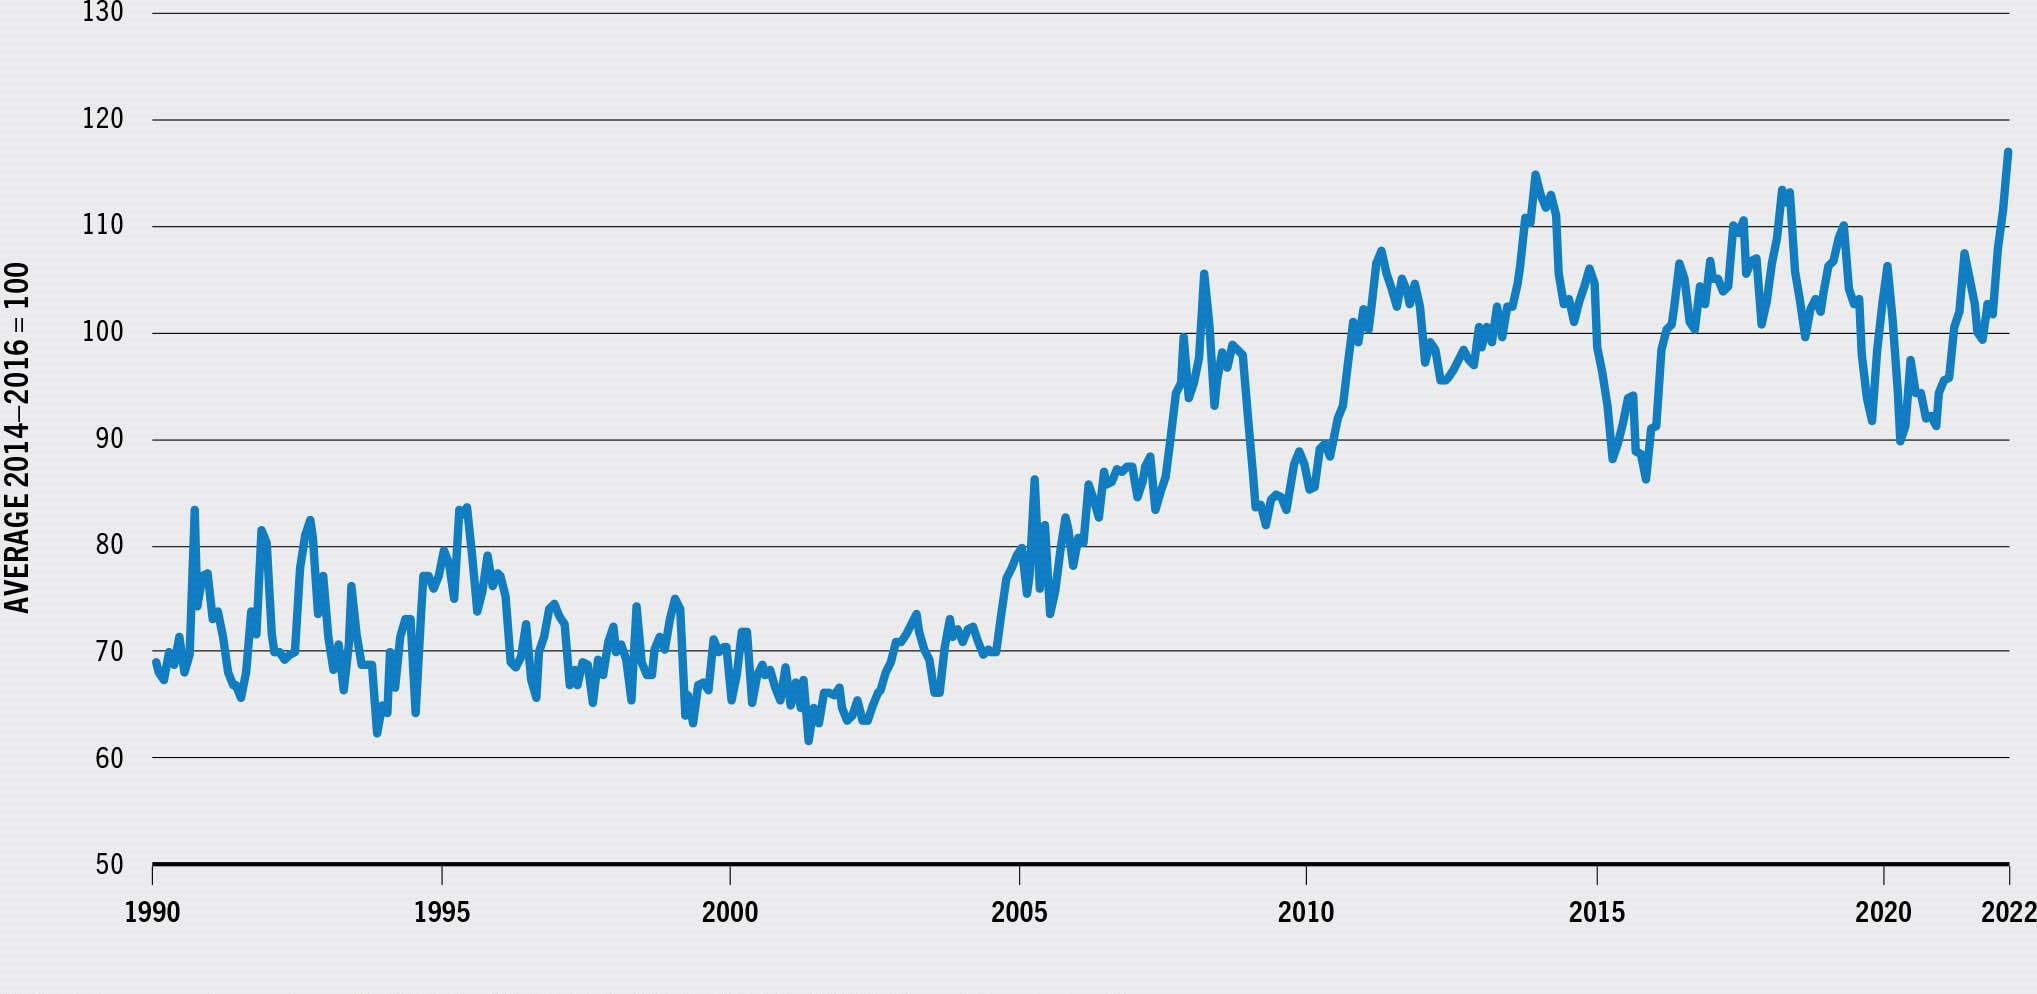
The COVID-19 pandemic has brought an array of challenges for international trade of aquatic products. These impacts and their causes and implications are presented in the section COVID-19, a crisis like no other (p. 195) Furthermore, the pandemic caused an estimated 7.0 percent drop in the value of global aquatic product exports, falling to USD 151 billion in 2020. This followed on from a 2.1 percent decline in 2019 compared with the peak reached in 2018. In 2020, traded volumes fell by an estimated 10.1 percent, with declines in trade recorded across all regions. As fishing and aquaculture resumed and international markets opened, 2021 recorded a strong recovery in trade. In 2021, the total value of global exports of aquatic products went up 12 percent compared with 2020. Meanwhile, growth in traded volumes was more limited, due to the impact of conservative planning on aquaculture supply and continued logistical challenges. Prices went up in 2021. According to the FAO fish price index,30 the average international fish prices were 7.2 percent higher in 2021 than in 2020, when prices were 7.2 percent lower than in 2019 (Figure 54). Estimates for the first two months of 2022 indicate that prices were 19 percent higher compared with the same period in 2021.
FIGURE 54FAO FISH PRICE INDEX
SOURCE: FAO.
Main traded commodities
Traded fisheries and aquaculture products are diverse in terms of species, origin, product form, packaging and method of preservation. This creates challenges for gathering consistent and accurate trade statistics while underlining the importance of such statistics to understand a complex marketplace. Trade statistics are compiled by customs agencies and statistical bodies in the countries and territories participating in trade, within the coding and classification framework of the Harmonized Commodity Description and Coding System (HS). This framework is maintained by the World Customs Organization (WCO). At the highest level of disaggregation, this framework defines six-digit codes associated with specific product classifications that should be applied uniformly by all reporting bodies. Longer codes providing classifications at lower levels of aggregation may be introduced by individual countries and territories. The HS system is the foundation for tariff legislation in addition to collecting data to be consulted and used by trade analysts, academia, industry, governments, non-governmental organizations and intergovernmental organizations, offering valuable insight into trade and market trends and structure over time. To improve the utility of HS statistics, FAO worked with the WCO in 2012 and 2017 to revise the HS codes and classifications in order to better reflect the underlying features of the international trade of aquatic products. However, further disaggregation is necessary to distinguish wild-caught versus farmed aquatic animals in trade statistics. In addition to the production process itself, aquaculture differs from capture fisheries in many fundamental ways, including business and industry structure, inputs, risk factors, environmental impact and infrastructure requirements. Each of these differences has implications for the dynamics and development of global trade.
Nearly 90 percent of the quantity (live weight equivalent) of traded aquatic products consists of preserved products, the majority of which frozen. However, demand for fresh aquatic products and the advancement of packaging and logistical technologies have seen the proportion of fresh products in trade volumes increase over time. In 1976, fresh products accounted for 5.8 percent of the quantity (live weight) of trade of aquatic products compared with 11.1 percent in 2020. Airfreight has enabled the development of export of high-end fresh aquatic products, such as farmed salmon, or capture demersal finfish species. The COVID-19 pandemic temporarily reversed this trend, due to the shutdown of food services and a shift in the purchasing behaviour of consumers subject to lockdown restrictions. However, the surge in demand for products such as canned tuna observed in the early stages of the pandemic is now fading, and it is expected to return to its long-term trend.
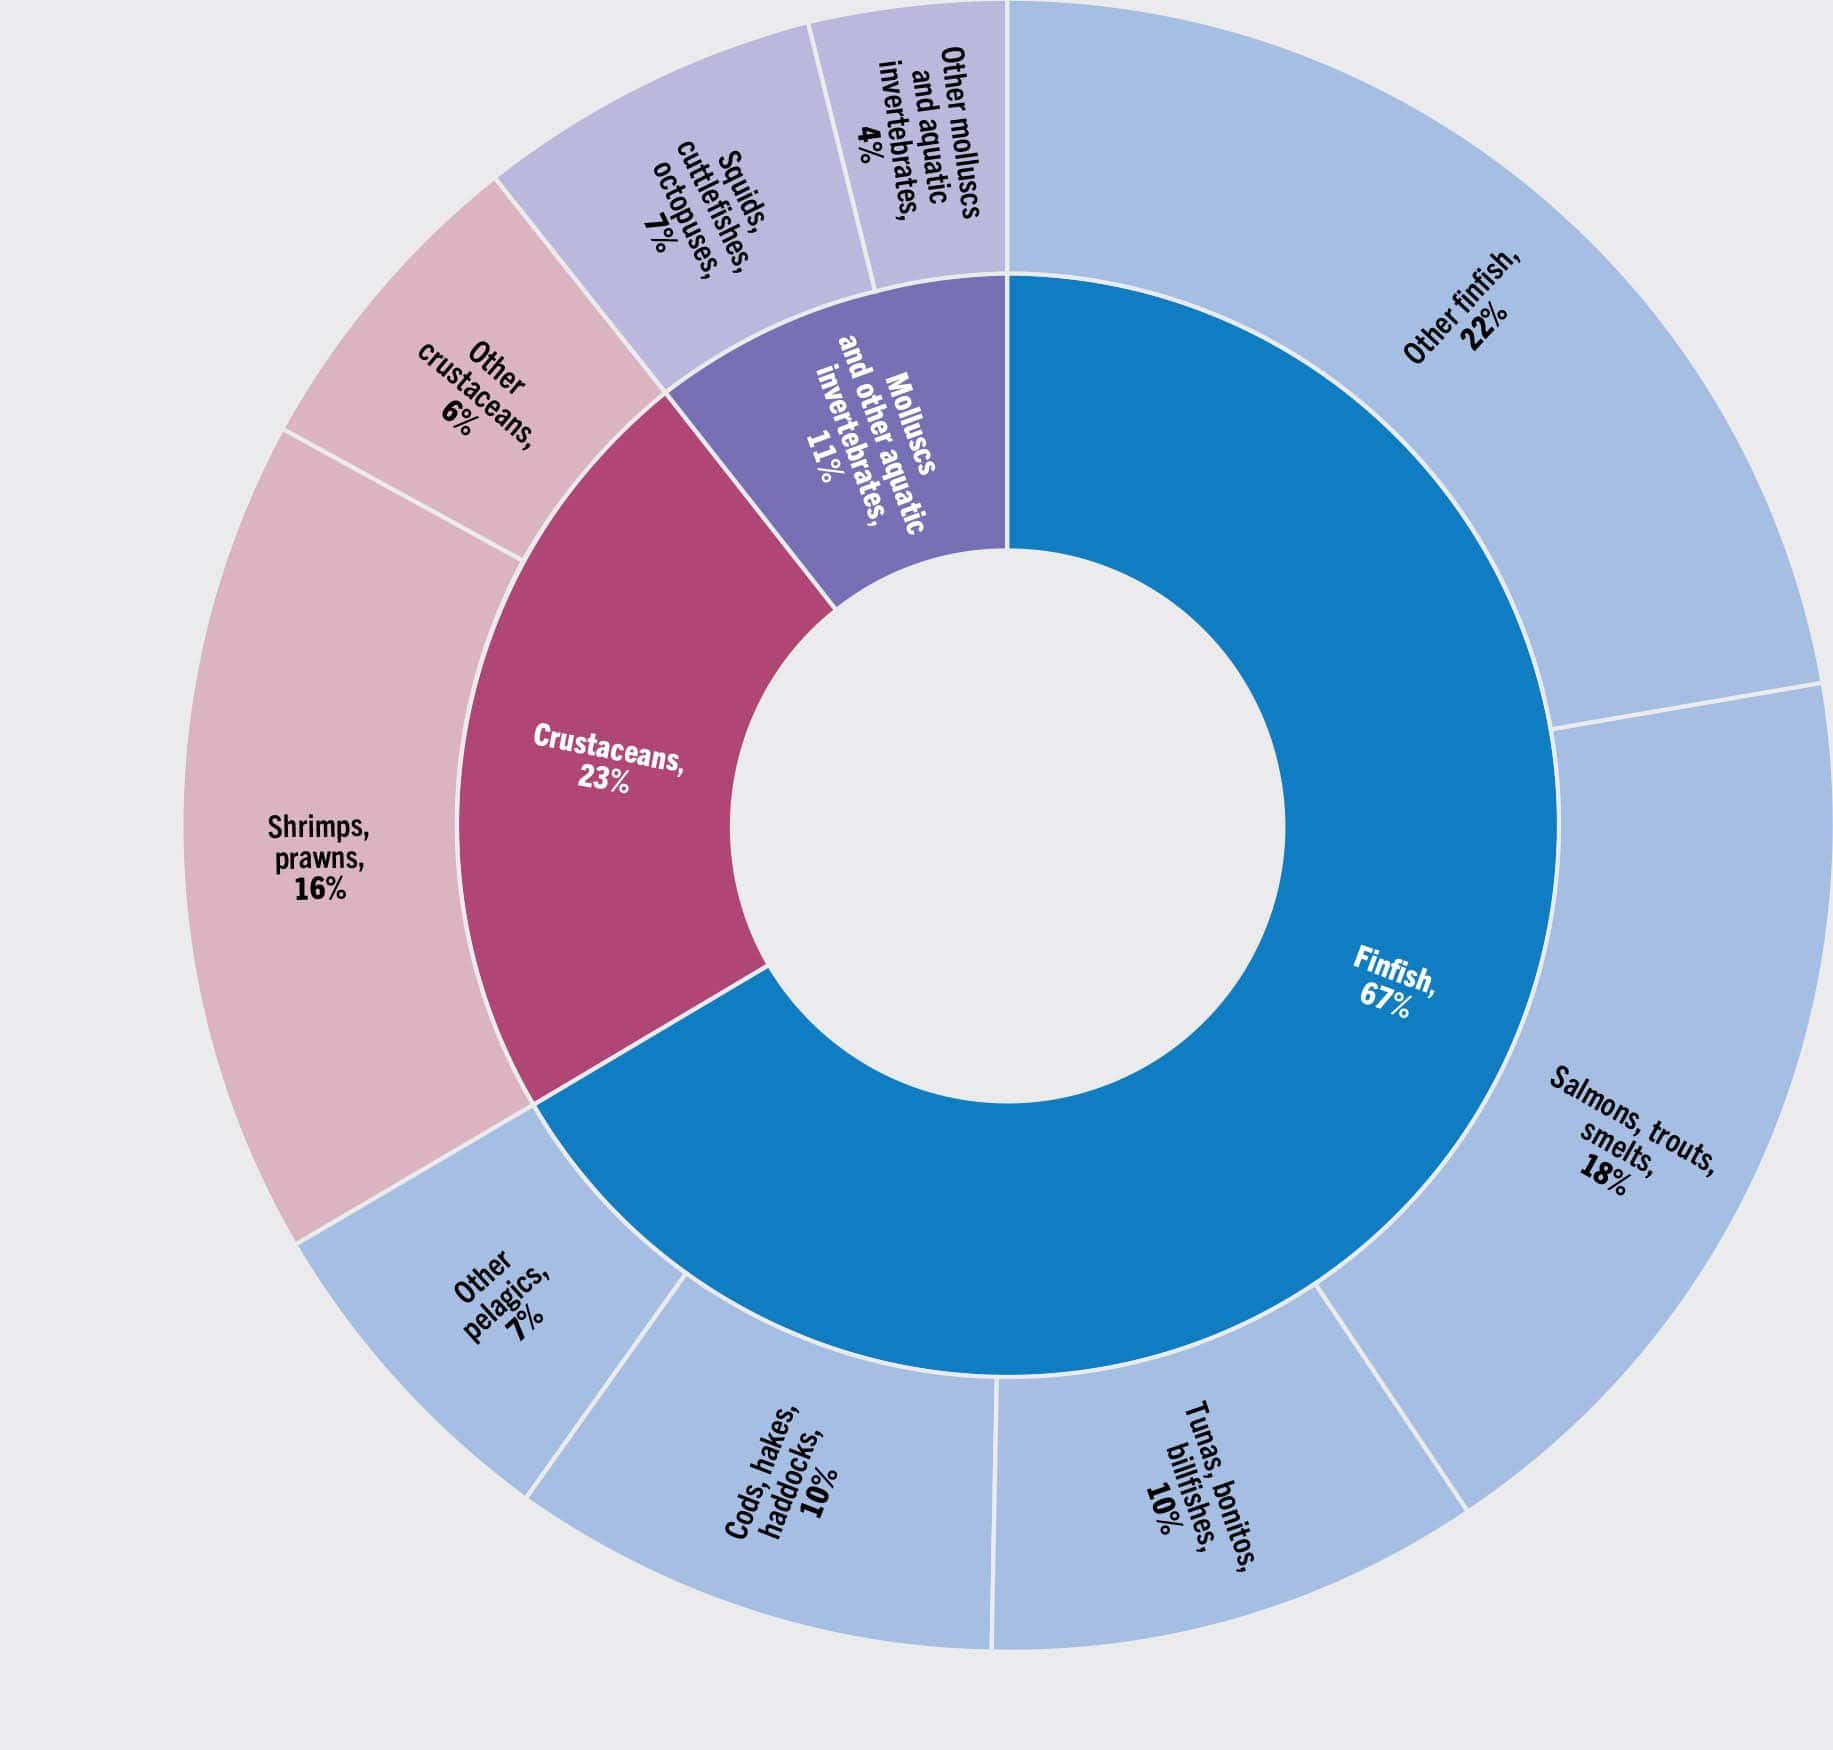
Figure 55 shows the total value of internationally traded aquatic products broken down by key groups of species in 2020. Finfish accounted for 66.5 percent of the global value of exports of aquatic products (excluding algae) in 2020, followed by crustaceans (22.8 percent) and molluscs and other aquatic invertebrates (10.7 percent). Salmonids have been the most important commodity traded in value since 2013, accounting for about 18 percent of the total value in 2020. In the same year, the other main groups of exported species were shrimps and prawn with about 16 percent of the total, followed by tunas, bonitos and billfishes (9.7 percent), cods, hakes and haddocks (9.6 percent), and squids, cuttlefishes and octopuses (6.8 percent). A brief analysis of recent trends by some of the key groups of species is reported below.
FIGURE 55SHARE OF MAIN GROUPS OF SPECIES IN EXPORTS OF AQUATIC PRODUCTS BY VALUE, 2020
SOURCE: FAO.
Salmon and trout
Salmon, and particularly farmed Atlantic salmon, has been one of the major contributors to growth in global trade of fisheries and aquaculture products in recent decades. As a versatile and high-value species suitable for large-scale aquaculture, salmon occupies a strong competitive position in the world market. Growth in demand for salmon has outstripped other fish categories in almost every region and Atlantic salmon aquaculture has risen to become one of the most profitable and technologically advanced industries. The sector has also led the way in funding, coordinating and executing large-scale international marketing campaigns, and has successfully established logistical infrastructure to supply fresh aquatic foods to foreign markets via airfreight routes. In 2020, exports of salmon were worth USD 27.6 billion, led by Norway and Chile. Salmon and trout exports accounted for 18.4 percent of the value of all exported aquatic products in 2020, compared with 5.1 percent in 1976. Norway’s primary market is the European Union, while Chile supplies Atlantic salmon to the United States of America and Brazil and farmed coho to Japan. Several wild Pacific species, caught by fleets of the Russian Federation and of the United States of America in the North Pacific, are also traded internationally. Salmon trade has been relatively resilient in the face of the challenges associated with the COVID-19 pandemic, despite an initial drop in prices and various logistical difficulties, reflecting the strength of underlying demand and the ability of the sector to adapt to changing conditions.
Shrimp
Shrimp and prawns have historically been some of the most heavily traded aquatic commodities. Currently produced primarily via intensive shrimp farming operations in Latin America and East and Southeast Asia, the majority of supply flows to consumers in high-income markets in North America, Europe and Japan. The markets of the United States of America and Japan are primarily supplied with warmwater species by major producers such as India, Indonesia, Thailand and Viet Nam. The European Union imports warmwater species from Asian and Latin American producers and sources coldwater species mainly from capture fisheries in Greenland. Today, emerging Asian economies such as China are absorbing an increasing proportion of global shrimp supply while the potential increase in per capita consumption in the mature traditional markets remains limited. Over time, shrimp and prawn exports have increased drastically but account for a relatively stable share of the total value of global exports of aquatic products. In 1976, exports of shrimps and prawns were worth USD 1.2 billion accounting for 15.4 percent of the value of global exports of aquatic products, whereas in 2020, they were worth USD 24.7 billion making up 16.4 percent of the total in value terms.
Groundfish and other whitefish
Whitefish covers a broad range of species, both wild-caught and farmed, such as cod, seabreams, groupers, Alaska pollock, tilapia, Nile perch and Pangas catfish (Pangasius spp.). These species are similar in taste and texture and, depending on the product, are substitutable for one another to a certain degree. The fleets of Norway, the European Union, Iceland, the Russian Federation and the United States of America account for most of the world’s wild-caught groundfish production. The European Union is by far the top import market for wild-caught groundfish, while China plays an important role in the world market as a processor of raw material and re-exporter. Exports of groundfish and other whitefish account for about 17 percent of the total value of exports of aquatic products, although there are significant quantities of groundfish and other whitefish not explicitly identified as such in trade statistics and recorded under miscellaneous species. China has built up a large tilapia farming industry in its southern provinces and is now the largest exporter of tilapia. In parallel, alternative suppliers in Southeast Asia and Latin America have increased their exports to the United States of America, at the expense of China. While China remains the dominant tilapia supplier, the imposition of import tariffs by the United States of America on Chinese tilapia, combined with logistical challenges related to the COVID-19 pandemic and the repurposing of land in key production regions, means that this dominance is expected to continue to decline. Viet Nam accounts for the majority of global pangasius production and export. Historically, the most important pangasius export market has been the United States of America, but in recent years, China has risen to become Viet Nam’s top export market.
Tuna
In 2020, global exports of tunas, bonitos and billfishes were worth USD 14.6 billion, the equivalent of 9.7 percent of the value of all exports of aquatic products. This proportion has remained relatively stable for many decades, as tuna’s popularity has endured. Tuna trade consists of two broad groups of commodities; the first comprises processed and preserved tuna, and the second high-quality fresh tuna for the sushi and sashimi market. Bluefin and bigeye tuna are typically used for sashimi and sushi, while skipjack, albacore and yellowfin are used as raw material for processed products. Thailand has established a large tuna processing industry, supplied by raw material landed directly by fishing fleets in Thai ports, and it plays a key role in the international tuna trade. The United States of America is the primary destination for Thai processed tuna exports. Smaller but significant industries also exist elsewhere in Asia, Africa and Latin America, with Ecuador supplying the European Union market with large quantities of processed tuna and raw material for European processors. Tariff regimes and the implications of duty-free import quotas enforced by major markets are important determinants of tuna trade flows in the processed product market and remain a central issue in trade negotiations. The sashimi and sushi market is dominated by Japan, which is supplied primarily by whole tuna and loins from the fleets of Taiwan Province of China and of the Republic of Korea, and by re-exports from Thailand.
Cephalopods
Cephalopods are a class of molluscs that includes octopus, squid and cuttlefish. Cephalopods are almost entirely wild-caught, with the bulk of supply coming from China, India, Morocco and Peru. The most important import markets for cephalopods are China, the European Union, particularly Italy and Spain, Japan and the Republic of Korea. Octopus is a popular restaurant menu item and this popularity has increased in recent times in line with increased demand for Hawaiian poke and Spanish-style tapas cuisine. Squid and cuttlefish are also used as ingredients in these dishes and are sold in large quantities at retail, typically in preserved and processed form. In 2020, exports of cephalopods amounted to USD 10.2 billion, the equivalent of 6.8 percent of the total value of exports of aquatic products. Cephalopods’ share of global trade has been increasing over time, but supplies are at risk due to poor management. This has led to steep price increases in recent years.
Bivalves
The most important bivalve mollusc species for international trade are scallops, clams, oysters and mussels. Today, the vast majority of the bivalve molluscs consumed are farmed, produced in a number of European countries, North America, China and Chile. The European Union, the United States of America, China and the Republic of Korea account for the bulk of import demand. Demand for bivalves has remained relatively steady over time, and the species have benefited from a positive perception among consumers as a healthy and sustainable food option. In 2020, global exports of bivalve molluscs totalled USD 4.3 billion, representing around 2.8 percent of the value of global exports of aquatic products.
Small pelagics and fishmeal and fish oil
Small pelagic species such as mackerel, herring, sardine and anchovy make up a significant proportion of the world’s capture fisheries production. The European Union, China, Morocco, Norway, the United Kingdom of Great Britain and Northern Ireland, the Russian Federation and Japan all report substantial catch volumes and exports. Despite a low unit value, these species accounted for 6.7 percent of the total value in 2020. Small pelagic stocks may straddle multiple exclusive economic zones, and productivity in a specific region tends to be heavily dependent on climatic conditions, translating into high supply and price volatility. The most important markets are geographically dispersed and include China, Egypt, the European Union, Japan, Nigeria and the United States of America. Small pelagics are also used for fishmeal and fish oil production for export. Anchovies, particularly Peruvian anchoveta, are typically used as raw material for these products. Most demand for fishmeal comes from major aquaculture producers such as China.
Other products
The above-mentioned value of USD 151 billion for exports of aquatic products in 2020 does not include an additional USD 1.9 billion made from seaweeds and other algae (58 percent), inedible fish by-products (33 percent), and sponges and corals (9 percent). Trade in algae increased from USD 65 million in 1976 to USD 1.1 billion in 2020, with China, Indonesia and the Republic of Korea the major exporters, and China, Japan and the United States of America the leading importers. Owing to the increasing production of fishmeal and other products derived from processing by-products of aquatic animals (see the section Utilization and processing of fisheries and aquaculture production), trade in inedible by-products has also surged, up from USD 8 million in 1976 to USD 715 million in 2020.

