
CONSUMPTION OF AQUATIC FOODS20
All aquatic food consumption statistics reported in this section are derived from FAO Food Balance Sheets (FBS) covering data from 1961. The FBS is a statistical framework, which estimates food available for human consumption (apparent consumption20) and not the actual quantity of food consumed (effective consumption).
Trends in aquatic food consumption21
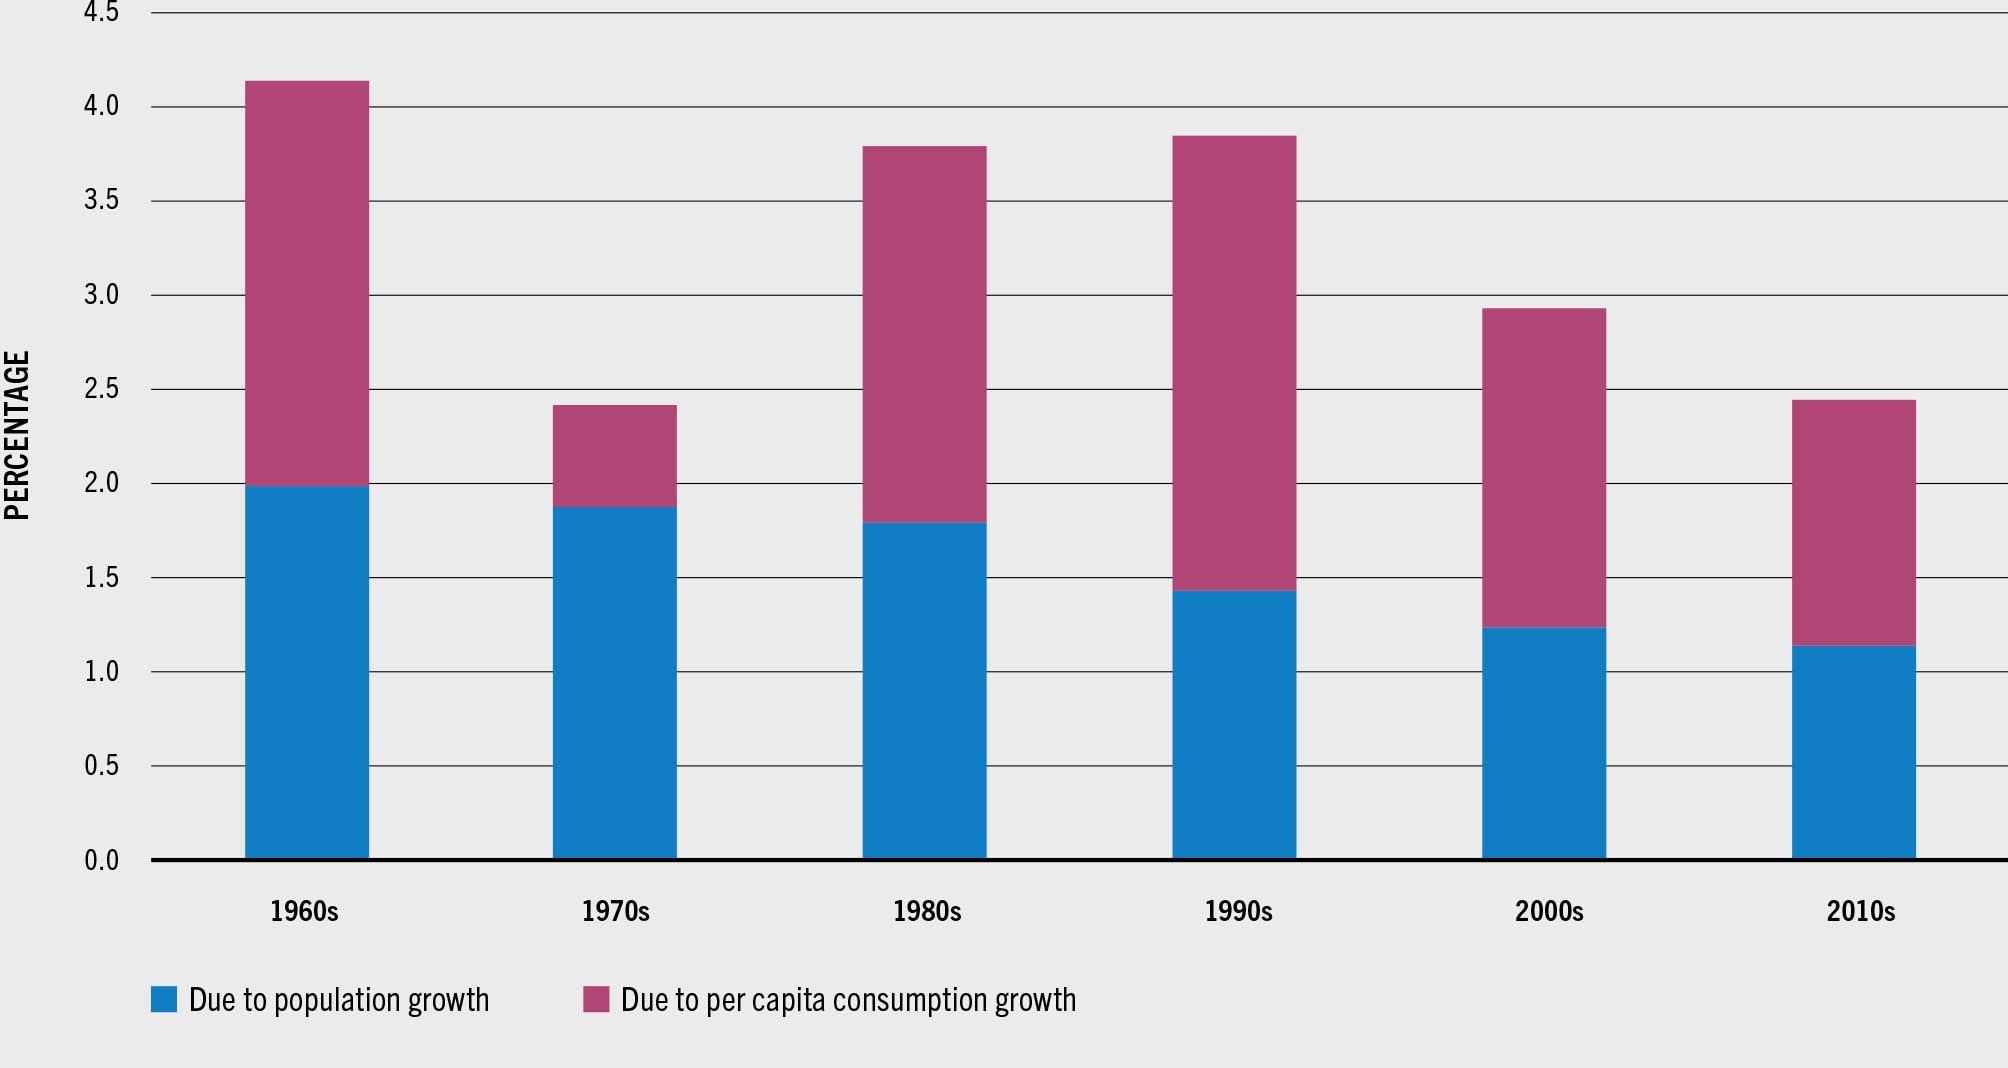
Global consumption22 of aquatic foods, excluding algae,20 has increased significantly, with the world now consuming more than five times the quantity consumed nearly 60 years ago. In 2019, global aquatic food consumption was estimated at 158 million tonnes, up from 28 million tonnes in 1961.23 Consumption increased at an average annual rate of 3.0 percent from 1961, compared with a population growth rate of 1.6 percent (Figure 38). Per capita consumption was influenced most strongly by increased supplies, changing consumer preferences, advancements in technology and income growth.
FIGURE 38AVERAGE ANNUAL GROWTH IN AQUATIC FOOD CONSUMPTION
Of the 158 million tonnes of aquatic foods available for human consumption in 2019, Asia accounted for 72 percent of the total while its population represented 60 percent of the world population (Figure 39). As a comparison, in 1961, Asia consumed 48 percent of all aquatic foods available for food consumption. In parallel, the proportion of aquatic foods consumed in Europe and the United States of America decreased over time. The respective shares of Europe and the United States of America went from 32 percent and 9 percent in 1961 to 10 percent and 5 percent in 2019. The growing importance of Asian countries as consumers of aquatic products20 is the result of a combination of factors. First, Asia became the main producer of aquatic products in 1993, mainly thanks to the development of aquaculture production. Second, the continent experienced significant economic growth in recent decades, which resulted in income growth, a larger middle class and the migration of rural populations to the cities where aquatic foods are more accessible. Finally, higher imports and a diversion of some exports towards the Chinese domestic market increased the diversity of aquatic foods available to Chinese consumers, further boosting their consumption.
FIGURE 39AQUATIC FOOD CONSUMPTION BY CONTINENT, 1961–2019
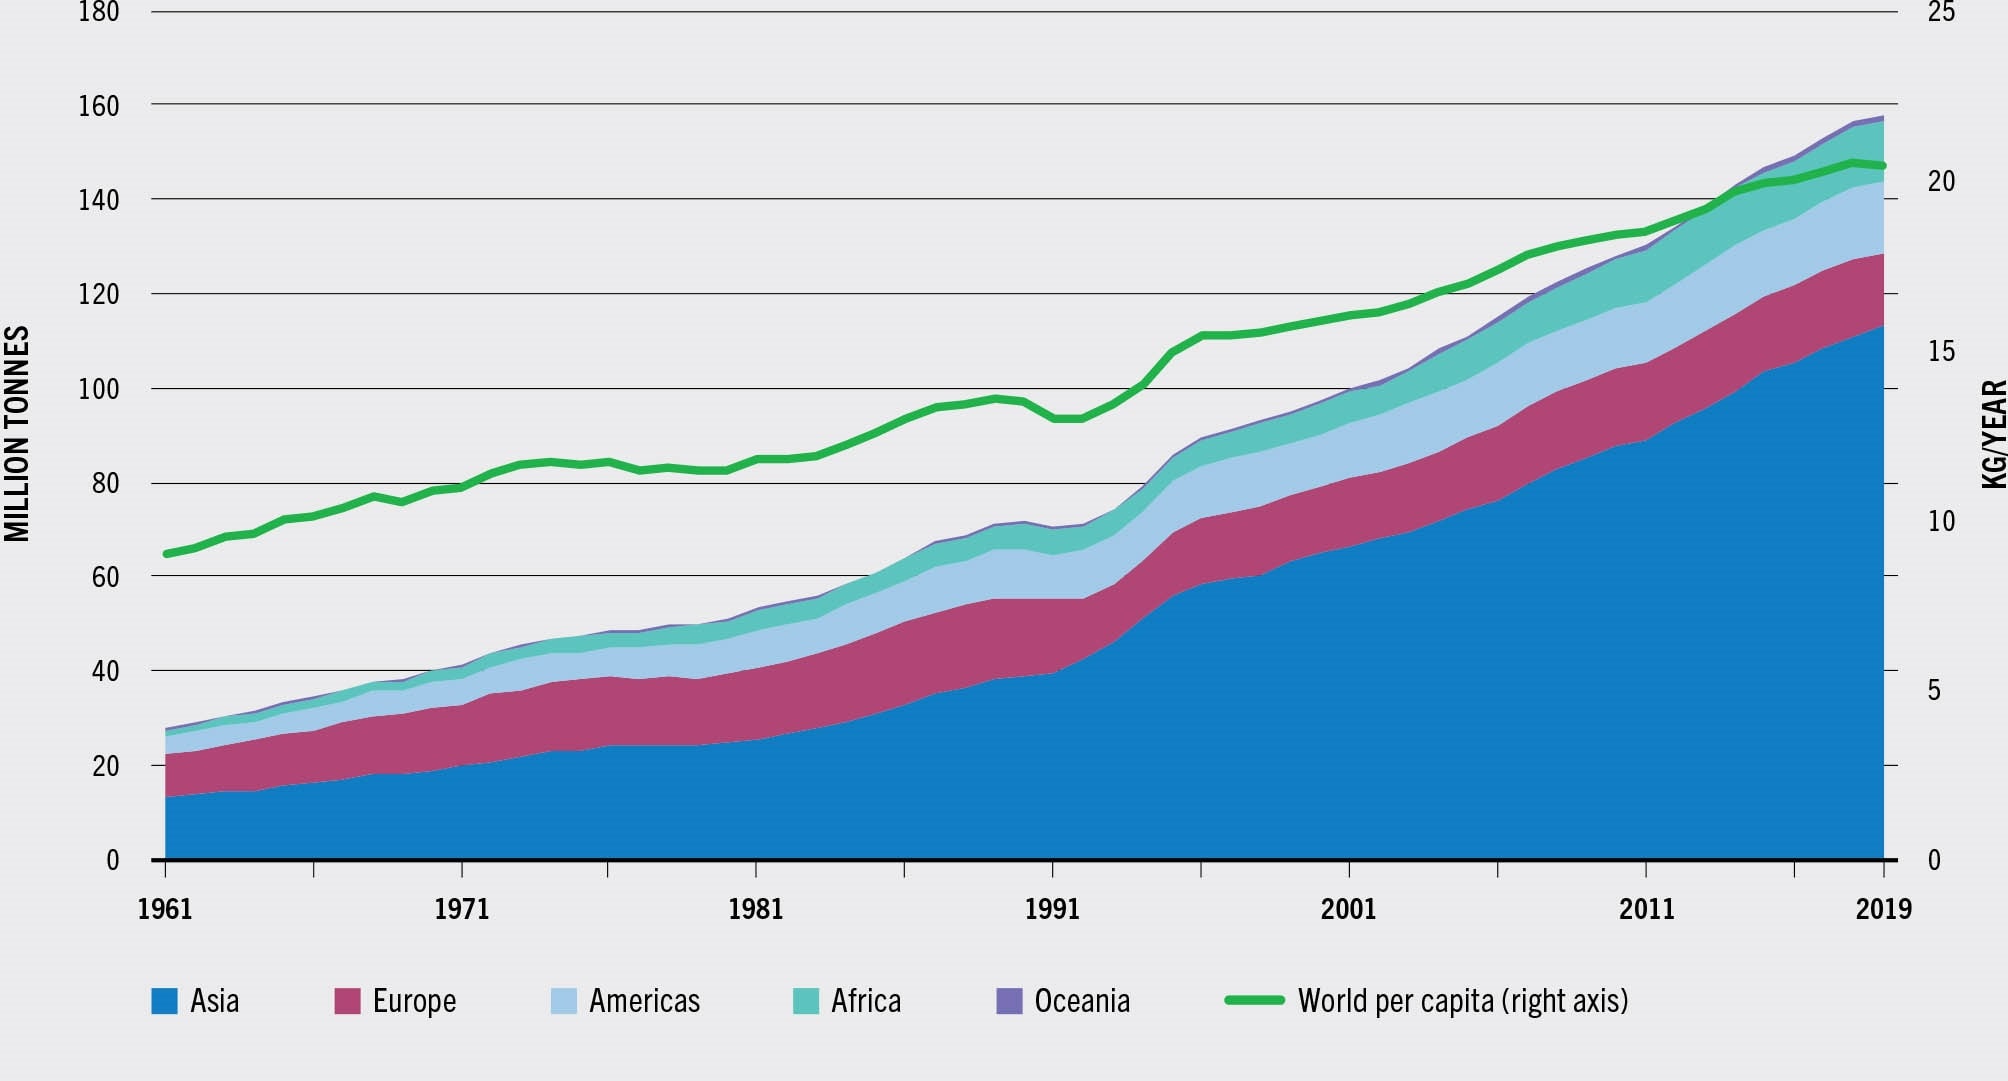
SOURCE: FAO.
Over the years, half or more of the aquatic food produced has been consumed by only a small number of countries. In 1961, the five largest consuming countries of aquatic foods (Japan, the former Union of Soviet Socialist Republics, China, the United States of America and the United Kingdom of Great Britain and Northern Ireland) accounted for half of global consumption. However, in 2019, the share of the five largest consuming countries (China, Indonesia, India, the United States of America and Japan) rose to 59 percent. This concentration reflects the emergence of major players such as China, which on its own, consumed 36 percent of all aquatic foods available for food consumption in 2019.
Per capita consumption of aquatic foods
Global annual per capita consumption of aquatic foods grew from an average of 9.9 kg in the 1960s to 11.4 kg in the 1970s, 12.5 kg in the 1980s, 14.4 kg in the 1990s, 17.0 kg in the 2000s and 19.6 kg in the 2010s, with a record high of 20.5 kg in 2019. Preliminary estimates point to a lower consumption (20.2 kg) in 2020 due to a contraction of demand, followed by a slight increase in 2021.
Despite a few exceptions, of which the most notable is Japan, most countries saw a rise in their aquatic food consumption per capita during the period 1961–2019. However, the rate of change across countries was highly variable with upper-middle-income countries experiencing the strongest annual growth (3.2 percent). Among these, China was the main driver for growth also due to its major expansion in fisheries and aquaculture production24 and increase in population. In 2019, China’s population accounted for 56 percent of the total population of all upper-middle-income countries. In China, per capita consumption grew from 4.2 kg in 1961 to 40.1 kg in 2019. Lower-middle-income countries experienced slower annual growth (1.9 percent), but this was still higher than high-income countries (0.5 percent). The moderate growth observed in high-income countries mainly reflects already high levels of consumption of aquatic foods. Low-income countries experienced a negative growth, decreasing by 0.2 percent per year over the period 1961–2019.
In addition to a high variability in the growth rates, huge differences exist in aquatic food consumption per capita among countries. The quantities consumed vary between countries, reflecting the different levels of availability of both aquatic and other foods (including proximity and access to aquaculture facilities, fish landings and markets), as well as differences in price, income level, nutrition consciousness, food traditions and consumer preferences. It is important to note that differences also exist within countries, with higher consumption levels generally occurring in coastal areas. In 2019, of the 227 countries for which FAO estimated the per capita consumption of aquatic foods, 133 countries were below the world average and 94 countries above. In terms of population, those countries consuming less than the world average accounted for 54 percent of the world population in 2019. The countries where consumption is highest include Iceland, the Faroe Islands and Maldives, which consume over 80 kg of aquatic foods per capita per year (Figure 40). This is in stark contrast to countries consuming under 1 kg per capita per year, such as Afghanistan, Tajikistan and Ethiopia. In 2019, the world average per capita consumption was 20.5 kg. This varied from an average of 5.4 kg in low-income countries, to 15.2 kg in lower-middle-income countries, 28.1 kg in upper-middle-income countries and 26.5 kg in high-income countries (Table 14). However, if China is not included, the average consumption of upper-middle-income countries drops to 13.0 kg per capita.
FIGURE 40APPARENT AQUATIC FOOD CONSUMPTION PER CAPITA, AVERAGE 2017–2019
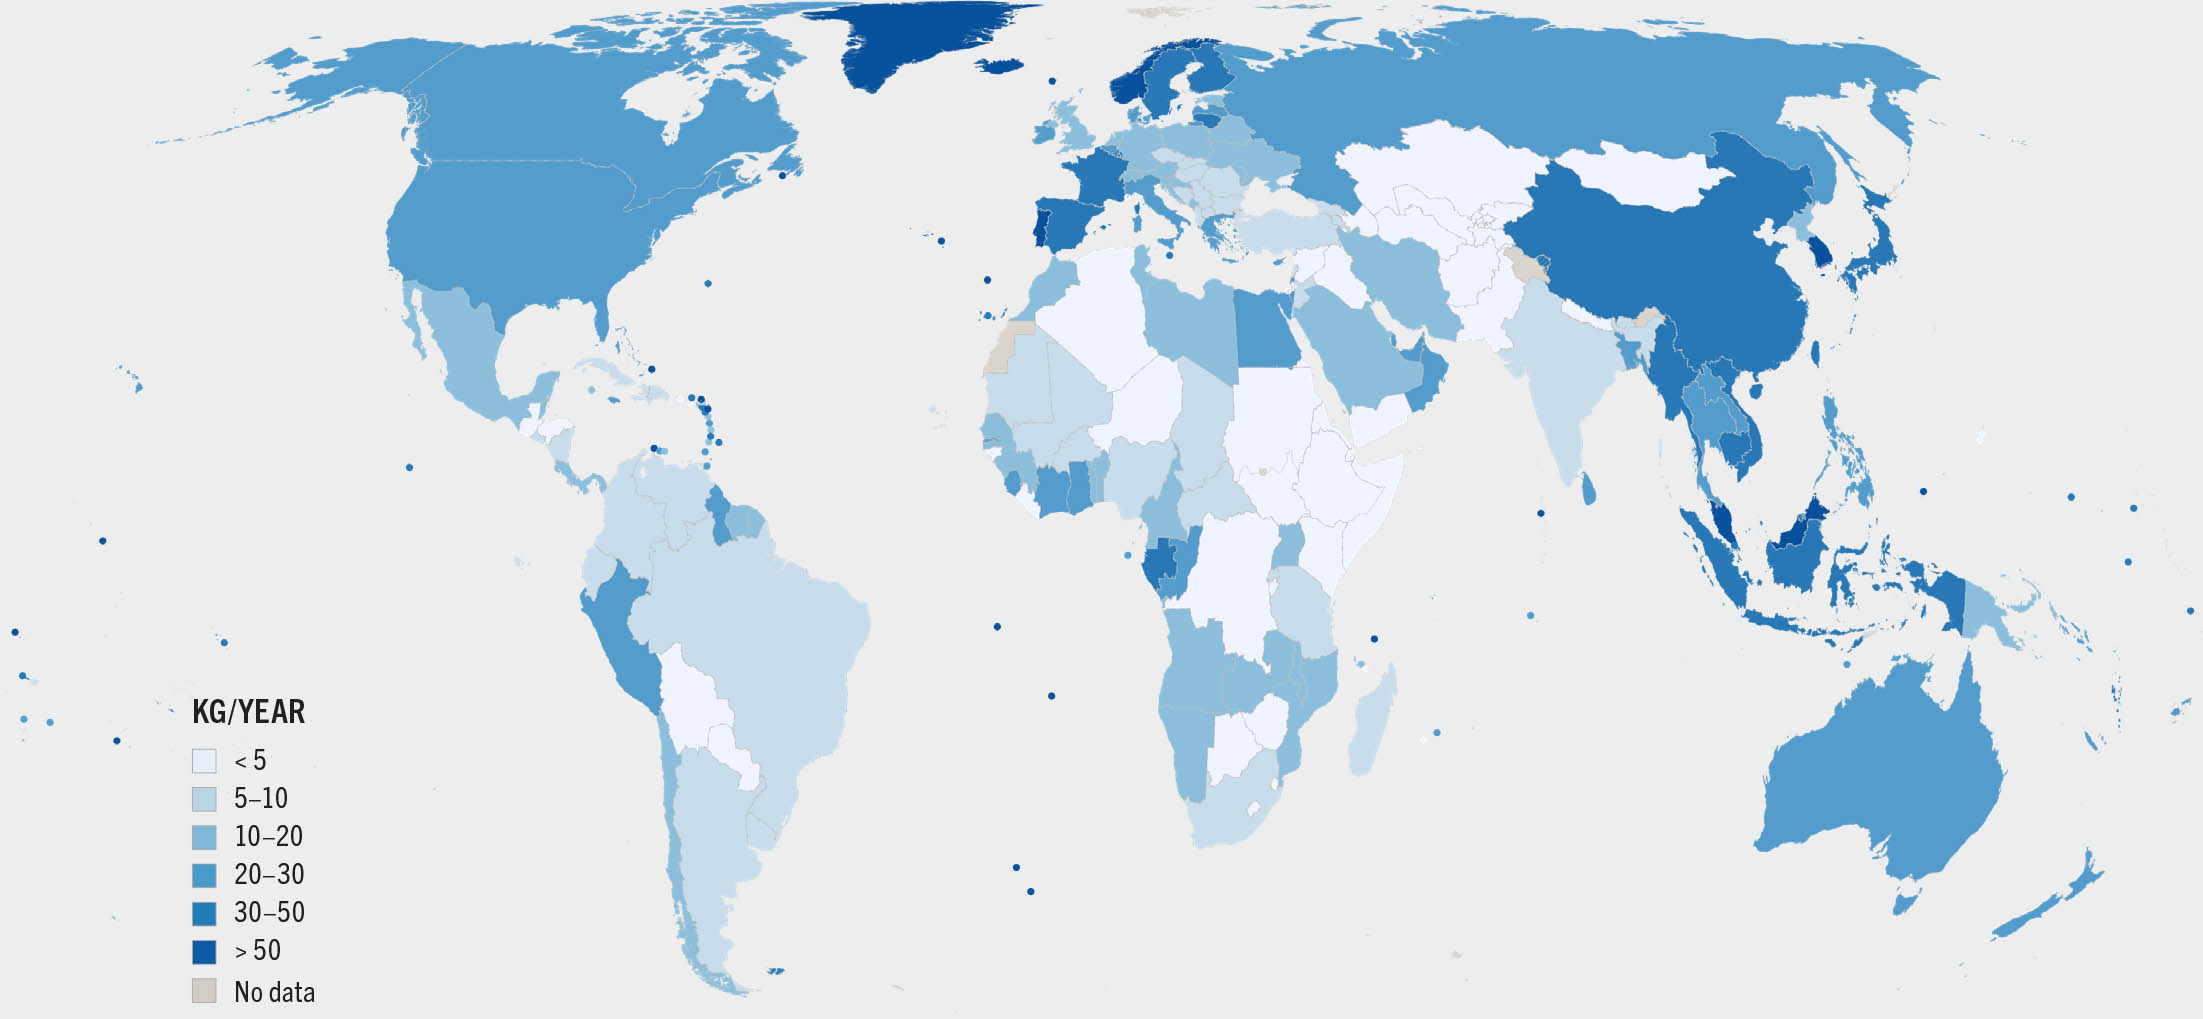
SOURCE: FAO.
TABLE 14TOTAL AND PER CAPITA APPARENT CONSUMPTION OF AQUATIC FOODS BY REGION AND ECONOMIC CLASS, 2019
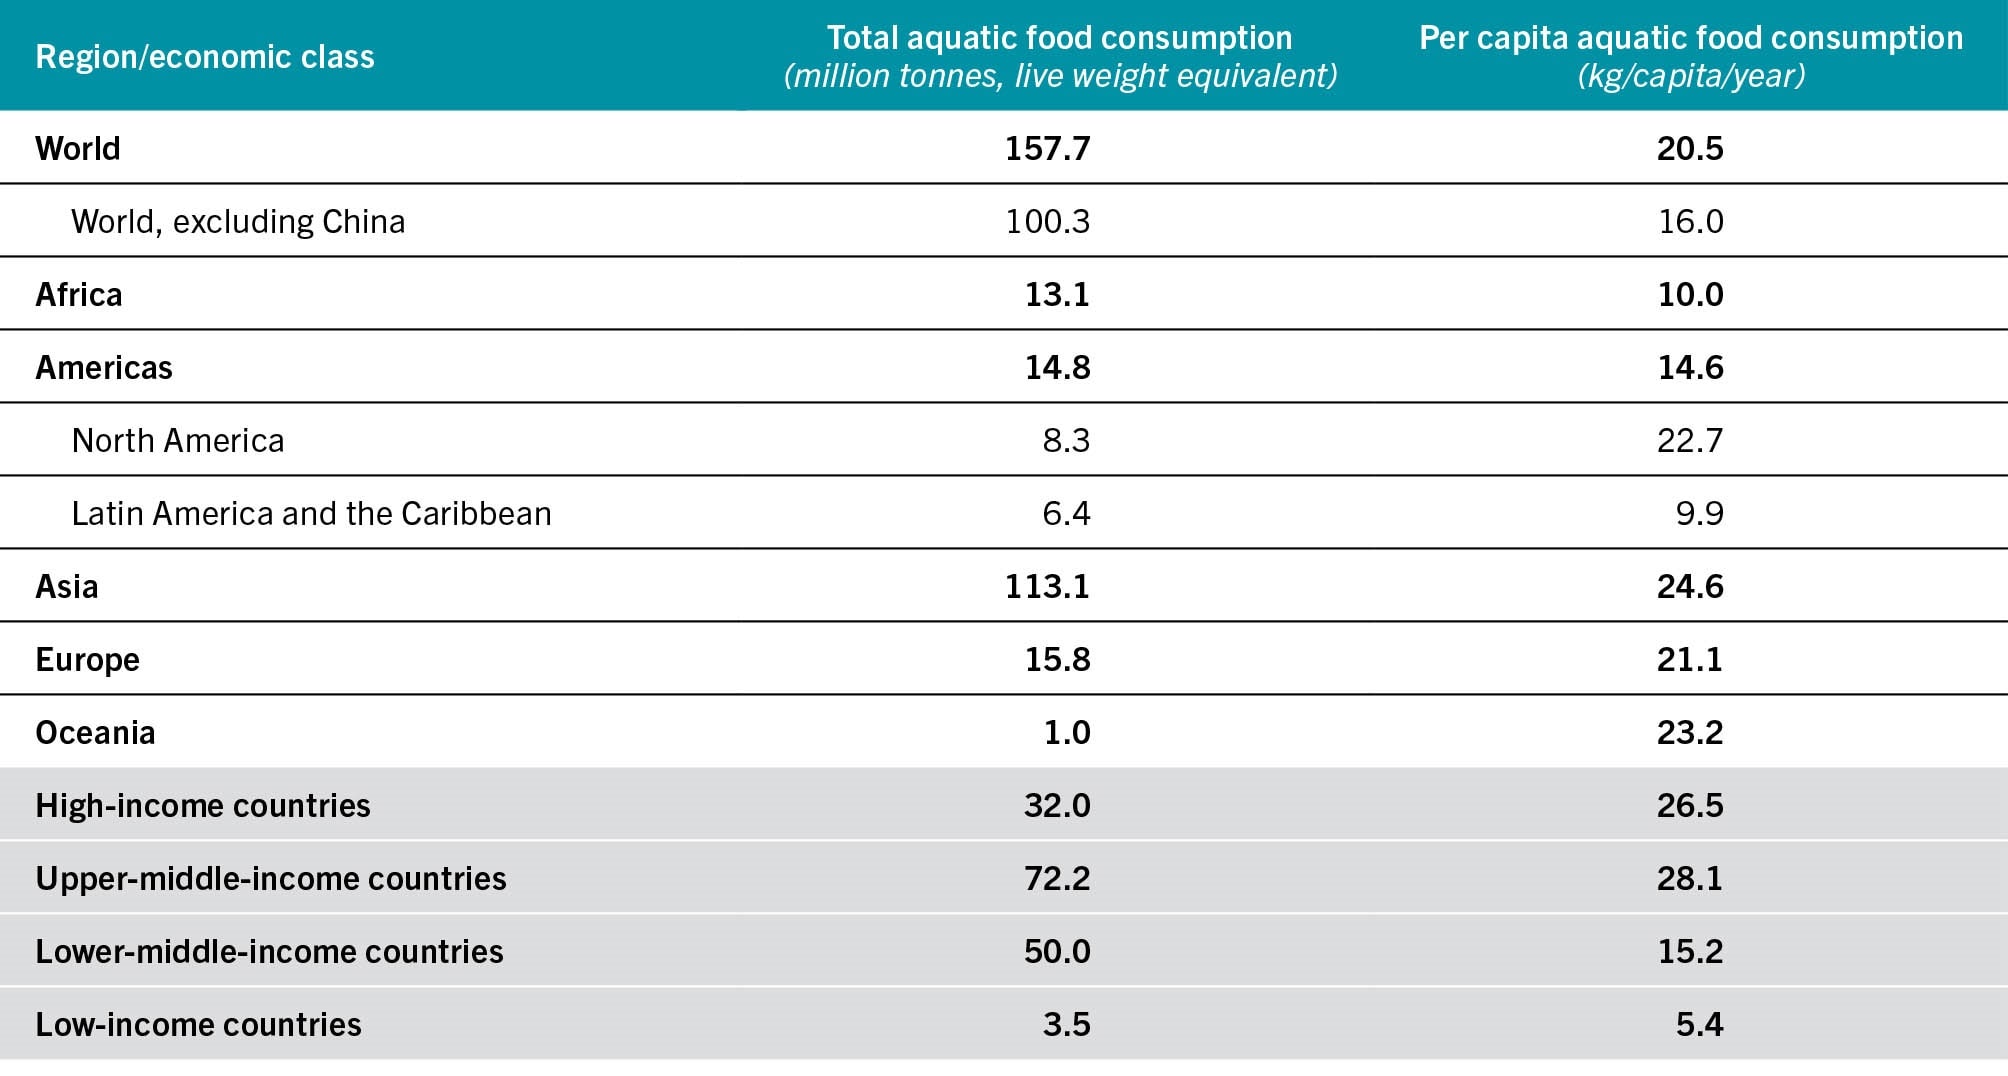
SOURCE: FAO.
Striking differences also exist by continent. Asia had the highest consumption of aquatic foods in 2019, with 24.5 kg per capita. Oceania followed with 23.1 kg, then Europe (21.4 kg), the Americas (14.5 kg) and Africa (10.1 kg). However, it should be stressed that actual values may be higher than indicated by official statistics, in view of the under-recorded contribution of subsistence fisheries, small-scale fisheries and informal cross-border trade. This could be particularly relevant for Africa and some countries in Asia.
Aquatic food consumption habits vary across Africa. Despite a low average consumption of aquatic foods in Africa, eleven countries had a higher consumption than the world average. These include some small island developing States (SIDS) in addition to Gabon, Congo, the Gambia, Sierra Leone, Ghana, Egypt and Côte d’Ivoire. For the remaining African countries, the relatively low consumption of aquatic foods is for a variety of reasons. These include: high population growth, which in most cases outpaces the growth of capture fisheries production; the relatively small aquaculture sector, which reduces the potential for increasing production in the near future; poor landing, road and market infrastructures, which limit the movement of good quality aquatic products across borders within the continent; and high post-harvest losses due to underdeveloped cold chains. Moreover, as described in the section Fisheries and aquaculture projections, the situation is expected to worsen in Africa, with consumption per capita projected to decline in the next ten years. Were this to occur, it would represent a serious threat in terms of food security given the high prevalence of undernourishment in the region and the key role played by aquatic foods in terms of contribution to total intake of animal proteins across many African countries.
Nutritional and environmental benefits of aquatic food consumption
Aquatic foods are important for a healthy and balanced diet (Box 7). Even small quantities of aquatic foods can have a significant positive nutritional impact by providing essential nutrients that are scarce in plant-based diets. Aquatic foods provide high-quality proteins and essential amino acids, vitamins (particularly A, B and D), phosphorus, and minerals such as iron, calcium, zinc, iodine, magnesium, potassium and selenium, and are a primary dietary source of heart-healthy omega-3 fatty acids. Depending on the species, aquatic foods can provide varying levels of nutrients. The most significant difference is fat content: species such as sardines, salmon and tuna are considered fatty, while cod and catfish are lean. The two omega-3 fatty acids found in aquatic species are eicosapentaenoic acid (EPA) and docosahexaenoic acid (DHA). The human body does not produce omega-3 fatty acids so they must be sourced through food. Omega-3 fatty acids are found in every kind of aquatic food, but are especially high in fatty species. Regular consumption of aquatic food helps maintain a healthy heart by lowering blood pressure and reduces the risk of stroke, depression, Alzheimer’s disease, and other chronic conditions. Controlled trials and observational studies demonstrated that the omega-3 fatty acids in aquatic food are important for optimal development of a baby’s brain and nervous system, and that the children of women who consume lower amounts of aquatic food or omega-3s during pregnancy and breastfeeding have evidence of delayed brain development.
BOX 7KEY FINDINGS OF REPORT ON ROLE OF AQUATIC FOODS IN NUTRITION
Current food systems often fail to deliver affordable, nutritious foods in an equitable manner and the cost of a healthy diet remains unaffordable for many people. While food system discourses often centre on terrestrial foods, as they supply most of the food consumed globally,1 there is an increasing focus on aquatic foods for their unique role in providing essential fatty acids and micronutrients such as iron, zinc, calcium, iodine and vitamins A, B12 and D. Following calls for more environmentally sustainable diets,2 “moderate” consumption of fish and other aquatic foods1 was promoted as part of a sustainable healthy diet. At the same time, despite recognition of the importance of healthy diets that are environmentally, economically and socially sustainable, there is as yet no robust and well-defined narrative for “sustainable healthy diet”. The UN Nutrition Discussion Paper, The role of aquatic foods in sustainable healthy diets,3 aimed to partly fill the gap by presenting evidence to inform and steer policy, investments and research to leverage on the potential of aquatic foods in delivering sustainable healthy diets and supporting achievement of the Sustainable Development Goals (SDGs).
The paper highlighted that many studies have narrowly focused on a limited number of economically valuable finfish species, while the broader nutritional and cultural value of diverse aquatic foods is often not taken into account. Diverse aquatic foods – including animals, seaweed and microorganisms farmed in and harvested from water, as well as cell- and plant-based foods emerging from new food technologies – have an essential role in ensuring food and nutrition security, while providing livelihood benefits to people around the world. Aquatic foods hold the potential for a major contribution to global food security and nutrition, transitioning towards diets that are socially, economically and environmentally sustainable. Moderate consumption does not necessarily increase the negative environmental impacts of production, if supplied and consumed following the recommendations in the UN Nutrition paper. Aquatic foods can be part of the solution to building resilient food systems and healthy diets for all, given that they are available, accessible, affordable and acceptable. The UN Nutrition paper recommends to policymakers and other stakeholders to promote diversified consumption of aquatic foods through nutrition strategies and interventions, ensuring equitable and sustainable supply and production of aquatic foods, and democratizing knowledge, data and technologies to create meaningful knowledge and applicable innovations. Promoting changes in consumer behaviour and demand for more diverse and low-trophic aquatic foods will also play a role in putting aquatic foods on the table.
- 1 FAO. 2022. FAOSTAT: Food Balances (2010-). In: FAO. Rome. Cited 14 April 2022. www.fao.org/faostat/en/#data/FBS
- 2 Willett, W., Rockström, J., Loken, B., Springmann, M., Lang, T., Vermeulen, S., Garnett, T. et al. 2019. Food in the Anthropocene: The EAT–Lancet Commission on healthy diets from sustainable food systems. The Lancet, 393(10170): 447–492. www.thelancet.com/pdfs/journals/lancet/PIIS0140-6736(18)31788-4.pdf?utm_campaign=tleat19&utm_source=HubPage
- 3 UN Nutrition. 2021. The role of aquatic foods in sustainable healthy diets. Discussion Paper. www.unnutrition.org/wp-content/uploads/FINAL-UN-Nutrition-Aquatic-foods-Paper_EN_.pdf
Many non-high-income countries, including some SIDS, rely on subsistence fishing as a key source of food. Kiribati is a good example: the country is a SIDS yet has one of the highest levels of per capita consumption of aquatic foods worldwide. For these countries, proteins sourced from aquatic foods are essential in the diet, particularly when the total protein intake is low.
In addition, the share of proteins from aquatic foods in the diet of non-high-income countries tends to be greater than in the diet of high-income countries (Figure 41). This reflects the fact that aquatic foods often represent an affordable source of animal protein, cheaper and more accessible than other animal protein sources, highly preferred and part of culinary traditions. Figure 41 also illustrates the mismatch between the per capita levels of aquatic food consumption and their relative contribution to animal protein intake. In 2019, aquatic food consumption per capita was much lower in low-income countries than in high-income countries. However, aquatic foods contributed to a greater share of animal protein intake in low-income countries than in high-income countries.
FIGURE 41AQUATIC FOOD CONSUMPTION AND CONTRIBUTION TO ANIMAL PROTEIN INTAKE BY ECONOMIC CLASS, 2019
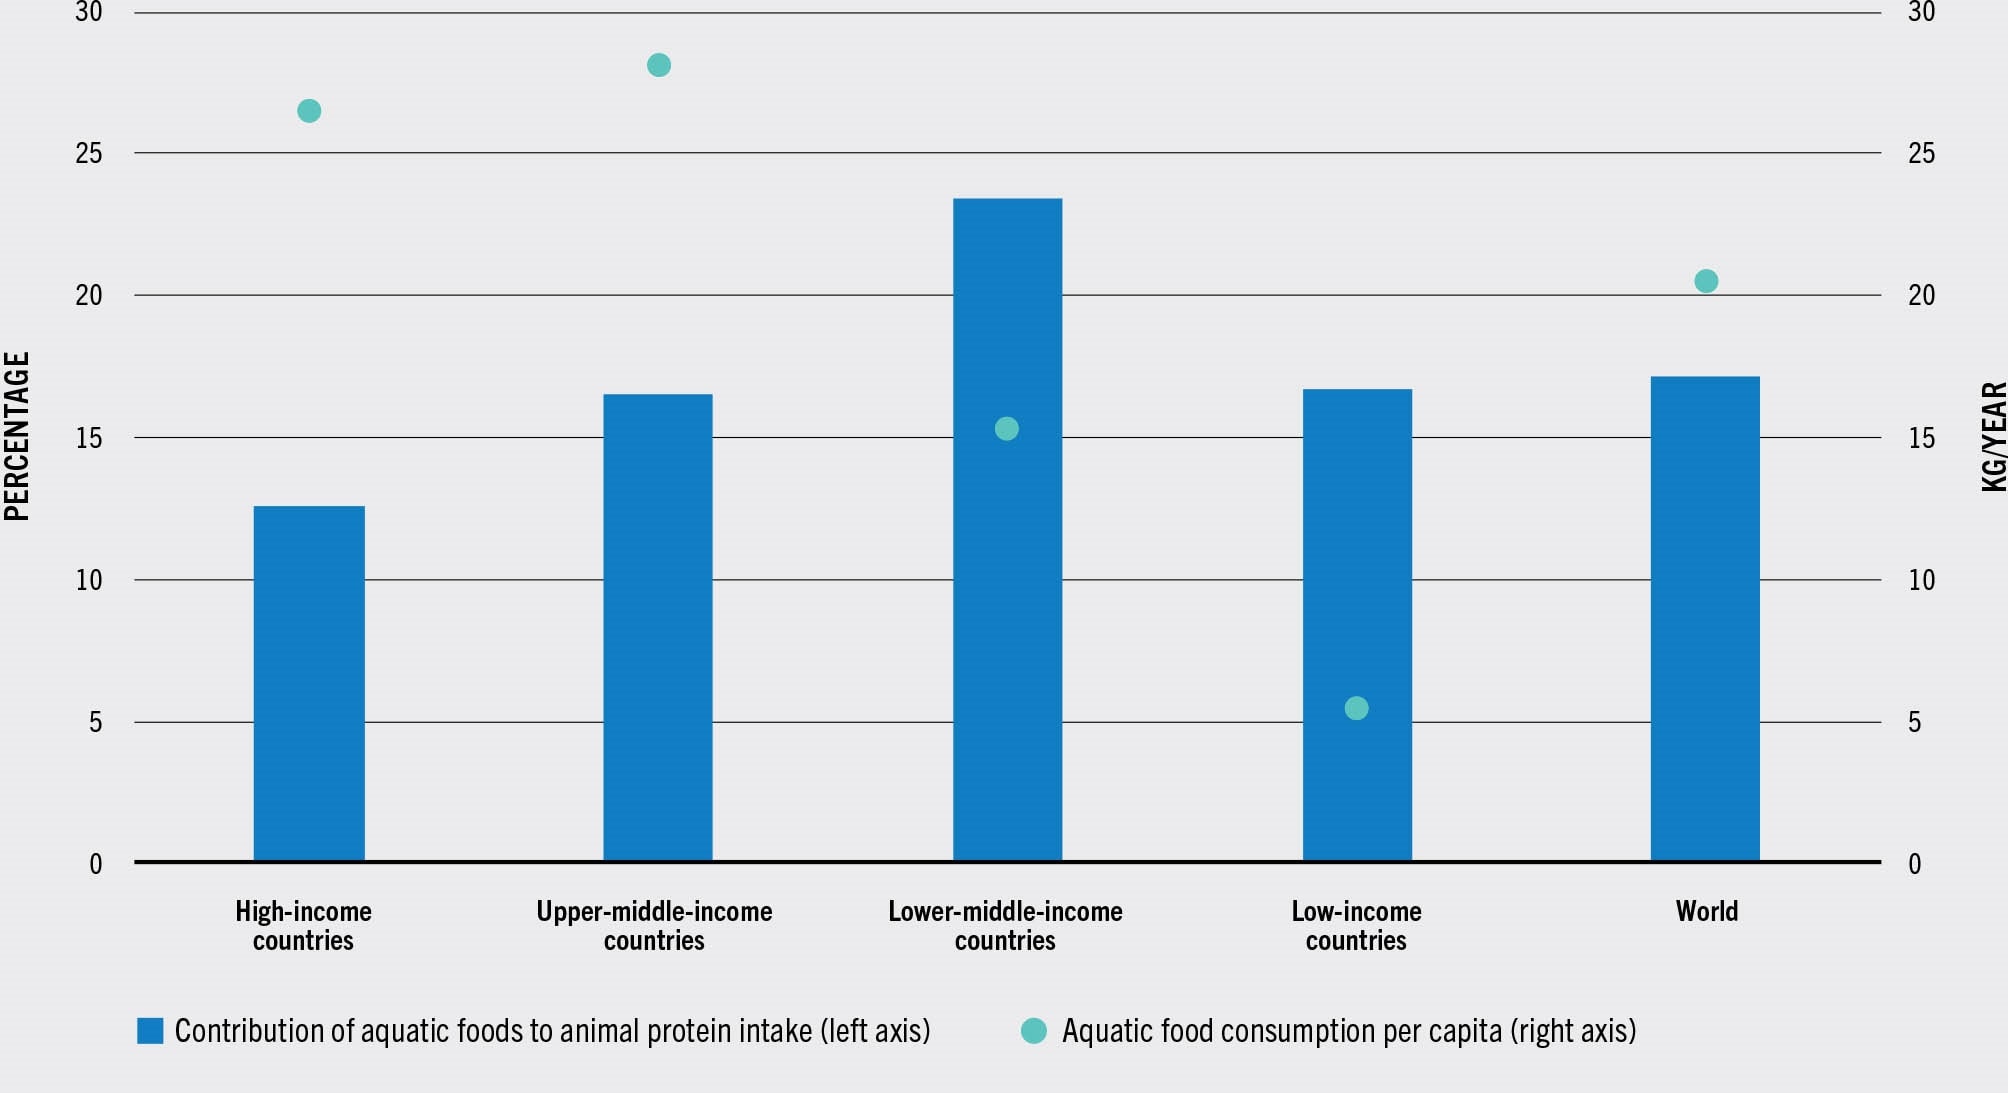
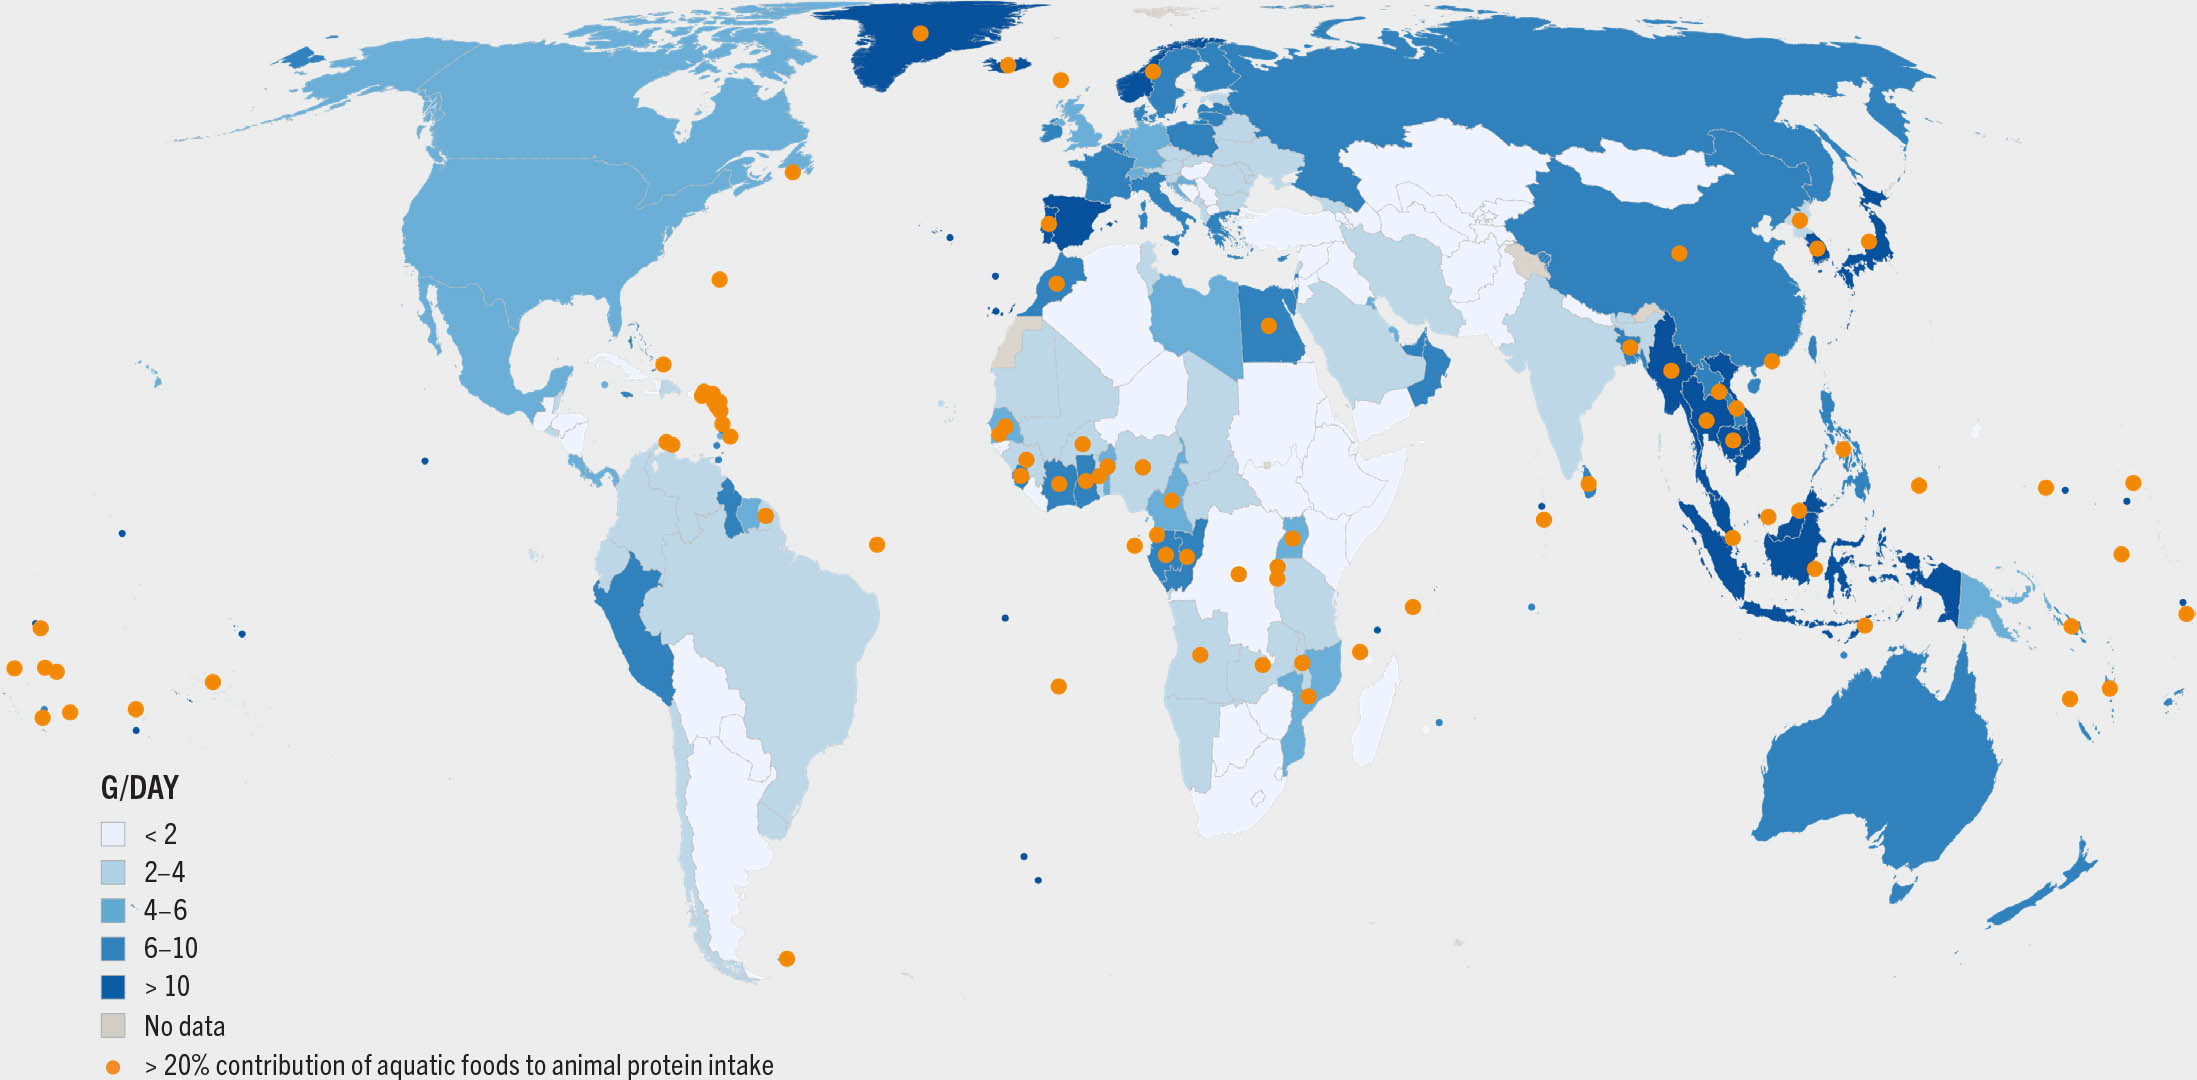
Globally, aquatic foods provided about 17 percent of animal proteins and 7 percent of all proteins in 2019 (Figure 42). In the same year in low-income countries, they provided 17 percent of animal proteins, in lower-middle-income countries 23 percent, in upper-middle-income countries 17 percent and in high-income countries 13 percent. Moreover, for 3.3 billion people, aquatic foods provided at least 20 percent of the average per capita intake of animal protein (Figure 43). In Cambodia, Sierra Leone, Bangladesh, Indonesia, Ghana, Mozambique and some SIDS, aquatic foods contributed 50 percent or more of total animal protein intake.
FIGURE 42CONTRIBUTION OF PLANT AND ANIMAL PROTEINS TO GLOBAL AVERAGE DAILY PROTEIN INTAKE, 2019
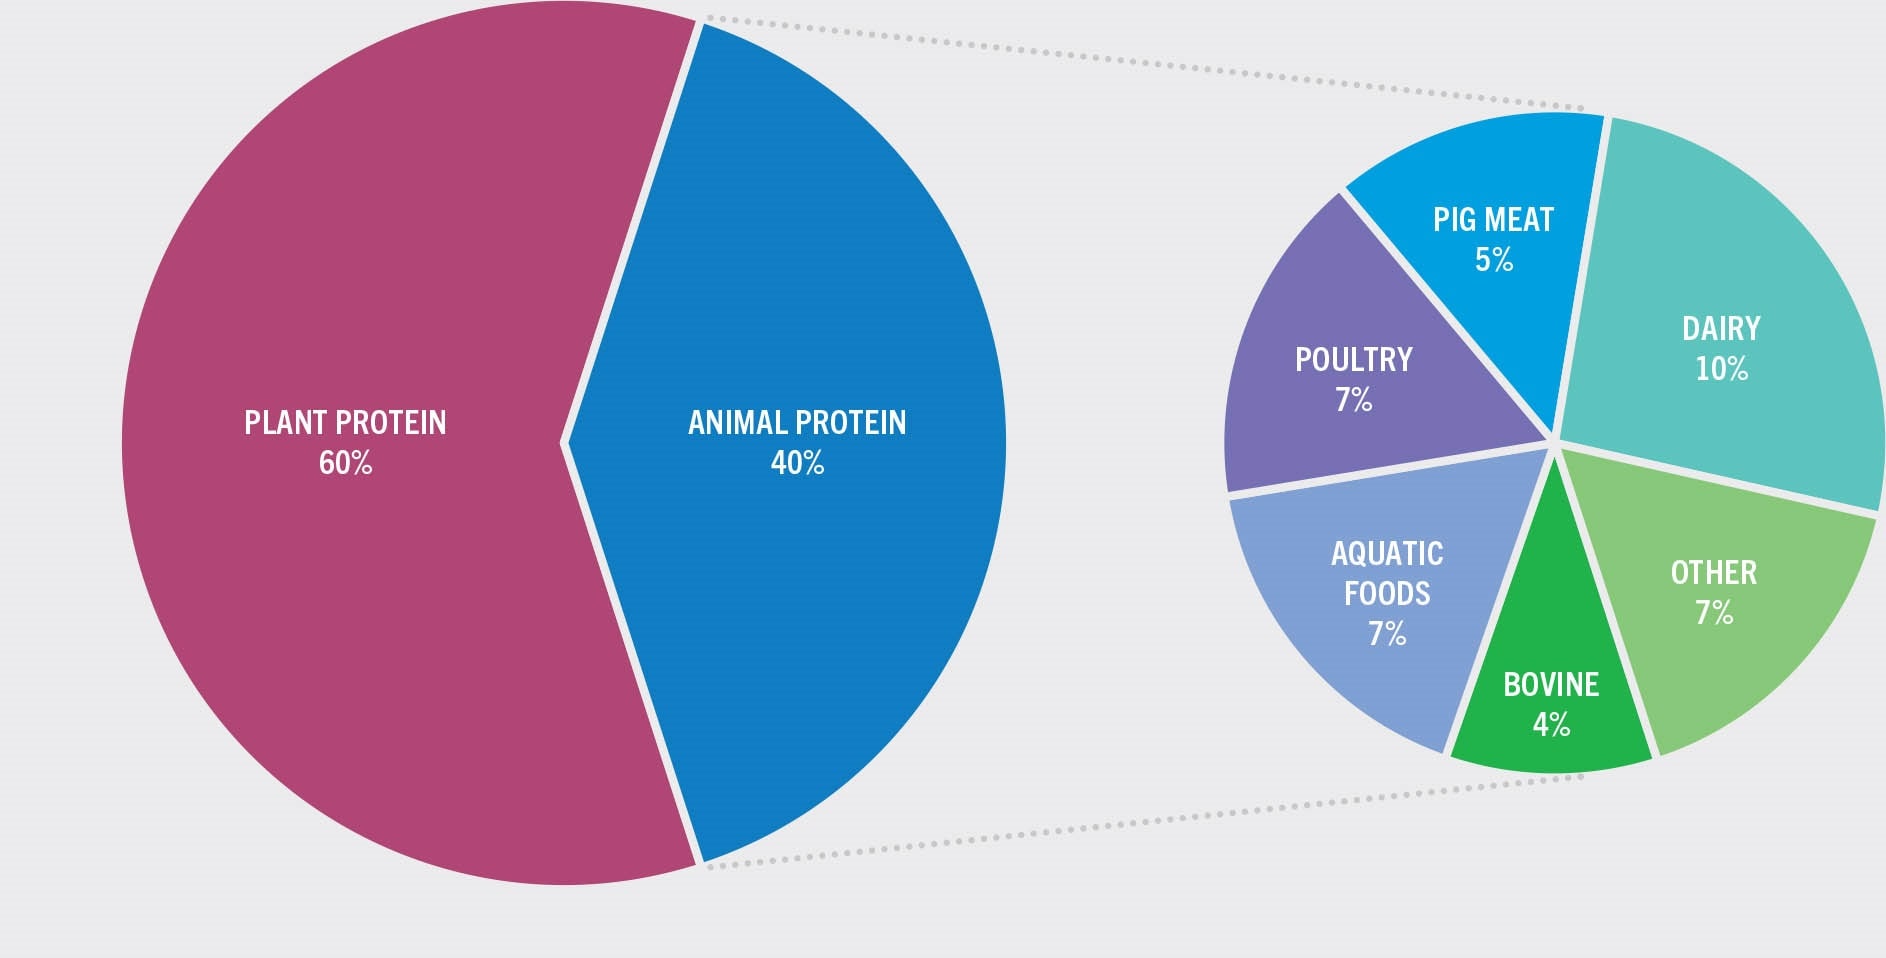
FIGURE 43CONTRIBUTION OF AQUATIC FOODS TO ANIMAL PROTEIN SUPPLY PER CAPITA, AVERAGE 2017–2019
SOURCE: FAO.
Trade and access to aquatic foods
As indicated above, geography plays a major role in explaining the differences in the levels of consumption of aquatic foods across countries. However, international trade contributed to reduce the impact of geographical location and limited domestic production, by allowing many countries to access larger quantities and wider diversity of aquatic foods that were not available domestically. Globally, the share of import volumes in total consumption of aquatic foods rose from 16 percent in 1961 to 32 percent in 2019. The reliance on imports is higher in richer countries where the supply chain infrastructures allow transportation of aquatic products in good condition and where consumers can afford species, particularly high-value ones, not locally produced. In the United States of America, for example, the share of imports in total consumption of aquatic foods rose from one-third in 1961 to nearly three-quarters in 2019. In contrast, in low-income countries, consumption of aquatic foods is mainly based on domestic production. For example, in Uganda, imports of aquatic products accounted for only 1 percent of total consumption of aquatic foods in 2019. The bulk of its supply is sourced from domestic production, mainly from freshwater sardines, perches and tilapias fished or farmed in Lake Victoria.
From wild to farmed
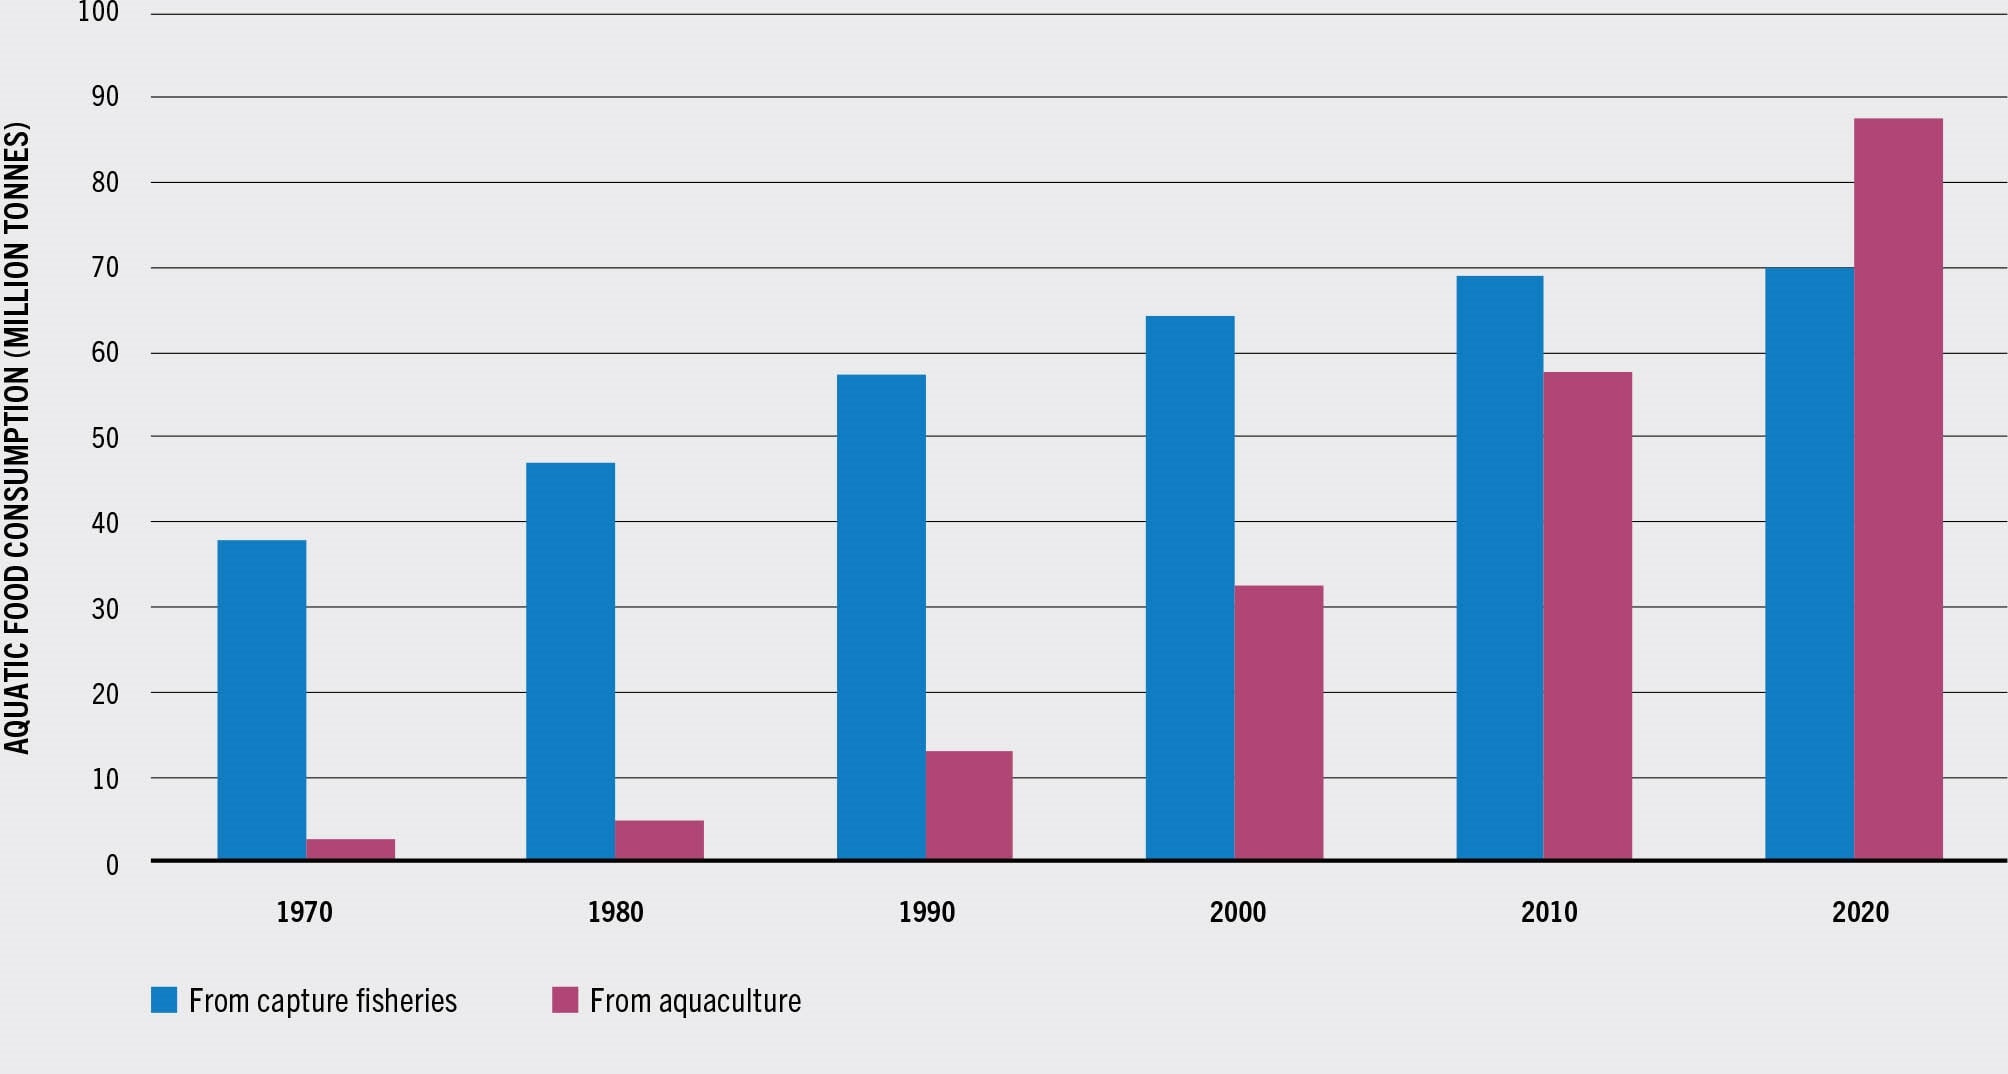
The increase in aquatic food consumption has been mainly made possible by a significant rise in aquaculture production, while capture fisheries production has been rather stagnant since the end of the 1990s. The proportion of aquatic foods originating from aquaculture production rose from 6 percent in the 1960s to 50 percent in the 2010s. Preliminary estimates for 2020 indicate that this share further increased to 56 percent (Figure 44). It is also important to mention that these figures do not refer to the quantity effectively eaten, but to the food available to be consumed. Furthermore, taking into account only the edible amount (i.e. excluding shells and other inedible parts – noting that "inedible" varies among cultures), it is likely that capture fisheries are still the main source of aquatic foods eaten. This is due to the predominance of aquaculture in the production of bivalves and crustaceans, which comprise a relatively large proportion of inedible parts. However, the gap is narrowing. Once again, strong differences exist across countries with a higher share of farmed species being consumed by Asian countries, the main producers. Moreover, projections foresee an increase in the importance of farmed aquatic animals in global aquatic food consumption in the future (see the section Fisheries and aquaculture projections). The significant rise in aquaculture production resulted in increased availability and a decline in prices, particularly for the species that became predominantly farmed rather than wild-caught. As a result, aquaculture contributed to increased food security in several developing countries, particularly in Asia, by making available for domestic consumption large volumes of some low-value freshwater species.
FIGURE 44RELATIVE CONTRIBUTIONS OF AQUACULTURE AND CAPTURE FISHERIES TO AQUATIC FOODS AVAILABLE FOR HUMAN CONSUMPTION
SOURCE: FAO.
However, the rise in aquaculture production has not been homogenous across all species, with some species being easier to farm than others. In addition, the aquaculture sector is able to adapt more rapidly and efficiently to changing consumer preferences, as aquaculture producers have greater control over their production than capture fisheries producers do. As a result, the species composition of global aquatic food consumption evolved significantly over time. The consumption of crustaceans used to be mainly concentrated in high-income countries due to their high price. However, thanks to a rise in the production of farmed shrimps and prawns and a fall in their price, the availability of crustaceans increased over fivefold, from 0.4 kg to 2.2 kg between 1961 and 2019. A similar trend was observed for molluscs (excluding cephalopods) whose consumption per capita rose from 0.6 kg in 1961 to 2.5 kg in 2019. Freshwater and diadromous fish saw the strongest growth in per capita consumption, increasing more than fivefold from 1.5 kg in 1961 to 8.2 kg in 2019. This reflected both the Asian appetite for some freshwater species and the strong demand for salmon and trout, particularly in Europe and North America, as well as tilapia in different countries. The demersal and pelagic fish groups did not show such strong variations, with their share in average world consumption stabilizing at about 2.7 kg and 3.0 kg per capita, respectively.
In 2019, of the 20.5 kg of per capita consumption, nearly 75 percent came from finfish and the remainder came from shellfish. Freshwater and diadromous species accounted for 40 percent of the aquatic food consumption per capita. Marine finfish species provided another 33 percent, of which 15 percent were pelagic species, 13 percent were demersal species and 5 percent were unidentified marine fish. The remainder of the per capita consumption was composed of shellfish, of which 12 percent were molluscs (excluding cephalopods), 11 percent crustaceans and 2 percent cephalopods.
Demand for healthy and convenience food
Significant societal changes have influenced consumers’ decisions, particularly in affluent economies. Healthy eating has become a dominant trend in food consumption in a context of rising numbers of overweight people and obesity-related diseases in many countries. As a result, demand for healthy and nutritious foods, such as aquatic foods, has increased in recent years. Furthermore, this has been accompanied by increasing attention of consumers and major distributors to the sustainability of aquatic food systems, in particular its environmental and social dimensions. As a result, producers and retailers rely on a range of certification schemes and labelling to meet consumer demand for sustainable aquatic food.
Besides healthy and sustainable aquatic products, consumers also want convenience, particularly in more advanced economies. Societal changes, including higher incomes, greater female participation in the workforce, urbanization, and decreasing family sizes, have increased the use of convenient food products. These products are pre-prepared and packaged commercially, requiring minimum preparation at home or by the food service industry, and are easy to order and deliver using online platforms. The widespread use of smartphones and mobile applications has made online ordering, home delivery, and click and collect more popular. Lockdowns and physical distancing requirements in the early stages of the COVID-19 pandemic gave a further boost to this trend. While exporters suffered from market and trade disruptions at the beginning of the pandemic, small and local suppliers of fisheries and aquaculture products thrived, highlighting the importance and resilience of local food systems.
Algae
Currently, seaweeds and other algae are not included in the FAO Food Balance Sheets for aquatic foods, reflecting the lack of available data collected on seaweeds and their uses in most countries. While seaweeds have for centuries formed part of the daily diet of some countries, particularly in East Asia, they are still underexplored as food in most countries. Seaweeds are considered a healthy, nutritive and low-calorie food. While the nutritional composition of seaweeds varies among species, seaweeds are generally low in fat and include a range of essential nutrients, such as omega-3 and omega-6 polyunsaturated fatty acids, vitamins (A, C, E and B12), iodine, dietary fibre and antioxidants. Besides being valuable from a nutritional point of view, seaweed consumption is associated with several health benefits, such as lowering blood pressure and preventing strokes (Fitzgerald et al., 2011). In a context of a growing world population and environmental challenges, seaweed is also one of the several sustainable opportunities that can contribute to global food security, either as food or as feed including for aquaculture (Cai et al). Seaweed can be farmed in seawater, thus not competing with arable land and freshwater.
- 20For algae, apparent consumption, aquatic foods and aquatic products, see Glossary, including Context of SOFIA 2022.
- 21Consumption data for 2019 should be considered preliminary. These values could differ slightly from those to be released in the FBS section of the FAO Yearbook of Fishery and Aquaculture Statistics 2020, and in the FishStatJ workspace to be disseminated in late 2022. For the updated data, access: www.fao.org/fishery/en/statistics
- 22All aquatic food consumption statistics reported in this section refer to apparent consumption.
- 23Aquatic food consumption data are expressed in live weight equivalent.
- 24For fisheries and aquaculture production, see Glossary, including Context of SOFIA 2022.

