


- ➔ There are approximately 570 million farms worldwide. While about 85 percent of these farms are smaller than 2 ha, they operate only 9 percent of agricultural land. Meanwhile, farms covering over 1 000 ha account for just 0.1 percent of the total number, yet operate half of all agricultural land.
- ➔ The distribution of farm sizes varies significantly across regions. In Africa and Asia, medium-sized farms cover about half of available agricultural land; in other regions, the majority of farmland is located on farms larger than 1 000 ha.
- ➔ Despite persistent constraints that limit their productivity, the almost 500 million smallholders worldwide are important contributors to global food supply, producing around 16 percent of dietary energy, 9 percent of fats and 12 percent of plant-based proteins.
- ➔ Large farms exceeding 50 ha have an outsized influence on global agricultural land and food provision, hence are uniquely positioned for driving solutions to land degradation.
- ➔ As agrifood trade increasingly connects distant regions, it is crucial that policies and organizations for sustainable agrifood systems consider the global impacts of land use across farms of all sizes, including medium- and large-scale operations that manage the majority of the world’s farmland.
Human-induced land degradation and the resulting yield losses are ongoing issues that undermine the ability to produce food sustainably. These challenges are intertwined with socioeconomic vulnerabilities and pressures on land to meet increasing demand for land-based products and ecosystem services. Understanding the challenges faced by those who manage agricultural land is therefore crucial to designing effective policy solutions that promote sustainable land use and ensure long-term food security.
Effective policies to sustainably increase agricultural production require a comprehensive knowledge of the people responsible for land management. This includes understanding who land managers are, the scale at which they operate, their contribution to global food production, and the obstacles they face in increasing productivity while managing land sustainably. Improving knowledge of these key areas will enable policymakers to better assist those responsible for the primary production stage of global agrifood systems.
Who is managing agricultural land? Farm size and land distribution
Understanding the distribution of agricultural land – including both croplands and permanent meadows and pastures – by size is essential to address land degradation and yield gaps, while promoting sustainable agricultural practices. Farms of varying scales often encounter unique challenges related to market constraints that affect land management and sustainability outcomes.
Smaller farms continue to face enduring barriers such as limited access to land, credit, inputs, technology, information and markets, often combined with poverty and food insecurity. These can compel survival-driven decisions that degrade land. When smallholders lack resources to invest in sustainable practices or struggle with the threat of food insecurity, they may resort to production practices such as continuous farming without restoring soil fertility (with organic or inorganic fertilizers), leading to nutrient mining.1 They may also apply fertilizers (when available) inefficiently, resulting in nitrogen pollution,2 or expand cultivation into ecologically fragile areas. In addition, smallholders may find it costly to participate in certification schemes that increase incomes and incentives for sustainable land use. As a consequence, many such schemes are dominated by large-scale producers.3
Despite managing most of the world’s farms, small-scale farmers and their households make up a disproportionately large share of the 2.3 billion people experiencing moderate or severe food insecurity as of 20234 and the majority of the world’s poor.5–8 Increasing their competitiveness and productivity would therefore have an immediate impact on poverty and food insecurity. Indeed, the Sustainable Development Goals aim to double the labour productivity and incomes of small-scale food producers by 2030 to end hunger, achieve food security and promote sustainable agriculture.
Large farms manage the majority of agricultural land and account for the bulk of global cereal, oilseed and livestock production, ensuring stability in food supply chains, export markets and urban food systems. Accordingly, they have very different incentive structures. On the one hand, large farms benefit from economies of scale, face much lower market constraints, and can optimize production through the use of technology; on the other, they often specialize in monoculture and intensive systems that may also increase land degradation and reduce crop diversity.9 Depending on the value chain, large-scale farms may dominate sustainability certification schemes, while at the same time leading to agricultural land expansion and the social exclusion of smallholders.3 Given that large farms operate the majority of the world’s farmland, the impacts of their decisions affect much wider areas of cropland and food availability, not only locally but also globally.
Recent studies indicate that the constraints limiting agricultural productivity vary depending on the scale of operation. When scale-dependent constraints are addressed, including those that prevent the efficient allocation of land and labour across farms of different sizes, there is significant potential to increase overall agricultural productivity.10–12 However, in sub-Saharan Africa, these challenges have shown little improvement, with smallholder total factor productivity decreasing over the last decade. In parallel, the adoption of sustainable land and water management strategies has also declined, despite exposure to land degradation.13, 14 Given the multiple challenges to rural transformation combined with population pressure in this region – the only region where the population is projected to increase over the next few decades – farm sizes are at the core of the dual challenge of food security and land degradation.15
Addressing differentiated pathways to land degradation by farm size therefore requires targeted interventions based on an understanding of how farms and farmlands are distributed worldwide, and of the specific dynamics at play. For instance, smallholders may contribute more to agrobiodiversity, rural employment and climate resilience, while larger farms provide high levels of output, underpinning commercially viable food production. A systems approach to understanding the interactions among farms of different sizes can uncover levers to enhance positive spillover effects for improved and sustainable land use and productivity enhancements.16, 17 Recognizing and addressing these interdependencies is critical to achieving global food security in the face of growing population demands and climate change.
Globally, farm sizes and production are unevenly distributed
The number of farms worldwide is continuously changing, based on multiple drivers (e.g. income, land availability, demographic change)18 and their distribution across different farm size categories. Understanding this trend is an essential component of designing and targeting policies to address challenges to agricultural production and land degradation. Farm size is strongly connected with multiple dimensions of food security. Furthermore, the discourse regarding the future of farms – including land and labour productivity, income and poverty, as well as interactions between other economic sectors and agriculture – is linked to farm size.19 Based on the most recent data available from agricultural censuses and surveys, and projections accounting for the main drivers of global farm numbers,18 this report estimates that there are just over 571 million farms globally in 2025, spread across 131 countries and territories.20
Table 1 presents the distribution of farms and agricultural land across farm size categories, along with the contribution of farms of each size to global dietary energy production. The total number of farms in the table is based on the latest available national data sources before projections to 2025, therefore differs from the total above. The gradual decline in the total number of farms is expected based on the historical patterns captured in projections. Estimating the distributional dynamics within countries, however, is not possible without further data and assumptions; hence the farm size and area distributions in this chapter are based on the year in which each country collected its data (spanning 2006–2023). This constitutes the most consistent and up-to-date picture of how the number of farms, agricultural land, and agricultural production are distributed globally.
TABLE 1 GLOBAL DISTRIBUTION OF FARMS, AREA OPERATED AND DIETARY ENERGY PRODUCTION
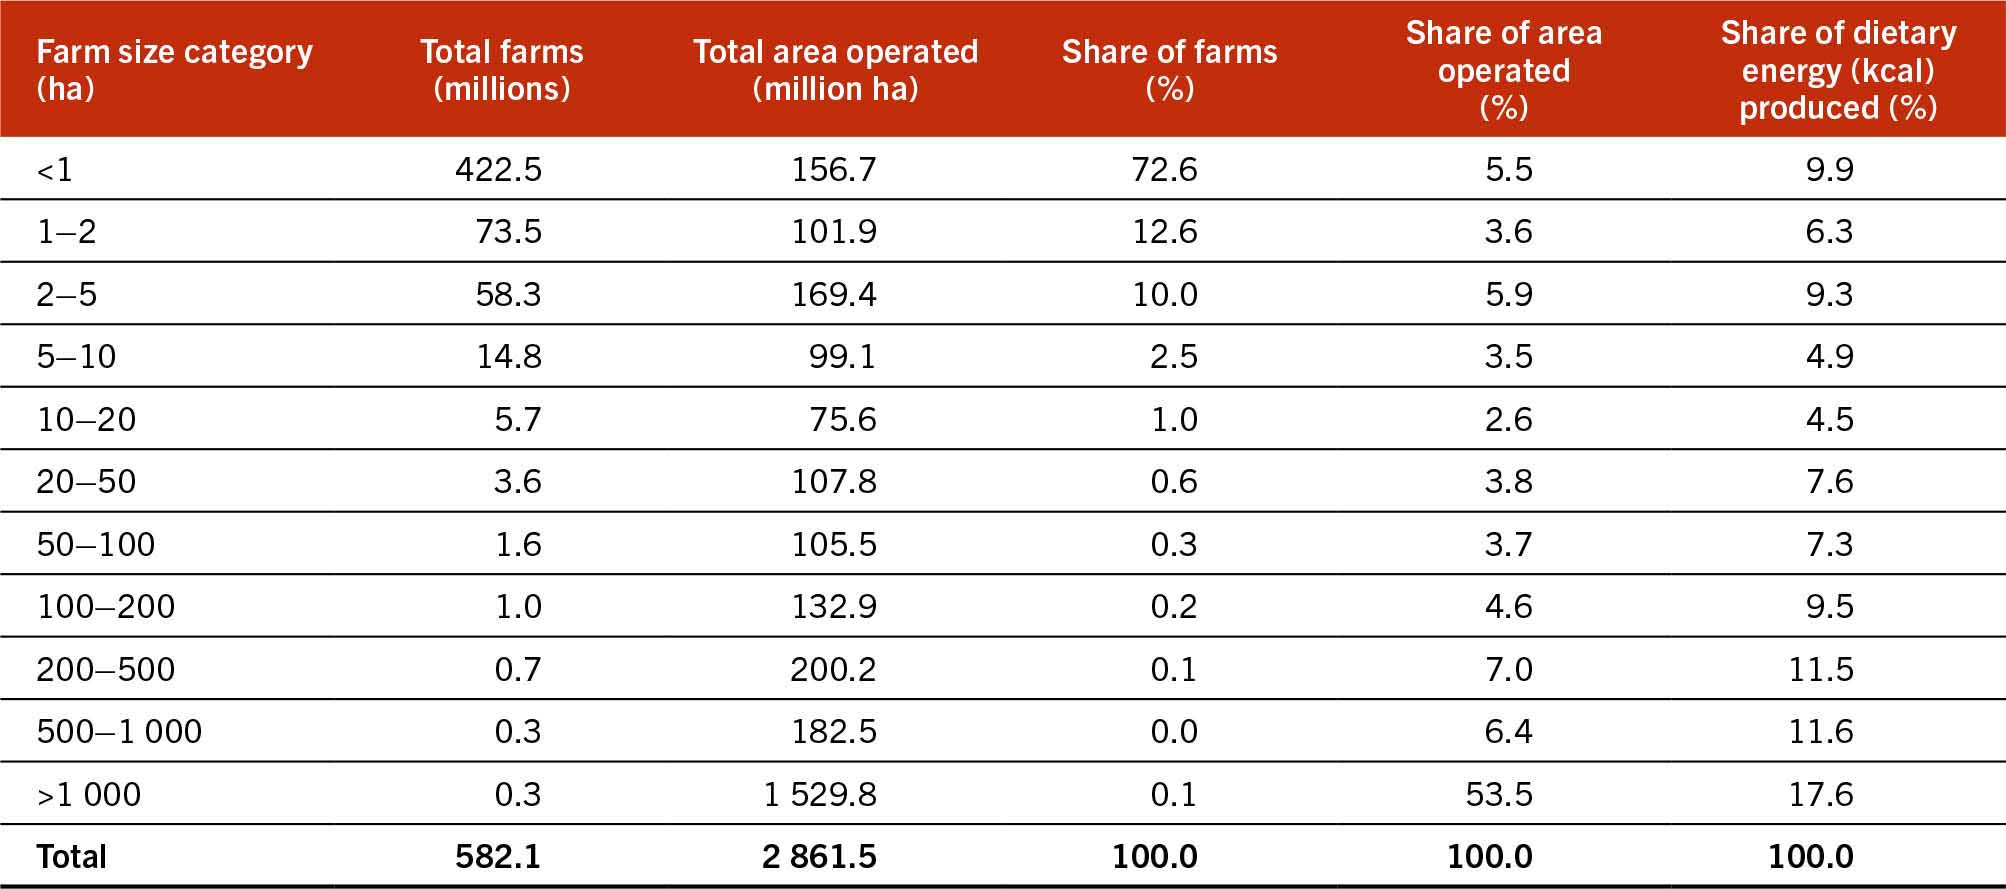
SOURCES: Authors’ own elaboration based on Lowder, S., Arslan, A., Cabrera Cevallos, C.E., O’Neill, M. & de la O Campos, A.P. 2025. A global update on the number of farms, farm size and farmland distribution – Background paper for The State of Food and Agriculture 2025. FAO Agricultural Development Economics Working Paper 25-14. Rome, FAO; Arslan, A., Ranuzzi, E., O’Neill, M., Ricciardi, V., Lowder, S. & Vaz, S. 2025. Revealing complementarities across farm scales in global food production – Background paper for The State of Food and Agriculture 2025. FAO Agricultural Development Economics Working Paper 25-13. Rome, FAO.
It is important to emphasize that the production estimates presented here pertain exclusively to cropland area, which is a subset of the broader agricultural land used by farms globally. They do not include ivestock, fisheries and other kinds of non-crop agricultural production.
The findings underscore the dominance of smallholder farms (<2 ha) in terms of numbers, as well as the disproportionate share of agricultural land controlled by farms exceeding 50 ha globally (accounting for around 75 percent). Detailed data on agricultural production from croplands available for 77 countries show that these larger farms produce more than 55 percent of crop-derived dietary energy globally.21 Among them, farms over 1 000 ha account for more than 50 percent of agricultural land and produce about 18 percent of all dietary energy from crops (see Annex 1 for country-specific data).
However, the global numbers in Table 1 conceal significant differences across regions and income groups. This chapter uses the most recent data and methodologies to provide a detailed understanding of these indicators, which are critical to the collective achievement of the 2030 Agenda for Sustainable Development.22
Farm distribution patterns vary across regions
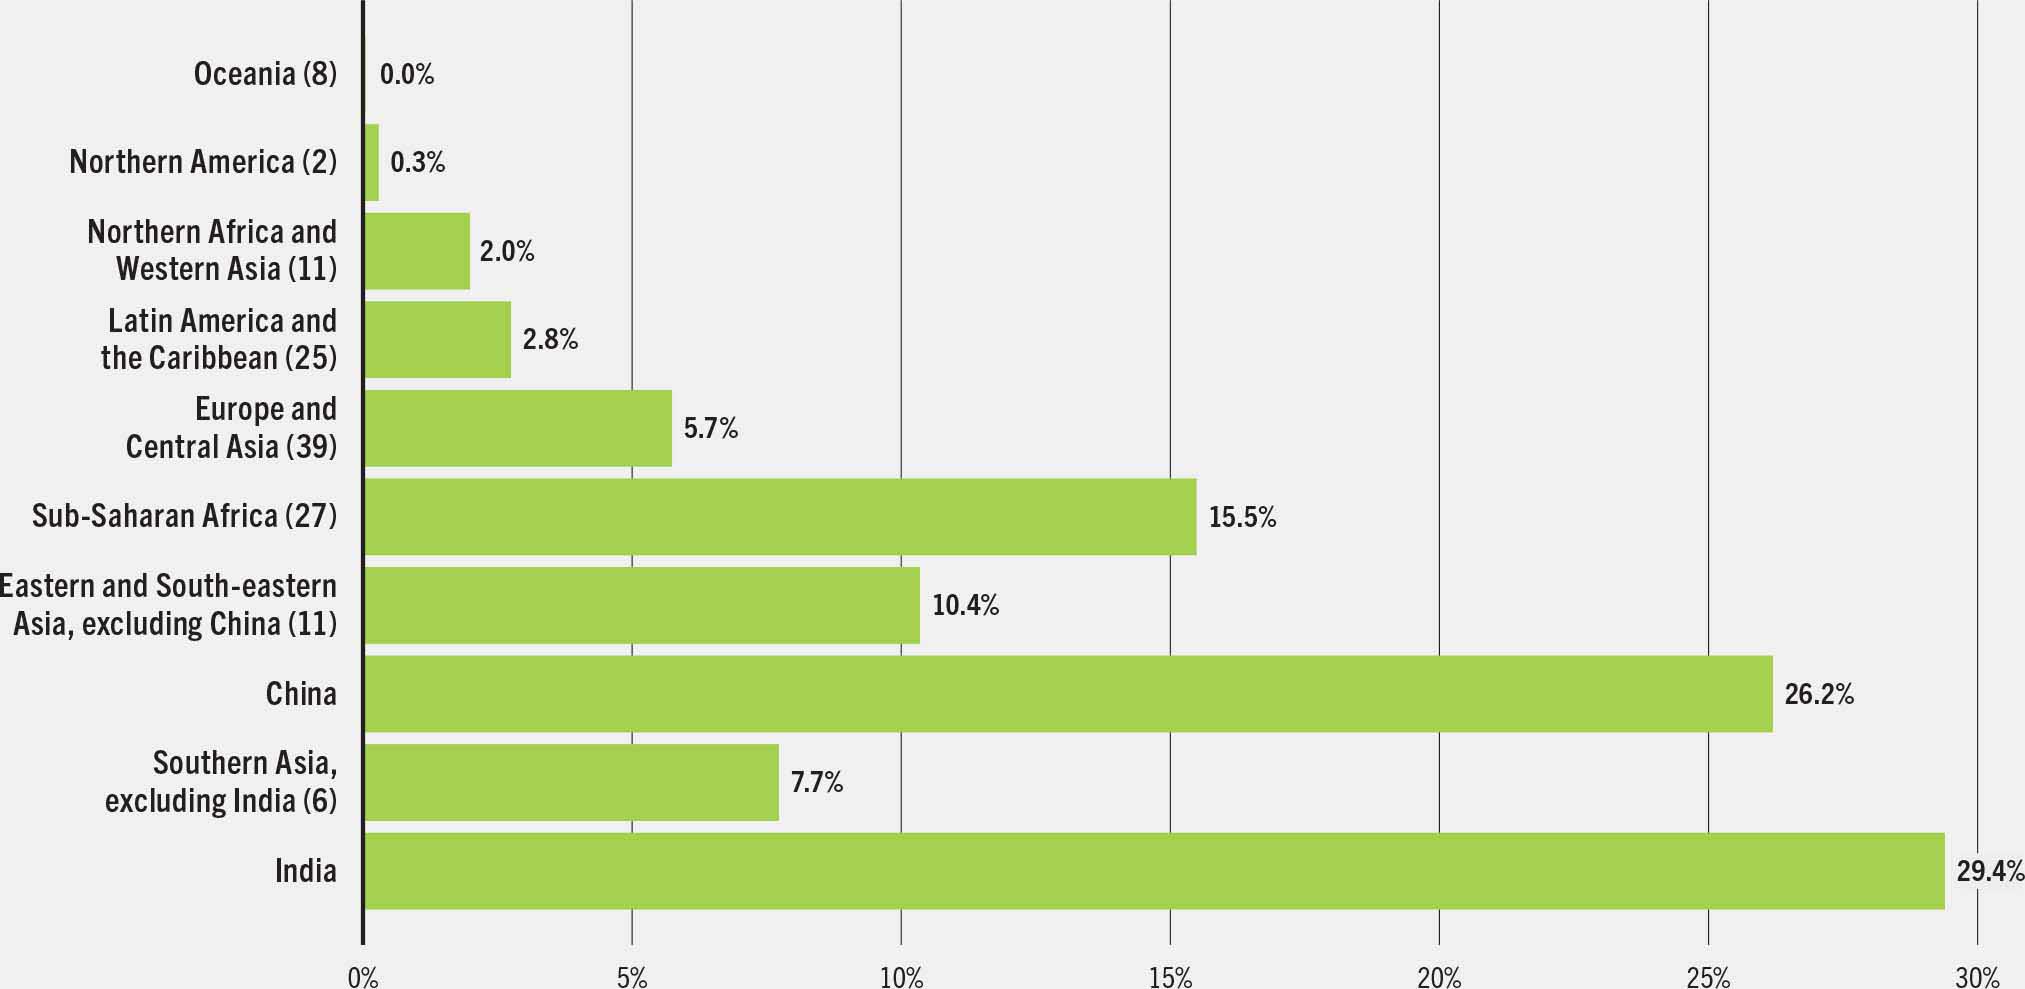
Of the estimated 571 million farms globally, China and India host around half. The rest of Eastern and South-eastern Asia accounts for 10 percent, and Southern Asia for 7.7 percent (Figure 13). In sub-Saharan Africa, 27 countries host 15.5 percent of the world’s farms. In contrast, farms in Latin America and the Caribbean tend to be larger but less numerous, making up only 3 percent of the global total.
Figure 13 Distribution of 571 million farms by region, 2025
SOURCE: Authors’ own elaboration based on Lowder, S., Arslan, A., Cabrera Cevallos, C.E., O’Neill, M. & de la O Campos, A.P. 2025. A global update on the number of farms, farm size and farmland distribution – Background paper for The State of Food and Agriculture 2025. FAO Agricultural Development Economics Working Paper 25-14. Rome, FAO.
Some 6 percent of the world’s farms are located in 39 European and Central Asian countries, while Northern America accounts for only a negligible share, reflecting the large farm sizes in Canada and the United States of America compared to Europe. Similarly, the share of farms in eight countries of Oceania is also negligible, due to the very large but very few farms in Australia and New Zealand, as well as the small number of farms located in the region's small island states.
If historical structural transformation pathways were to unfold everywhere, there would be a decrease in the share of agriculture in the economy and labour force, accompanied by farmland consolidation and urbanization.18, 23 These pathways might differ across regions, however. The total number of farms in the world is projected to decrease by 50 percent by the end of the twenty-first century. At the same time, the number of farms in some regions is projected to increase significantly, particularly in sub-Saharan Africa, representing a deviation from historical pathways.18, 22
While the total number of farms is indicative of the location of farming activity in the world, understanding how global agricultural land is managed also requires information on the scale of farming operations. Consistent and up-to-date data on a large set of countries on this topic have been scarce, leading researchers to rely on outdated datasets and simple projections,24 or on downscaled large-scale earth observation data, which introduce substantial uncertainties.25 Such information is essential for efforts to develop the necessary context-specific balance between improving the livelihoods of rural producers and meeting the changing food demands of an increasingly urban population, while simultaneously addressing land degradation.19
To bridge this gap, a new database curated by FAO leverages the latest methodological advances to estimate comparable full farm size distributions from (sometimes limited and incomplete) official census data (Box 10).
Box 10Estimating global farm size distributions
Analysis of farm size distribution relies on three main approaches: direct observation from survey data,26 analysis of aggregated census data24 or downscaled Earth observation data, in which satellite measurements of field sizes are calibrated with national data.25 All of these methods come with strengths and limitations.
Reliance on survey data can limit the scope of a study, as coverage is necessarily constrained to a subset of countries and territories with recent farm size surveys. Additionally, the surveys used may not be nationally representative, and their sampling frames may systematically exclude certain categories of holdings.
Use of official data from agricultural censuses allows for broader geographical coverage but comes with its own drawbacks.20 Census data are almost always processed to prepare publicly available tabulations at aggregate levels, preventing direct computation of key distributional measures such as the median or inequality indices. Furthermore, the land size categories used in census tabulations often vary across countries and over time, complicating cross-country and intertemporal comparisons of farm size distribution. Finally, many countries go decades without conducting agricultural censuses, leading to reliance on outdated data.
To tackle these challenges, Cabrera Cevallos et al. (forthcoming) developed LINEQ: Global Database of Land Distribution and Inequality, a comprehensive resource providing harmonized estimates of farm size distributions and land inequality.27 The database applies advanced interpolation techniques to census tabulations from the World Programme for the Census of Agriculture, reconstructing the full underlying distribution of farm sizes as a generalized Pareto curve.28 This enables the estimation of key distributional measures while ensuring consistent farm size categories across all countries and time periods.
To enhance coverage, LINEQ also integrates nationally representative surveys, particularly to fill gaps in sub-Saharan Africa, where census data are often scarce. This combined approach allows for a more comprehensive and globally comparable dataset, covering 178 countries and including 593 censuses and 32 surveys. Of the countries covered, 131 have reported detailed data on farm size distribution since 2006, and these form the basis of most of the analysis in this chapter.
The global distribution of farmland by size reveals three key insights (Figure 14). First, smallholder farms (<2 ha) are vast in number, estimated at around 500 million; they constitute approximately 85 percent of all farms worldwide, yet collectively occupy a much smaller portion of the land, spanning only about 9 percent of global agricultural area. In contrast, medium-sized farms (2–50 ha) represent a more balanced share, accounting for around 14 and 16 percent of the number of farms and the agricultural area operated, respectively. Finally, farms classified as large (>50 ha) make up less than 1 percent of all farms but cover a substantial 75 percent of agricultural land. This concentration is even more pronounced within very large farms exceeding 1 000 ha, which, despite their tiny number (290 000), operate on more than 50 percent of global agricultural land (equivalent to 1.5 billion ha). These very large farms cover vast areas of farmland in five countries: Australia, Russian Federation, United States of America, Brazil and Argentina – listed by extent of agricultural area.
Figure 14 Global share of farms and area operated by farm size
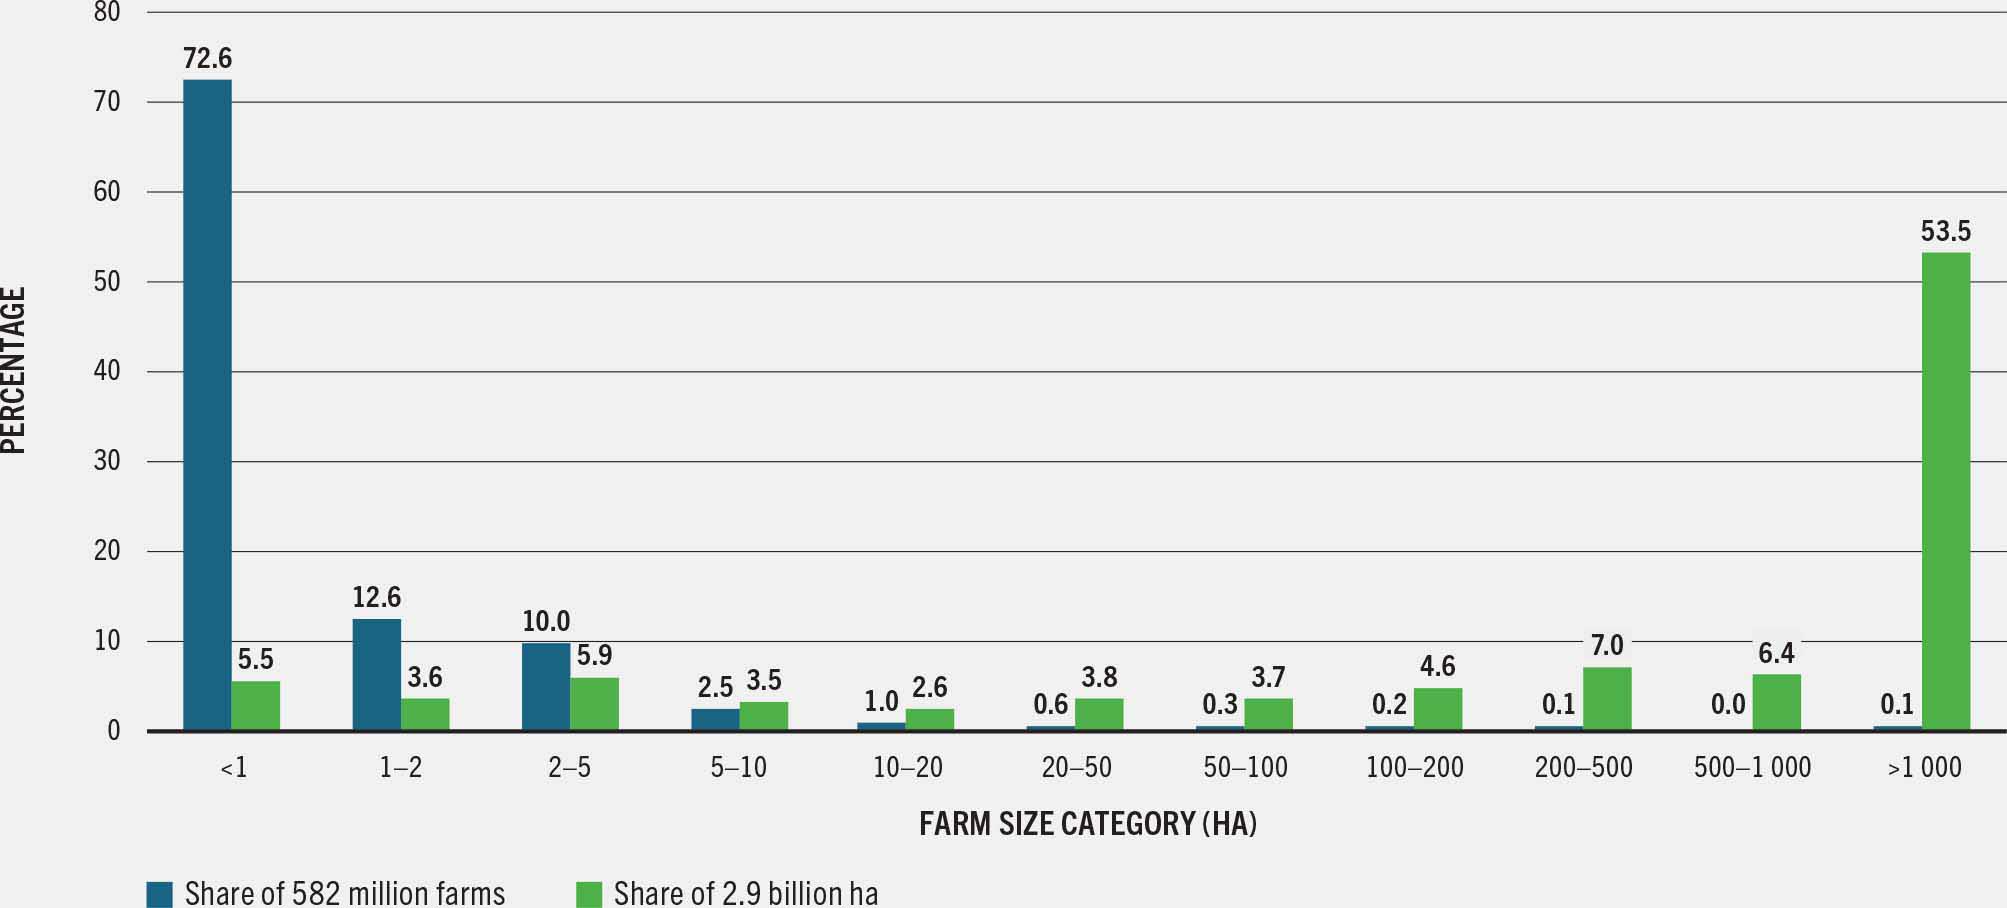
SOURCE: Authors’ own elaboration based on Lowder, S., Arslan, A., Cabrera Cevallos, C.E., O’Neill, M. & de la O Campos, A.P. 2025. A global update on the number of farms, farm size and farmland distribution – Background paper for The State of Food and Agriculture 2025. FAO Agricultural Development Economics Working Paper 25-14. Rome, FAO.
The stark contrast between the high prevalence of smallholdings and the limited number of very large operations underscores a critical policy dichotomy. On the one hand, these figures supply evidence of the need to support the livelihoods of the vast number of smallholders reliant on land; on the other, improving the sustainability of land management practices is paramount for the minority of farms that steward a disproportionately large share of global agricultural land. Given this unequal farmland distribution, tackling large-scale issues – for example, land degradation, the concentration of agricultural production, and the environmental impacts of monocropping – demands targeted strategies for the largest farms. Conversely, supporting smallholders remains essential to positively impact the practices and livelihoods of the greatest number of farmers.
However, the picture of farm size distribution is not uniform worldwide, with both numbers and sizes varying significantly and distinct patterns emerging across regions. As shown in Figure 15, agricultural systems in Asia and Africa are composed primarily of numerous small-scale holdings. At the same time, around 50 percent of agricultural land is operated by farms that range between 2 ha and 50 ha in both regions. In comparison, Europe and Central Asia, Latin America and the Caribbean, Northern America, and Oceania display a broader distribution of farm sizes, along with very concentrated farmland distributions. Northern America stands out with the lowest share of smallholders and a balanced distribution of farm sizes, although more than 60 percent of all agricultural land is operated by farms exceeding 1 000 ha.
Figure 15 Proportion of holdings and area operated by region

SOURCE: Authors’ own elaboration based on Lowder, S., Arslan, A., Cabrera Cevallos, C.E., O’Neill, M. & de la O Campos, A.P. 2025. A global update on the number of farms, farm size and farmland distribution – Background paper for The State of Food and Agriculture 2025. FAO Agricultural Development Economics Working Paper 25-14. Rome, FAO.
Farm distribution differs across country income groups
Farmland distribution is highly correlated with income groupings (Figure 16). In low- and lower-middle-income countries, agriculture is driven predominantly by a large number of smallholders. Taken collectively, these smallholders manage a significant proportion of the land, despite the small size of their holdings. Farms larger than 10 ha are rare in these income categories.
Figure 16 Proportion of holdings and area operated by country income group
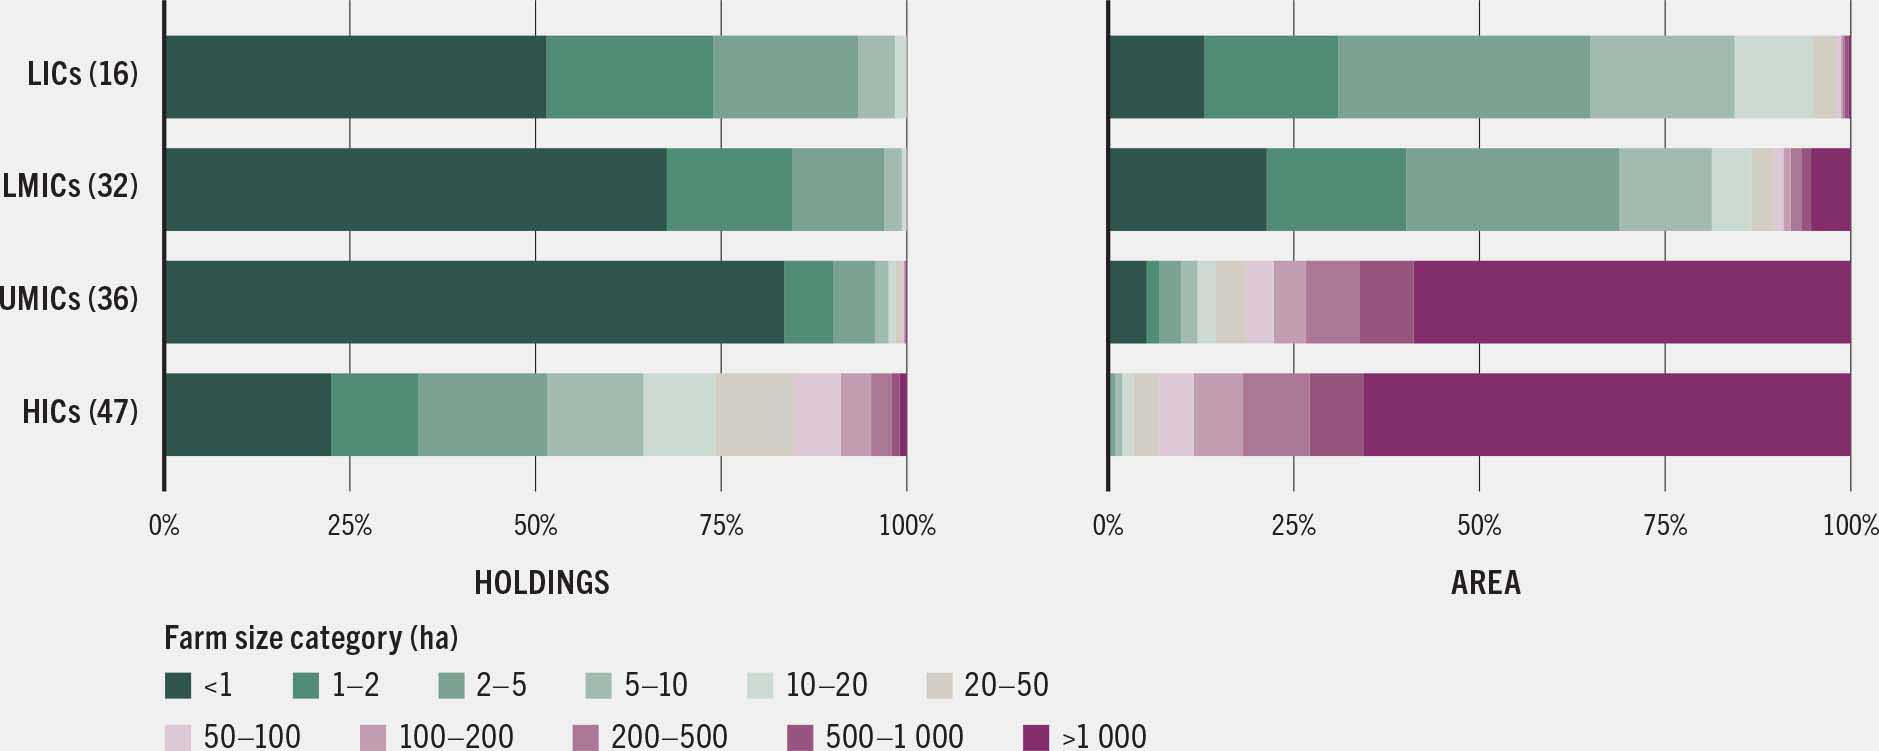
SOURCE: Authors’ own elaboration based on Lowder, S., Arslan, A., Cabrera Cevallos, C.E., O’Neill, M. & de la O Campos, A.P. 2025. A global update on the number of farms, farm size and farmland distribution – Background paper for The State of Food and Agriculture 2025. FAO Agricultural Development Economics Working Paper 25-14. Rome, FAO.
In upper-middle-income countries, while smallholdings account for the largest proportion of farms, their share of the land is significantly lower, with very large farms of 1 000 ha or more covering more than half of the farmland.b
High-income countries, in contrast, exhibit a broader range of farm sizes. Nevertheless, here too, land management is dominated by very large farms, which cover a clear majority of agricultural land. This pattern highlights a fundamental shift from smallholder-dominated farming in lower-income economies to the dominance of large-scale agricultural operations in higher-income economies.
This trend suggests that in countries with higher income levels, farmland tends to be more concentrated among large farms, while smallholdings are less common. This observed tendency towards consolidation – where farms become larger and fewer – aligns with expectations based on conventional theories of how economies develop and transform. However, these expectations are not fully supported by detailed assessments at the country level, as patterns differ significantly. Increasing evidence shows that structural transformation does not necessarily lead to land consolidation in many places.29 Instead, trends in average farm size over time, for select countries, show that population density seems to explain changes in average farm size (one aspect of farmland distribution) better than economic growth.
Farmland patterns are changing over time
Globally, farmland distribution patterns evolve, albeit slowly, with farm sizes exhibiting divergent trends across regions. Before examining these trends, it is important to note the distinction between mean (commonly referred to as “average”) farm size and median farm size, as these convey different information about the typical farm and inequality. While the mean farm size is frequently used in discussions of trends, it can be heavily influenced by extremely large or small holdings and may not accurately represent the size of a typical farm. The median farm size, on the other hand, provides a better picture of the typical farm, as the size falls exactly in the middle of the distribution. Comparing the mean to the median can therefore serve as an implicit indicator of farm size inequality.
Looking at the trends, farm sizes present divergent trajectories globally. As economies have grown and structural transformation unfolded, operated farm sizes have increased in most regions (especially in the twentieth century), albeit with notable exceptions. More recently, in the last 20 years, mean farm sizes have continued to increase in most of Latin America and the Caribbean and Europe and Central Asia, while decreasing in most of the rest of Asia. However, this decrease has since slowed compared to the period from 1960 to the early 2000s.23, 24
In sub-Saharan Africa, farm sizes in general have historically become smaller in tandem with population growth, with some recent exceptions. For instance, in Ghana, the United Republic of Tanzania and Zambia, farms in the middle of the distribution (5–100 ha) have increased in size due to growth in investments by urban-based professionals or wealthier rural residents. Nevertheless, smallholdings continue to make up the overwhelming majority of farms, even in these countries.26
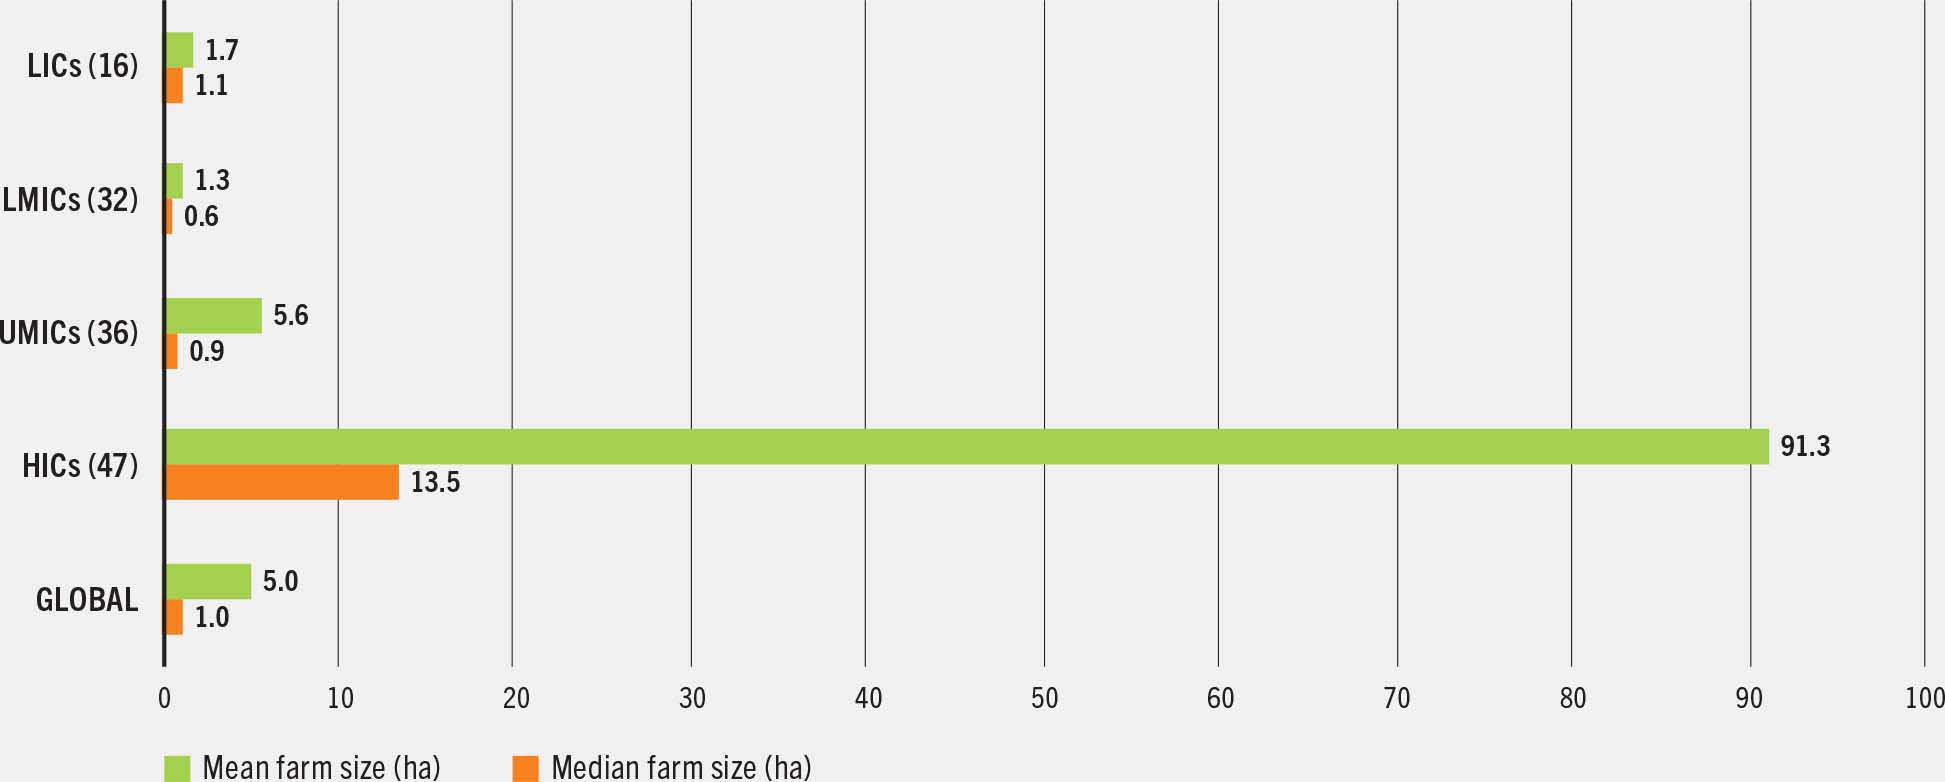
The difference between mean and median farm sizes is significant globally. Across the 131 countries included in the farm size distribution analysis, mean farm sizes are two to seven times greater than median farm sizes across all income groups (Figure 17). This difference is largest in UMICs and HICs, pointing to higher levels of inequality in this group.
Figure 17 Mean and median farm sizes by country income group
SOURCE: Authors’ own elaboration based on Lowder, S., Arslan, A., Cabrera Cevallos, C.E., O’Neill, M. & de la O Campos, A.P. 2025. A global update on the number of farms, farm size and farmland distribution – Background paper for The State of Food and Agriculture 2025. FAO Agricultural Development Economics Working Paper 25-14. Rome, FAO.
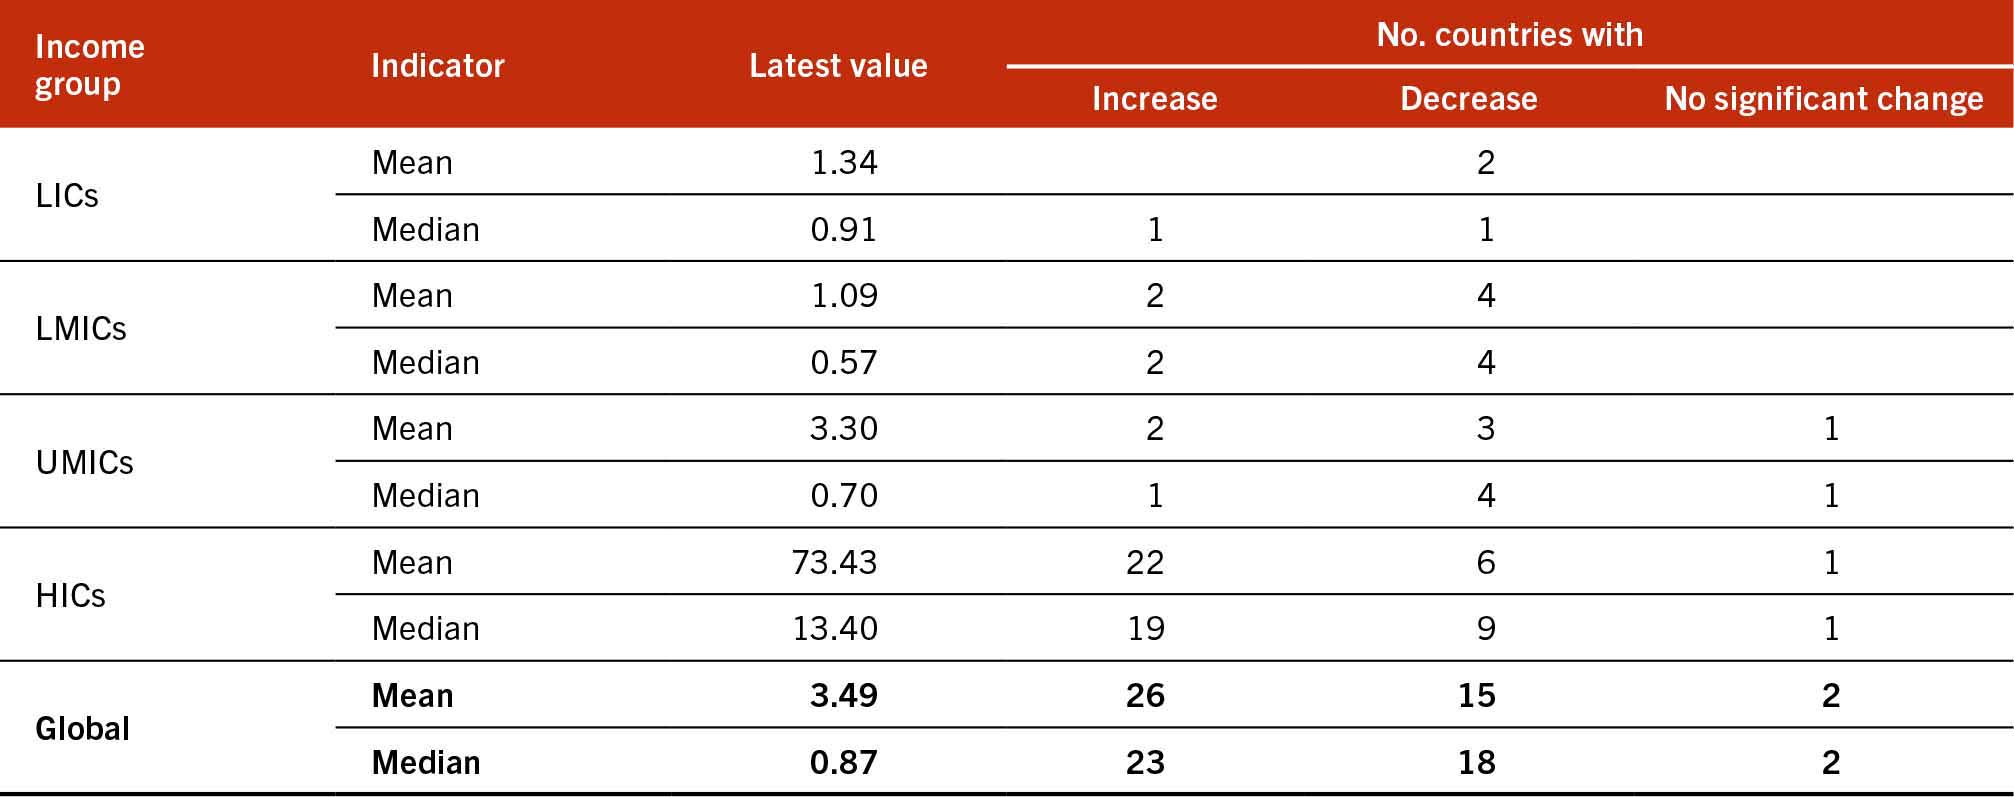
Using data from 43 countries that have conducted at least two censuses since the 2000s, a recent analysis of managed agricultural land by size shows that the mean farm size differs notably across country income groups, and that HICs and UMICs have experienced significant increases in both mean and median farm sizes (Table 2).20
TABLE 2 CHANGES IN MEAN AND MEDIAN FARM SIZES FROM THE 2000S TO THE 2020S BY COUNTRY INCOME GROUP
SOURCE: Authors’ own elaboration based on Cabrera Cevallos, C.E., de la O Campos, A.P., O’Neill, M., di Simone, L. & Fahad, M. (forthcoming). Divide in the fields: A study of global agricultural land inequality. FAO Agricultural Development Economics Working Paper. Rome, FAO.
Despite limited data availability for LICs and LMICs, the sample presented reveals meaningful trends. Globally, more than half of the countries in the study experienced an increase in both mean and median farm sizes between 2000 and 2020. This upward trend is driven largely by HICs, of which 22 out of 29 reported an increase in the mean, and 19 reported an increase in the median. In contrast, the limited data for LICs and LMICs suggest an inverse trend, with both indicators generally declining over the same period. Additionally, the difference between the mean and the median is significantly more pronounced in UMICs and HICs, indicating more unequal distributions. Notably, only a small number of countries across all income groups showed no significant change, reinforcing the point that the observed trends are, in most cases, statistically meaningful.
These findings suggest not only growing disparities in average holding sizes across countries but also widening gaps within them – particularly in HICs. At the same time, it should be noted that land area is only one dimension of farm distribution. Differences in land quality also shape productive potential and economic outcomes; when land is assessed in terms of quality or value, even starker disparities may emerge. New approaches using geospatial data and environmental indicators are beginning to shed light on this dimension of inequality (Box 11).
Box 11Land distribution: quantity versus quality?
While land area remains the most common metric for assessing distribution, differences in land quality are equally important for understanding inequality in agricultural potential and economic outcomes. Land value, which can serve as a proxy for productivity, offers useful insights. Recent studies have shown that land inequality appears more pronounced when both size and value are considered, with larger landholders often owning higher-quality, more productive land.30 While developed countries regularly monitor land prices through registries and surveys, such data are scarce in many developing regions, especially for agricultural land. One approach that addresses this gap is to standardize land area using observable farm-level characteristics or geospatial data which reflect land quality and productivity.
Earth observation data can be used to develop a Crop Productivity Index (CropPI) as a proxy for land quality.31 CropPI combines real-time environmental data (temperature, water availability and soil conditions) with crop-specific requirements to assess the suitability of local conditions for agricultural production. This enables estimation of the natural productivity potential of land across both spatial and temporal dimensions.
Standardizing land by its potential productivity generally leads to an increase in measured inequality. In several African and Latin American countries, for example, the share of high-quality land operated by the top 10 percent rises, while the share held by the bottom 40 percent typically declines, when compared to the equivalent shares of non-quality-adjusted land.27, 32 This pattern highlights a concentration of high-potential land among fewer landholders.


