

Understanding which farms produce the bulk of the world’s food is central to shaping effective agricultural policies and research. Given the vastly different shares of global land operated by farms of different sizes documented above, determining how much of the world’s food is produced by each size category is critical to designing sustainable agrifood systems policies. Farms of different sizes have complementary roles to play in meeting the demand for land-based agricultural products while conserving ecosystem services.33
Thus far, most research on global food production by farm size and the future of farming has concentrated on smallholdings and family farms. This emphasis is driven partly by the SDGs, as many related indicators focus on the role of smallholders in sustainable development.9, 24, 25, 33 Smallholders tend to grow a more diverse range of crops and non-crops,34 with most of their crop production consumed as food; in contrast, larger farms tend to produce crops for animal feed and processing.9 This difference in categories of food produced at varying scales adds to the complementarity of different types of farms within an agrifood system.
While some of this research adopts a systems approach and assesses the contributions of larger farms, the onus of the discourse on the future of farming and farm sizes remains on smallholders. This section expands the literature by addressing data and methodological challenges to examine how farms across 11 farm size categories contribute to the global production of crops supplying a significant share of dietary energy (including from macronutrients).
Diversity of global agricultural production patterns
The latest analysis – based on a comprehensive assessment of direct measurements of production on croplands, drawing on 77 agricultural censuses and nationally representative surveys – shows that crops produced by smallholder farms supply globally 16 percent and 12 percent of crop-derived dietary energy and proteins, respectively, in addition to 9 percent of fats.21 These figures reflect only the production of crop-derived nutrients, and therefore exclude the dietary contributions of livestock, fisheries, forestry and other sources of nutrition. The results of this assessment are illustrated in Figure 18. The figure also addresses the limited spatial coverage of Africa, South-eastern Asia and Eastern Asia, as well as associated methodological challenges in previous literature,9 which decrease the share of food production previously attributed to smallholders. Regardless, considering the multitude of constraints that smallholders face in accessing resources such as land, finance, inputs, information and technology, their contribution to global food production remains remarkable. Moreover, given the sheer number of smallholders in many developing countries, they remain critical to local food availability and improved incomes and livelihoods and play a vital role in inclusive rural transformation.
Figure 18 Share of dietary energy, proteins and fats supplied by crop production by farm size
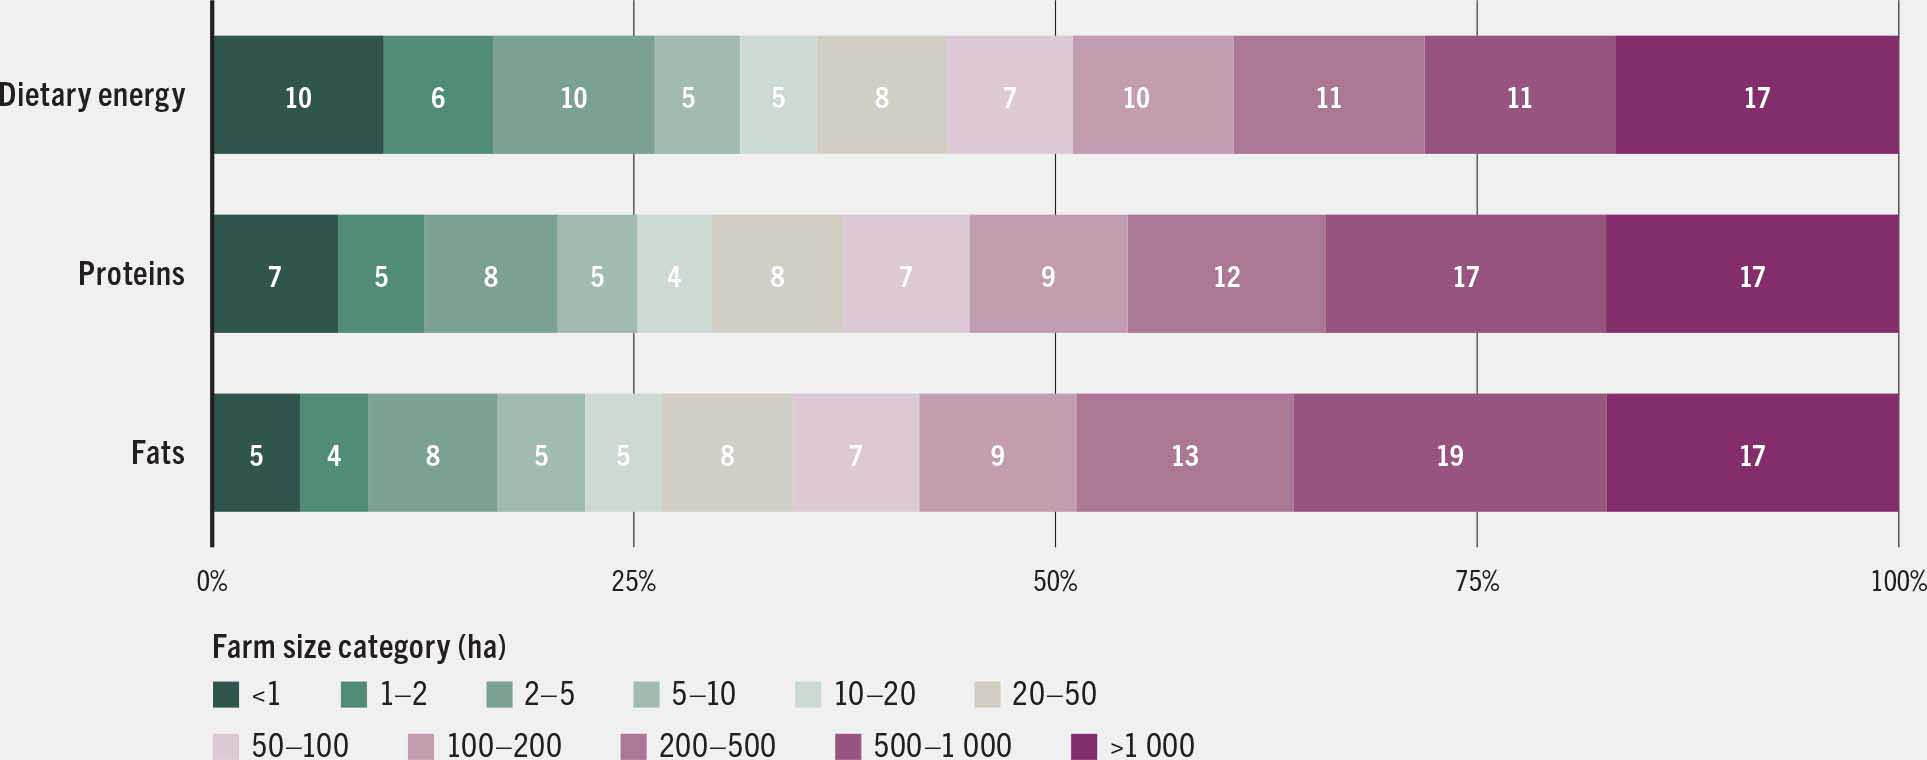
SOURCE: Authors’ own elaboration based on Arslan, A., Ranuzzi, E., O’Neill, M., Ricciardi, V., Lowder, S. & Vaz, S. 2025. Revealing complementarities across farm scales in global food production – Background paper for The State of Food and Agriculture 2025. FAO Agricultural Development Economics Working Paper 25-13. Rome, FAO.
Globally, however, larger farms play a leading role in food production, reflecting their dominance over the control of land. Farms between 2 ha and 50 ha produce crops accounting for around one-quarter of all dietary energy and macronutrients assessed, while those larger than 50 ha are responsible for approximately 60 percent. The largest farm size category (>1 000 ha) is responsible for almost one-sixth of the dietary energy and macronutrients derived from crop production globally.
The contribution of farms of different sizes to crop production varies significantly by country income level (Figure 19). In HICs, farms larger than 1 000 ha account for about one-third of all dietary energy supplied by crops, underscoring the dominance of large-scale commercial agriculture. In contrast, in LICs and LMICs, the vast majority of crop production comes from farms smaller than 5 ha, highlighting the critical role of smallholder farmers in these regions.
Figure 19 Share of dietary energy, proteins and fats supplied by crop production by country income group and farm size
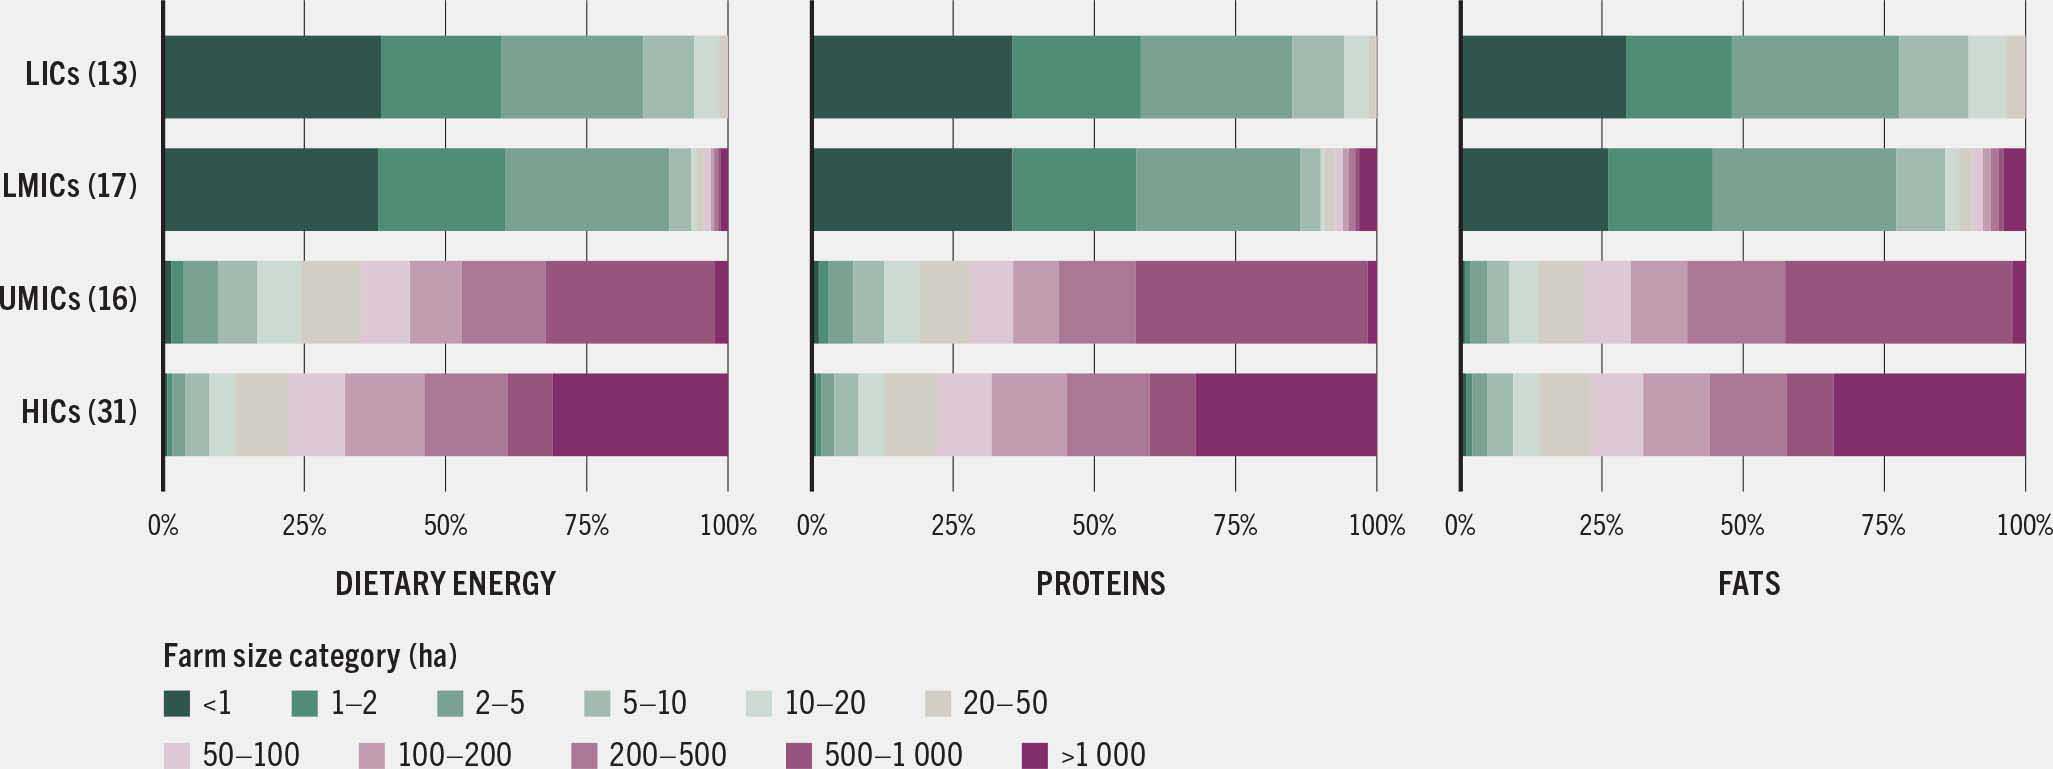
SOURCE: Authors’ own elaboration based on Arslan, A., Ranuzzi, E., O’Neill, M., Ricciardi, V., Lowder, S. & Vaz, S. 2025. Revealing complementarities across farm scales in global food production – Background paper for The State of Food and Agriculture 2025. FAO Agricultural Development Economics Working Paper 25-13. Rome, FAO.
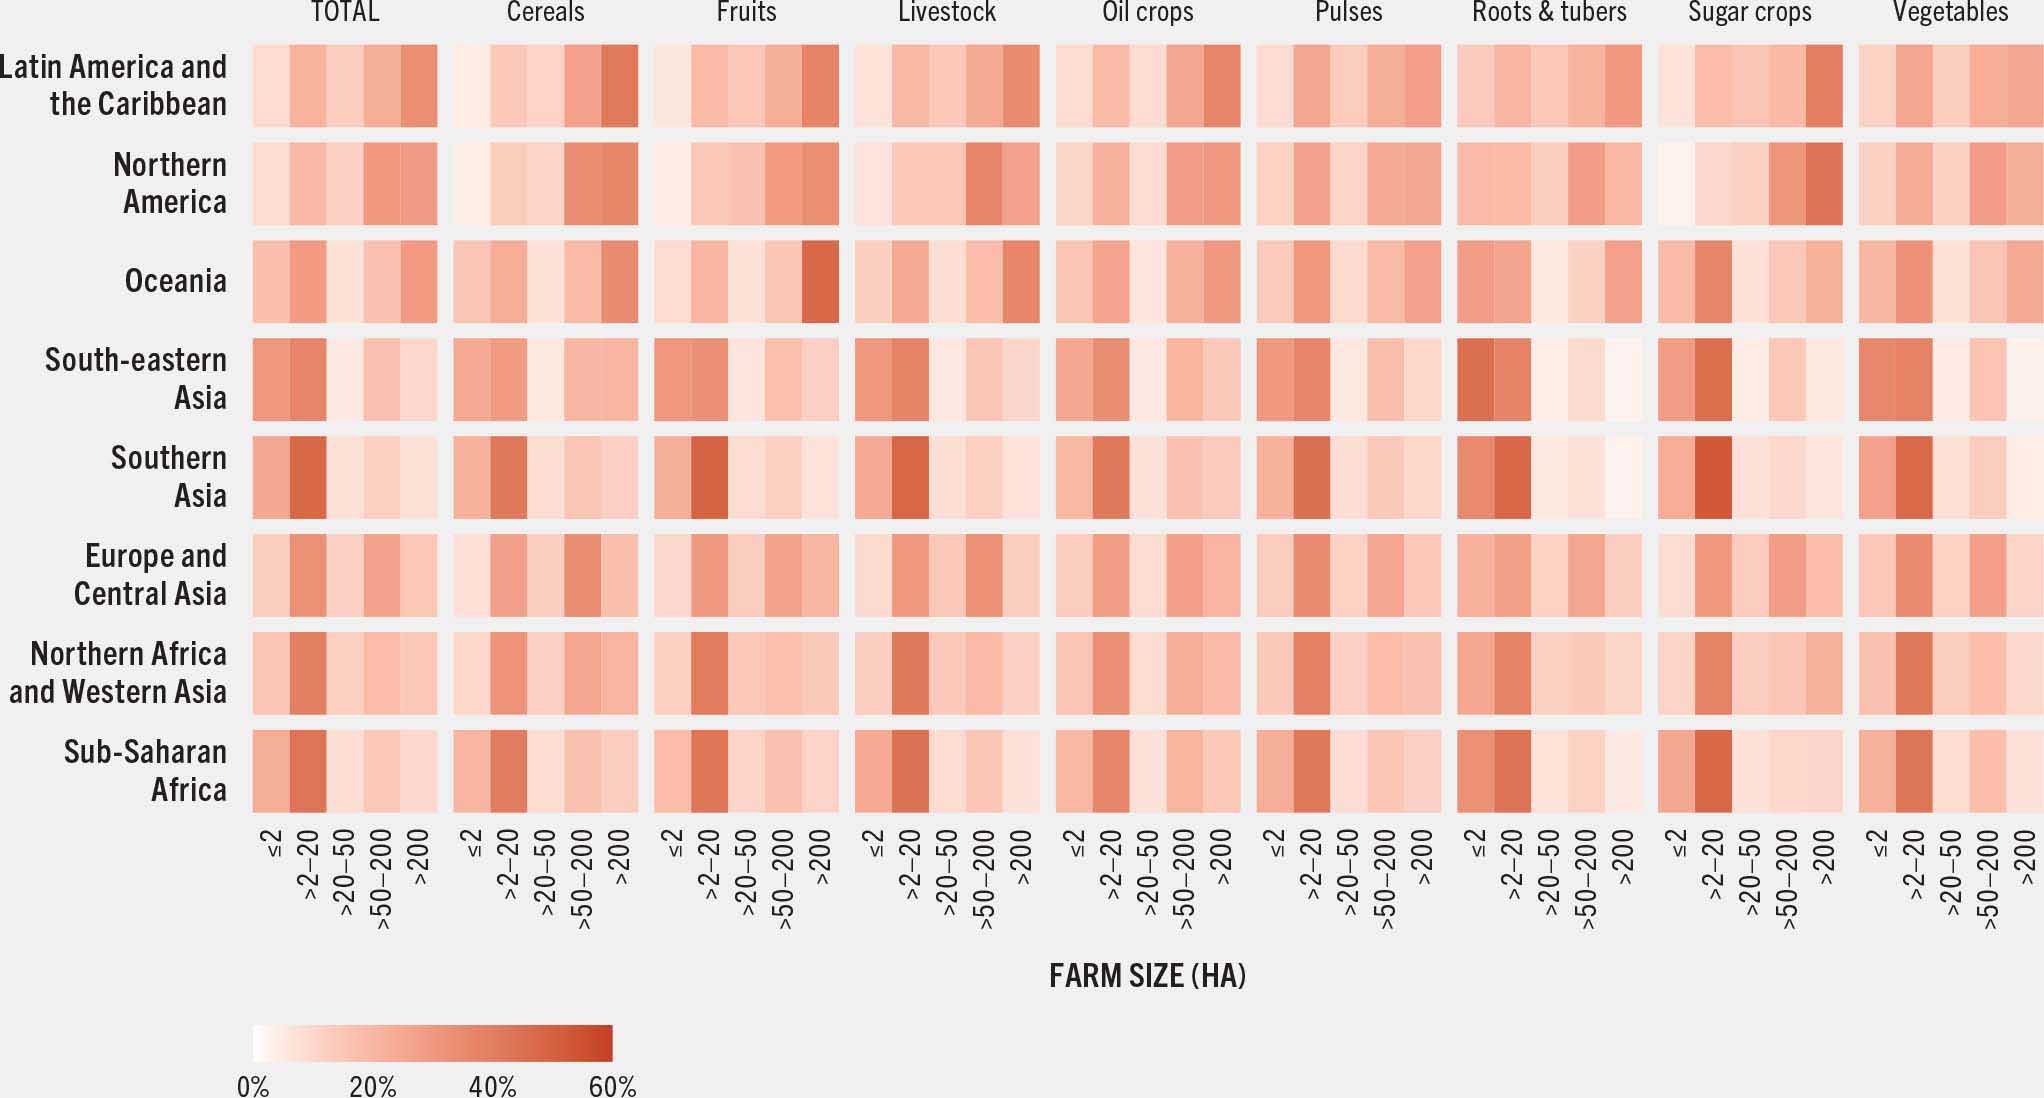
At the regional level, a particularly striking trend emerges in Northern America, where the only country included in the dataset is the United States of America; farms larger than 1 000 ha produce almost half of the country’s crop-derived dietary energy supply (Figure 20). This pattern reflects the dominant role of large-scale farming operations in national and global food supply chains.
Figure 20 Share of dietary energy, proteins and fats supplied by crop PRODUCTION BY region and farm size

SOURCE: Authors’ own elaboration based on Arslan, A., Ranuzzi, E., O’Neill, M., Ricciardi, V., Lowder, S. & Vaz, S. 2025. Revealing complementarities across farm scales in global food production – Background paper for The State of Food and Agriculture 2025. FAO Agricultural Development Economics Working Paper 25-13. Rome, FAO.
A similar, though less extreme, concentration is observed in Latin America and the Caribbean, where farms greater than 500 ha also account for a substantial share of crop-based dietary energy production. This pattern is strongly shaped by Brazil, the region’s agricultural powerhouse, where commercial farming plays a leading role alongside a large base of small and medium-sized farms.
In contrast, this degree of concentration is not observed in Europe and Central Asia, where farms in the 100–200 ha range contribute the most to dietary energy production. This reflects the region’s distinct agricultural structure characterized by medium-sized farms rather than the vast expanses of farmland seen in the Americas.
In sub-Saharan Africa and South-eastern, Eastern and Southern Asia, small farms under 5 ha continue to play a crucial role, producing the bulk of food supplies. This trend highlights the persistence of smallholder farming as the backbone of food security and livelihoods in these regions, emphasizing the need for policies that support their productivity.
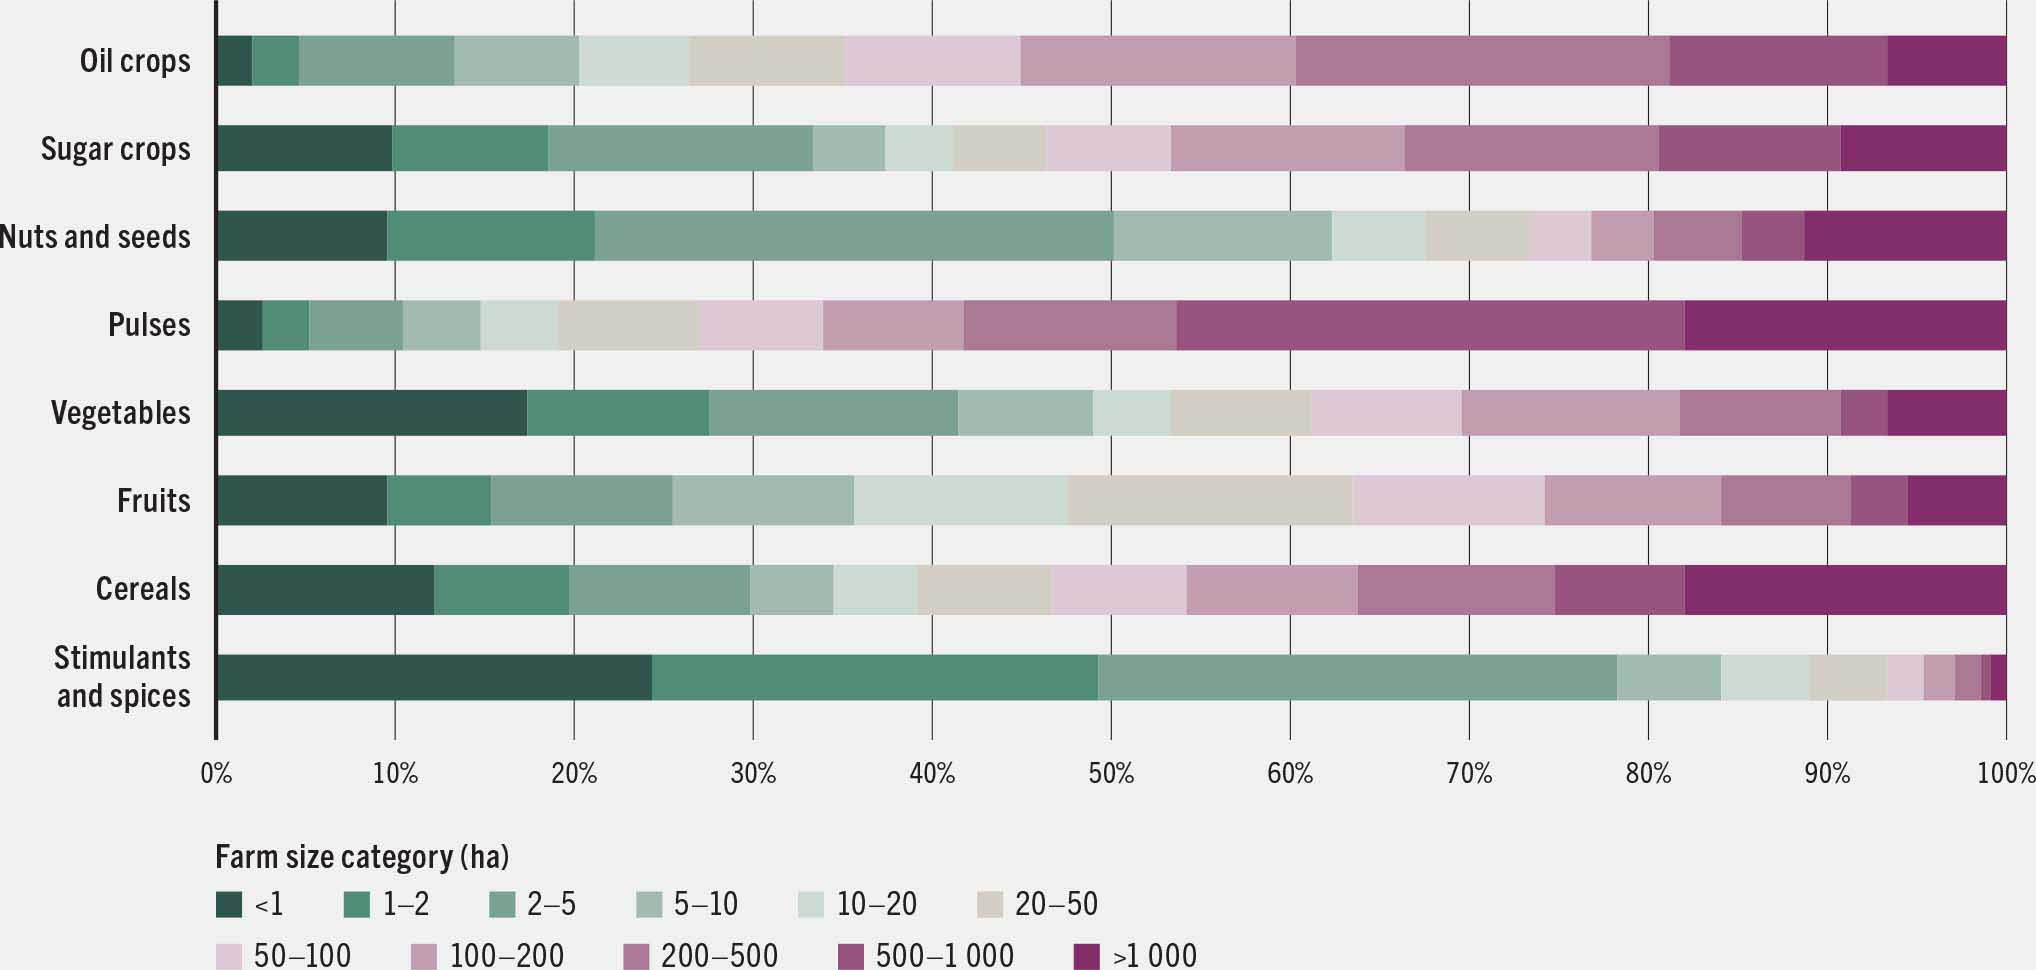
The above global assessment is a first step in understanding how farm size relates to overall nutrient availability. While proteins and fats are significant sources of energy in diets, a more complete understanding of which types of crops are grown is needed to guide policy. Figure 21 shows the relative contributions of farms of different sizes to global food production by crop group. Smallholders’ contribution to the production of cereals, fruits and vegetables is around 20–30 percent. Farms smaller than 5 ha produce almost 50 percent of the global output of stimulants, spices and aromatic crops. Despite their minimal contribution to caloric intake, these are high-value crops that boost smallholder incomes. For example, in northeastern Madagascar – the global centre of vanilla production – such crops significantly enhance smallholder livelihoods through increased income and asset ownership.35 There is also growing evidence that herbs and spices add to overall human health and wellness thanks to a variety of beneficial properties.36, 37
Figure 21 Contribution of different farm sizes to global dietary energy production by crop group
SOURCE: Authors’ own elaboration based on Arslan, A., Ranuzzi, E., O’Neill, M., Ricciardi, V., Lowder, S. & Vaz, S. 2025. Revealing complementarities across farm scales in global food production. FAO Agricultural Development Economics Working Paper 25-13. Rome, FAO.
Farms greater than 50 ha dominate the global production of cereals, pulses, sugars and oil crops. These commodities are highly traded globally, reflecting larger farms’ better integration into global supply chains.9, 25 In addition, the consumption of whole grains, pulses and seeds is associated with improved health and a reduced risk of chronic diseases.38–40
Micronutrients are essential for human health and well-being. How their production is distributed across farm sizes can inform nutrition-sensitive agricultural and land-use policies. Small farms account for 20 percent of vitamin C and 17 percent of vitamin A global production, reflecting their significant role in the cultivation of fruits and vegetables. Interestingly, farms ranging from 2 ha to 50 ha are the top contributors to the global availability of these two micronutrients, producing 28 percent of vitamin C and 25 percent of vitamin A. Meanwhile, the largest farms (>1 000 ha) account for more than 17 percent of the global production of several essential minerals including iron, magnesium, potassium and zinc.21 This reflects their leading role in cultivating nutrient-dense staples like grains and legumes, which are among the richest dietary sources of these essential micronutrients.41, 42
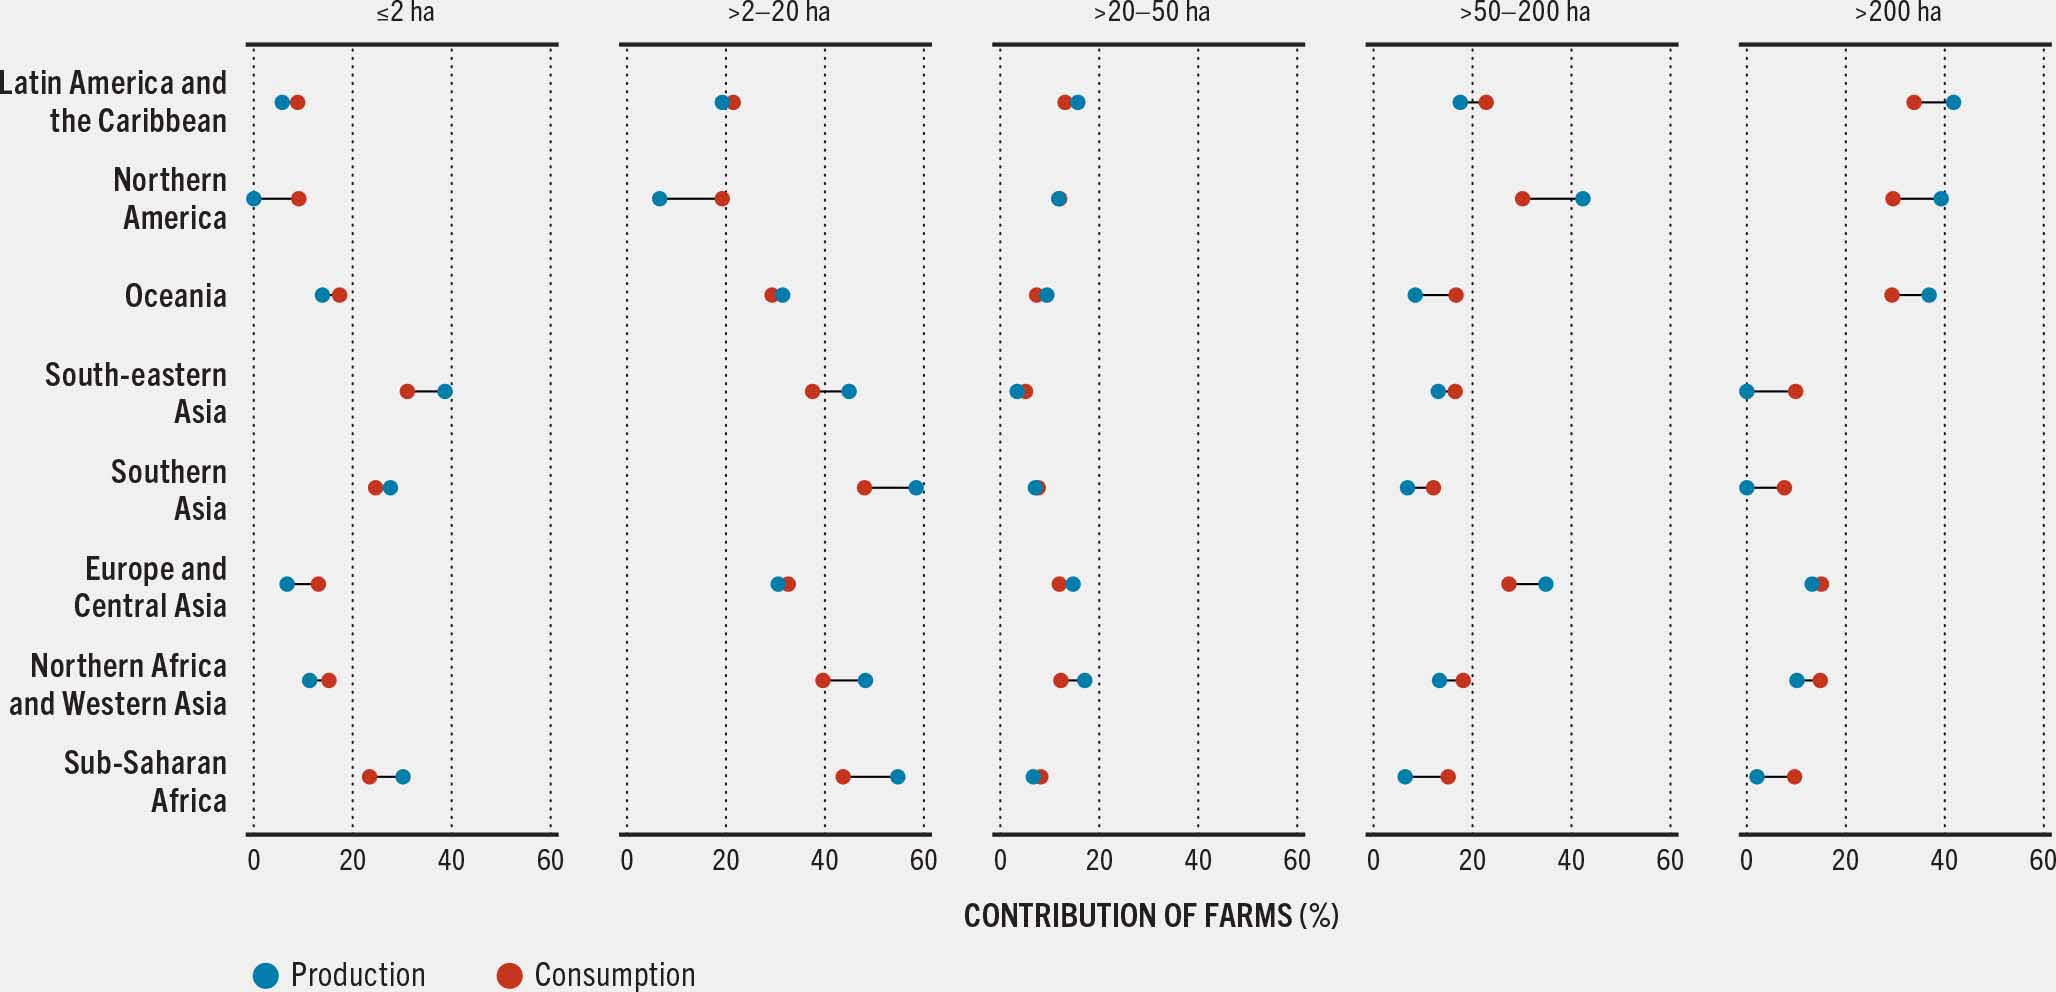
It is important to note that the above figures illustrate the contributions of different farm sizes to the production (i.e. availability) of assessed food and nutrient components, which combine with access, utilization and stability of consumption to determine food security outcomes. Given that agrifood trade increasingly connects producers to consumers living in distant locations – increasing the physical and mental detachment of food from land – the contributions of different farming systems to consumption can differ significantly from their contributions to production. Box 12 highlights how farms of 2–20 ha in several regions make a major contribution to food consumption due to reliance on international trade.
Box 12Food provisioning within a globalized agrifood system
The contribution of small- and large-scale farmers to food provisioning has been the subject of global data collection and modelling efforts.9, 24, 33, 43 Within this context, the importance of farms at different scales tends to be assessed in terms of their contribution to domestic food production in each country. However, this does not accurately reflect their role in food consumption, given countries' reliance on imports from and exports to countries with different farm size structures.
New research combines country sector-specific agricultural production patterns44 with agrifood trade data45 to quantify the global dependencies of nations on farmers across the food supply chains of 200 countries.46 From a consumption perspective (Figure A), farms larger than 2–20 ha make a major contribution to food consumption in several regions, satisfying over 35 percent of food demand in sub-Saharan Africa, Northern Africa and Western Asia and South-eastern Asia. In sub-Saharan Africa and Southern Asia, these farming systems contribute 43 percent and 48 percent, respectively, to regional food needs. In contrast, farms larger than 200 ha contribute more substantially to food consumption in Oceania (29 percent), Latin America (29 percent) and the Caribbean (34 percent). Regional reliance on farmers also varies by food group (Figure A).
FIGURE A CONTRIBUTION OF FARMS TO REGIONAL FOOD CONSUMPTION BY FARM SIZE AND FOOD GROUP
The study also investigates discrepancies between the consumption- and production-related roles of small- and large-scale farms in national food provisioning. The large differences reported highlight their diverse roles in meeting national and transboundary food needs. These patterns are illustrated in Figure B, which presents regional averages of farm contributions to food consumption and production.
FIGURE B AVERAGE CONTRIBUTION OF FARMS TO REGIONAL FOOD PRODUCTION AND CONSUMPTION
SOURCE (text and figures): Adapted from Taherzadeh, O., Cai, H. & Mogollón, J. (forthcoming). The hidden role of small-scale farmers in global food security. Nature Food. https://doi.org/10.31235/osf.io/ajnsk
Farms larger than 200 ha contribute comparatively less to regional consumption than to production in Latin America and the Caribbean (−7 percent), Northern America (−9 percent) and Oceania (−7 percent). In Northern America, overseas dependencies on smaller farms are manifested in demand for pulses, vegetables, and roots and tubers. Conversely, farms of 2 ha or below contribute significantly less to consumption than to production in South-eastern Asia (−7 percent), Southern Asia (−3 percent) and sub-Saharan Africa (−6 percent). In these regions, food consumption is also met by imports of grains and oil crops from farms larger than 50–200 ha.
These findings highlight the need for a global supply chain perspective to better understand the role of farms in regional food provisioning. Continued improvements in the mapping and traceability of output from farms is needed to this end. Further integration of production microdata into global agrifood system models can help assess how small- and large-scale farmers differ in the environmental risks they face – and those they drive – and in their roles in sustainable food transition.
The above results refer to the total amount of land-based agricultural production and not to a measure of productivity. Understanding whether certain farm size segments are inherently more productive than others is critical to the design and targeting of effective policies to meet food security and land degradation neutrality objectives.
The relationship between farm size and productivity has been studied extensively for over 50 years. The question of whether smallholders are more productive than larger farms informs thinking about the role of small farms in the agricultural transformation process, particularly in low- and middle-income countries, where small farms account for a large share of the farming sector.47–49 If small farms are more productive, then they merit supportive policies to increase food production; such support must go beyond welfare and distributional concerns that may also be addressed through smallholder-focused development strategies. However, if small farms are less productive than larger operations, and if returns to scale translate into broader and faster growth eventually benefiting all rural households, then a strategic orientation to support land consolidation may be warranted.
Increased production on a given size of land also has implications for land degradation: on the one hand, it may decrease pressures for agricultural extensification (land sparing); on the other, it may increase land degradation and externalities through unsustainable intensification. Understanding whether productivity differs systematically among farms of different sizes – and the underlying reasons for this variation – is thus a first step in characterizing land degradation pathways that are potentially scale dependent to guide relevant policies.
Box 13 synthesizes the latest knowledge on the relationship between farm size and productivity, known as the inverse farm size productivity relationship (IR). The IR literature tries to unpack the reasons for the longstanding empirical observation that, in many developing countries, smaller farms tend to have higher productivity than larger farms. However, the accumulated evidence challenges this once conventional wisdom. After accounting for the multiple reasons for observing an inverse relationship – for example, scale-dependent market imperfections, measurement error, choice of productivity indicator and methodological issues – no systematic productivity differences have been found to exist across scales. This means that if they had access to the same resources, smallholders would exhibit the same productivity levels as larger farms, based on the use of a broad range of indicators. Nevertheless, most small farms remain constrained by multiple market and institutional failures, leading to large yield gaps that need to be addressed sustainably.
Box 13Revisiting the inverse farm size productivity relationship
The inverse relationship between farm size and productivity – the finding that smaller farms often achieve higher yields per hectare than larger ones – has been a longstanding puzzle in development economics. First identified by Sen (1962), the relationship challenged classical assumptions about economies of scale and shaped decades of policy advocating for smallholder farming, especially in low- and middle-income countries.50, 53
Early studies attributed the inverse relationship to labour supervision advantages: small farms rely on family labour, which is more motivated and better supervised than hired labour.54, 55 These findings led to widespread support for smallholder-oriented development strategies.
In recent years, however, this consensus has been increasingly questioned. Some studies have shown that when medium- and large-scale farms (typically >10–20 ha) are included, the relationship becomes U-shaped or even positive.12, 56, 57 Others point to systematic errors in measuring farm size or production: yields tend to be over-reported on small plots and under-reported on larger ones, skewing the relationship.58–60
Crucially, the inverse relationship often disappears when broader productivity measures are used. While early literature focused on land productivity (i.e. yields), more recent work uses total factor productivity (TFP), which accounts for land, labour, capital and technology. Studies show that using TFP often reveals no inverse relationship – or even reveals a positive relationship – between farm size and productivity.61, 62 A meta-analysis of nearly 1 000 studies further confirms that the inverse relationship is not universal and varies depending on how productivity is measured. Over time, as data quality and methods have improved, evidence for the inverse relationship has become less frequent.63
In summary, while the inverse relationship was long seen as a stylized fact, newer evidence suggests that it is context-specific, shaped by measurement and methodology, and advises caution against using this relationship as a causal link to guide policy.64 This evolving understanding has major implications for agricultural policy, land use planning and strategies to sustainably close yield gaps in different farming systems.
While this body of evidence may appear to challenge the rationale behind strong policy advocacy for smallholder farming in developing countries,50, 51 small farms continue to warrant policy support for reasons beyond purely productivity-based arguments. The market failures that explained the inverse relationship in the early literature still ring true in many instances, disproportionately affecting smallholders. Smallholder agriculture continues to play a vital role and will remain an important source of livelihood and food security for rural households in developing rural economies. Addressing constraints to improving the livelihoods of smallholders, within an inclusive rural transformation framework,52 thus remains essential to achieving both sustainable productivity and land degradation neutrality targets.
Policies and interventions towards these goals would be more effective if based on an understanding of whether and how land degradation pathways differ by farm size. This would have significant impacts on the livelihoods of smallholders, which number around 500 million, as well as on most of the world’s agricultural land, which is managed by large farms. Addressing the challenges to sustainable production across scales without repeating the historical patterns that led to the relationship between human-induced land degradation and yield gaps (documented in Chapter 2 of this report) is critical to meeting the goals of the 2030 Agenda.


