

Developing such an integrated approach hinges upon understanding the broader land degradation processes and incentives that drive them. Although there is no agreement on how to measure all land degradation processes on all biomes, overlaying eight different methods reveals a broad agreement on the extent of global land degradation.91 Globally, LUCC generates most of the ecosystem services lost due to degradation and is mainly driven by conversion of forest land to grazing land in Latin America, grassland to cropland in sub-Saharan Africa, and grassland to barren land in Asia.63
The incentives driving these transitions differ in practice, but at their core lies the fact that private economic incentives do not align with the values of ecosystem services. For example, most farmers facing large yield gaps on their cropland and lacking the ability to restore land quality would not value the ecosystem services lost by converting forest land or grassland into cropland. Indeed, most of the deforestation linked to farming is associated with small-scale farming in Africa and large-scale farming in Latin America and South-eastern Asia.92
If degradation on existing croplands is left to continue over long periods of time, land abandonment can also ensue as part of LUCC. Though abandonment is mostly driven by socioeconomic drivers – as in the case of the vast areas of cropland in Central Asia abandoned after the collapse of the former Soviet Union93 – it is also incentivized by cropland degradation and yield gaps.94 For example, a study in southern Chile found that declining soil quality was a leading driver of cropland abandonment.95 However, a recent study found that lands abandoned since 1992 and considered suitable for recultivation had the potential to feed between 292 million and 476 million people.36
Figure 12 shows the overlap between croplands abandoned from 1992 to 2015 and the latest global cropland layer used in this report. It is evident that cropland abandonment is happening in the vicinity of current croplands. This pattern is particularly visible in areas of intensive agriculture where land degradation was found to cause significant degradation-induced yield losses. When land is abandoned after falling out of productive use, reclaiming and restoring it can be very costly, often requiring government intervention, as in Uzbekistan.96 Consequently, the pressure increases to produce more from existing cropland, highlighting the importance of addressing the degradation–yield gap nexus.
Figure 12 Hotspots of abandoned cropland (1992–2015) and existing cropland (2020)
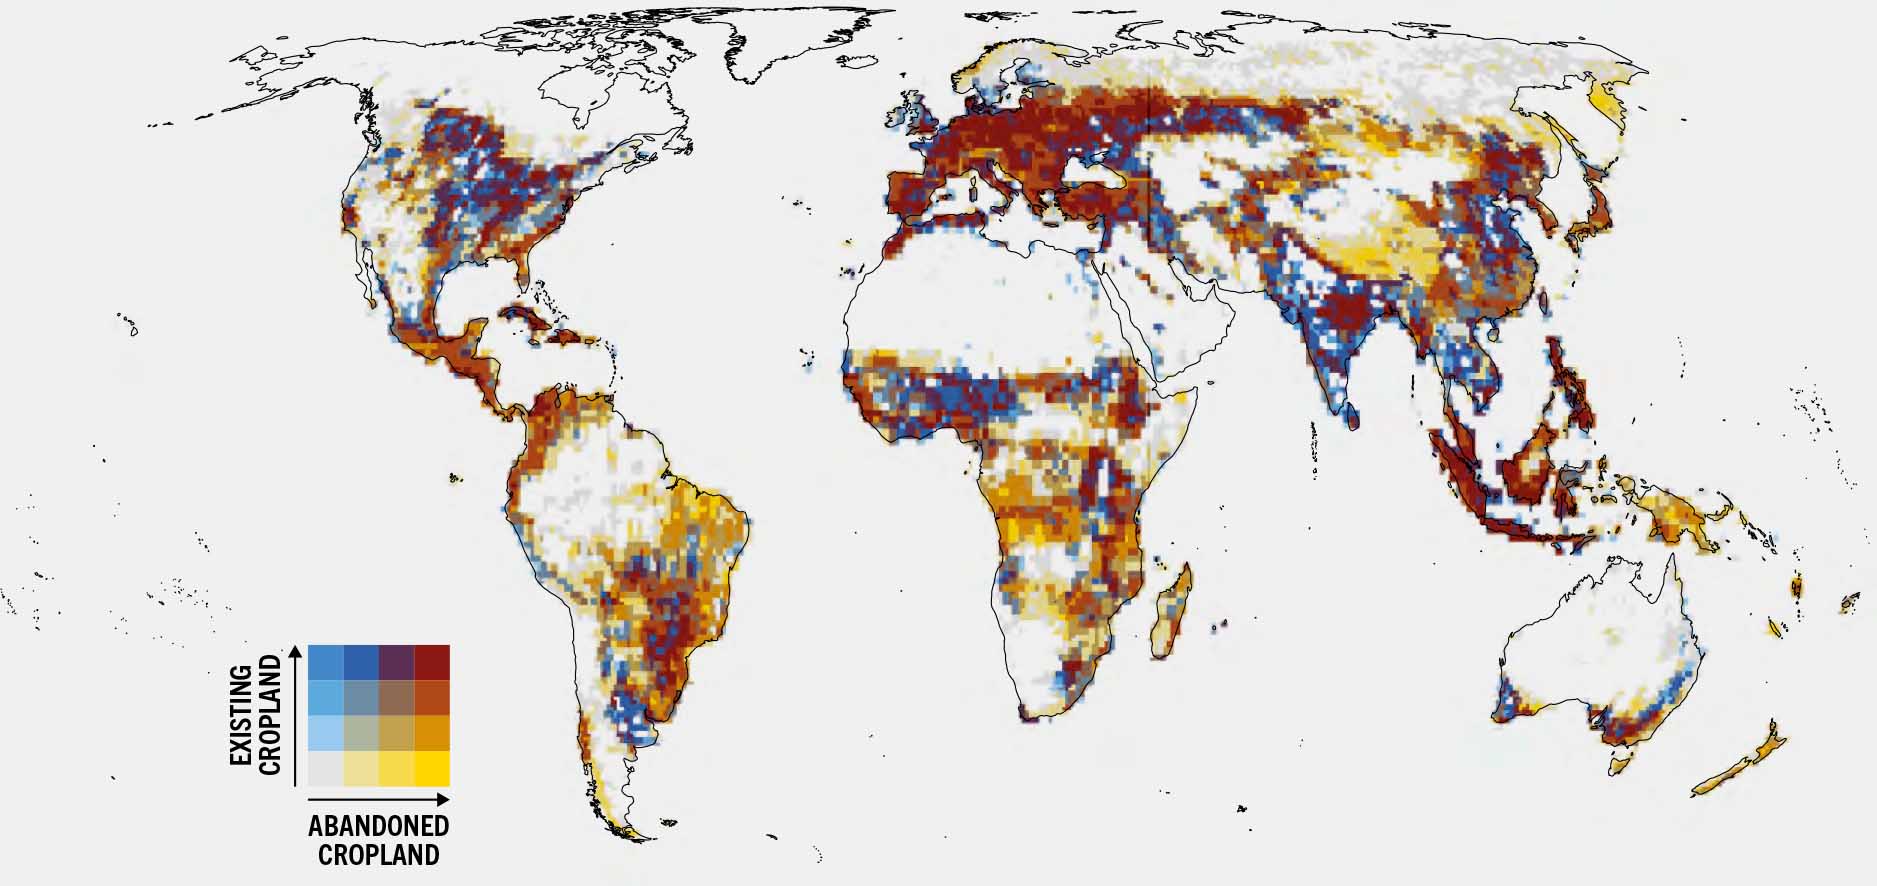
SOURCES: Næss, J.S., Cavalett, O. & Cherubini, F. 2021. The land–energy–water nexus of global bioenergy potentials from abandoned cropland. Nature Sustainability, 4(6): 525–536. https://doi.org/10.1038/s41893-020-00680-5; FAO & IIASA. 2025. Global Agro-Ecological Zones version 5 (GAEZ v5). [Accessed on 20 February 2025]. https://data.apps.fao.org/gaez/?lang=en. Licence: CC-BY-4.0.


