


In the ten years since the 193 Member States of the United Nations endorsed the 2030 Agenda for Sustainable Development, the world has endured a global pandemic and economic downturns as well as a growing number of conflicts and extreme weather events. Last year’s edition of this report presented stubbornly high rates of hunger and food insecurity at levels exceeding those reported for 2015 when the 2030 Agenda was launched. Some progress was reported on key indicators of nutrition, including several that lay the groundwork for children to achieve their full potential for growth and development, but rising rates of obesity foreshadowed major challenges for the health and well-being of all age groups.
This chapter presents an updated global assessment of food insecurity and nutrition up to the year 2024 and a report on progress towards meeting Sustainable Development Goal (SDG) Targets 2.1 and 2.2: ending hunger and ensuring access to safe, nutritious and sufficient food for all people all year round; and eradicating all forms of malnutrition. Updates on food security and nutrition indicators are provided at global, regional and subregional levels, while country-level estimates can be found in Annex 1A.
Section 2.1 presents an updated assessment of the state of food security and progress towards achieving the hunger and food insecurity target (SDG 2.1). It includes updated estimates and discussion of the trends for the two SDG Target 2.1 indicators: SDG Indicator 2.1.1 on the prevalence of undernourishment (PoU) and SDG Indicator 2.1.2 on the prevalence of moderate or severe food insecurity based on the Food Insecurity Experience Scale (FIES). Section 2.2 contributes evidence on economic access to diverse, nutritious foods globally, based on estimates of the cost and affordability of a healthy diet. Section 2.3 focuses on the state of nutrition in the world and progress towards the global nutrition targets defined by the World Health Assembly (WHA) in 2012 and the 2030 Agenda for Sustainable Development (Target 2.2), including a spotlight on a new SDG indicator on dietary diversity.
Every year FAO uses newly available national data to refine, improve and update the estimates of how many people are facing hunger and food insecurity in the world and of the cost and affordability of a healthy diet. In particular, this year’s edition benefited from new national data from the populous country of India which, as it accounts for more than one-sixth of the global population, led to important updates of the estimates of the PoU and of how many people in the world are unable to afford a healthy diet.
2.1 Food security indicators: latest updates and progress towards ending hunger and ensuring food security
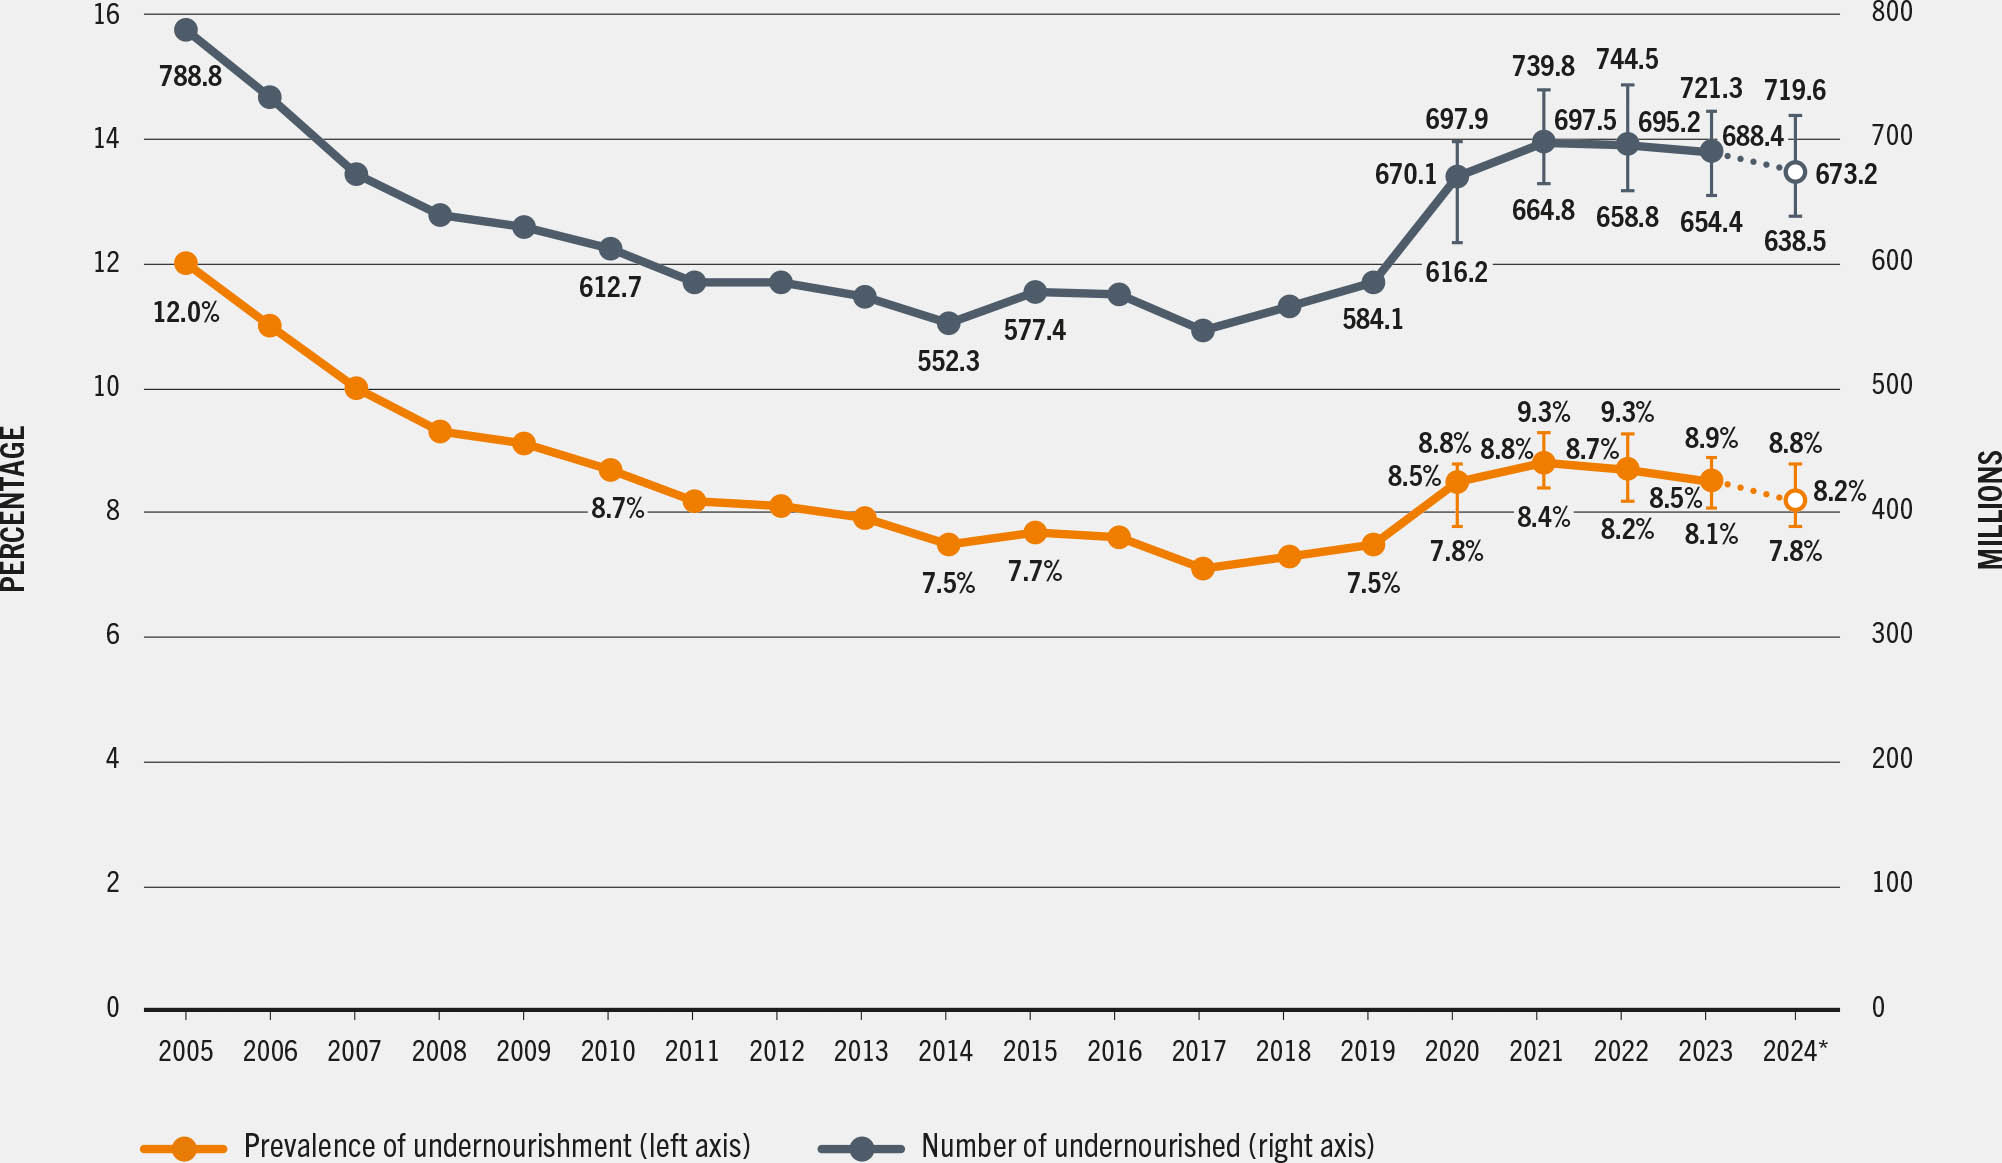
- ➔ Updated global estimates point to signs of a decrease in world hunger in recent years. An estimated 8.2 percent of the global population may have faced hunger in 2024, down from 8.5 percent in 2023 and 8.7 percent in 2022.
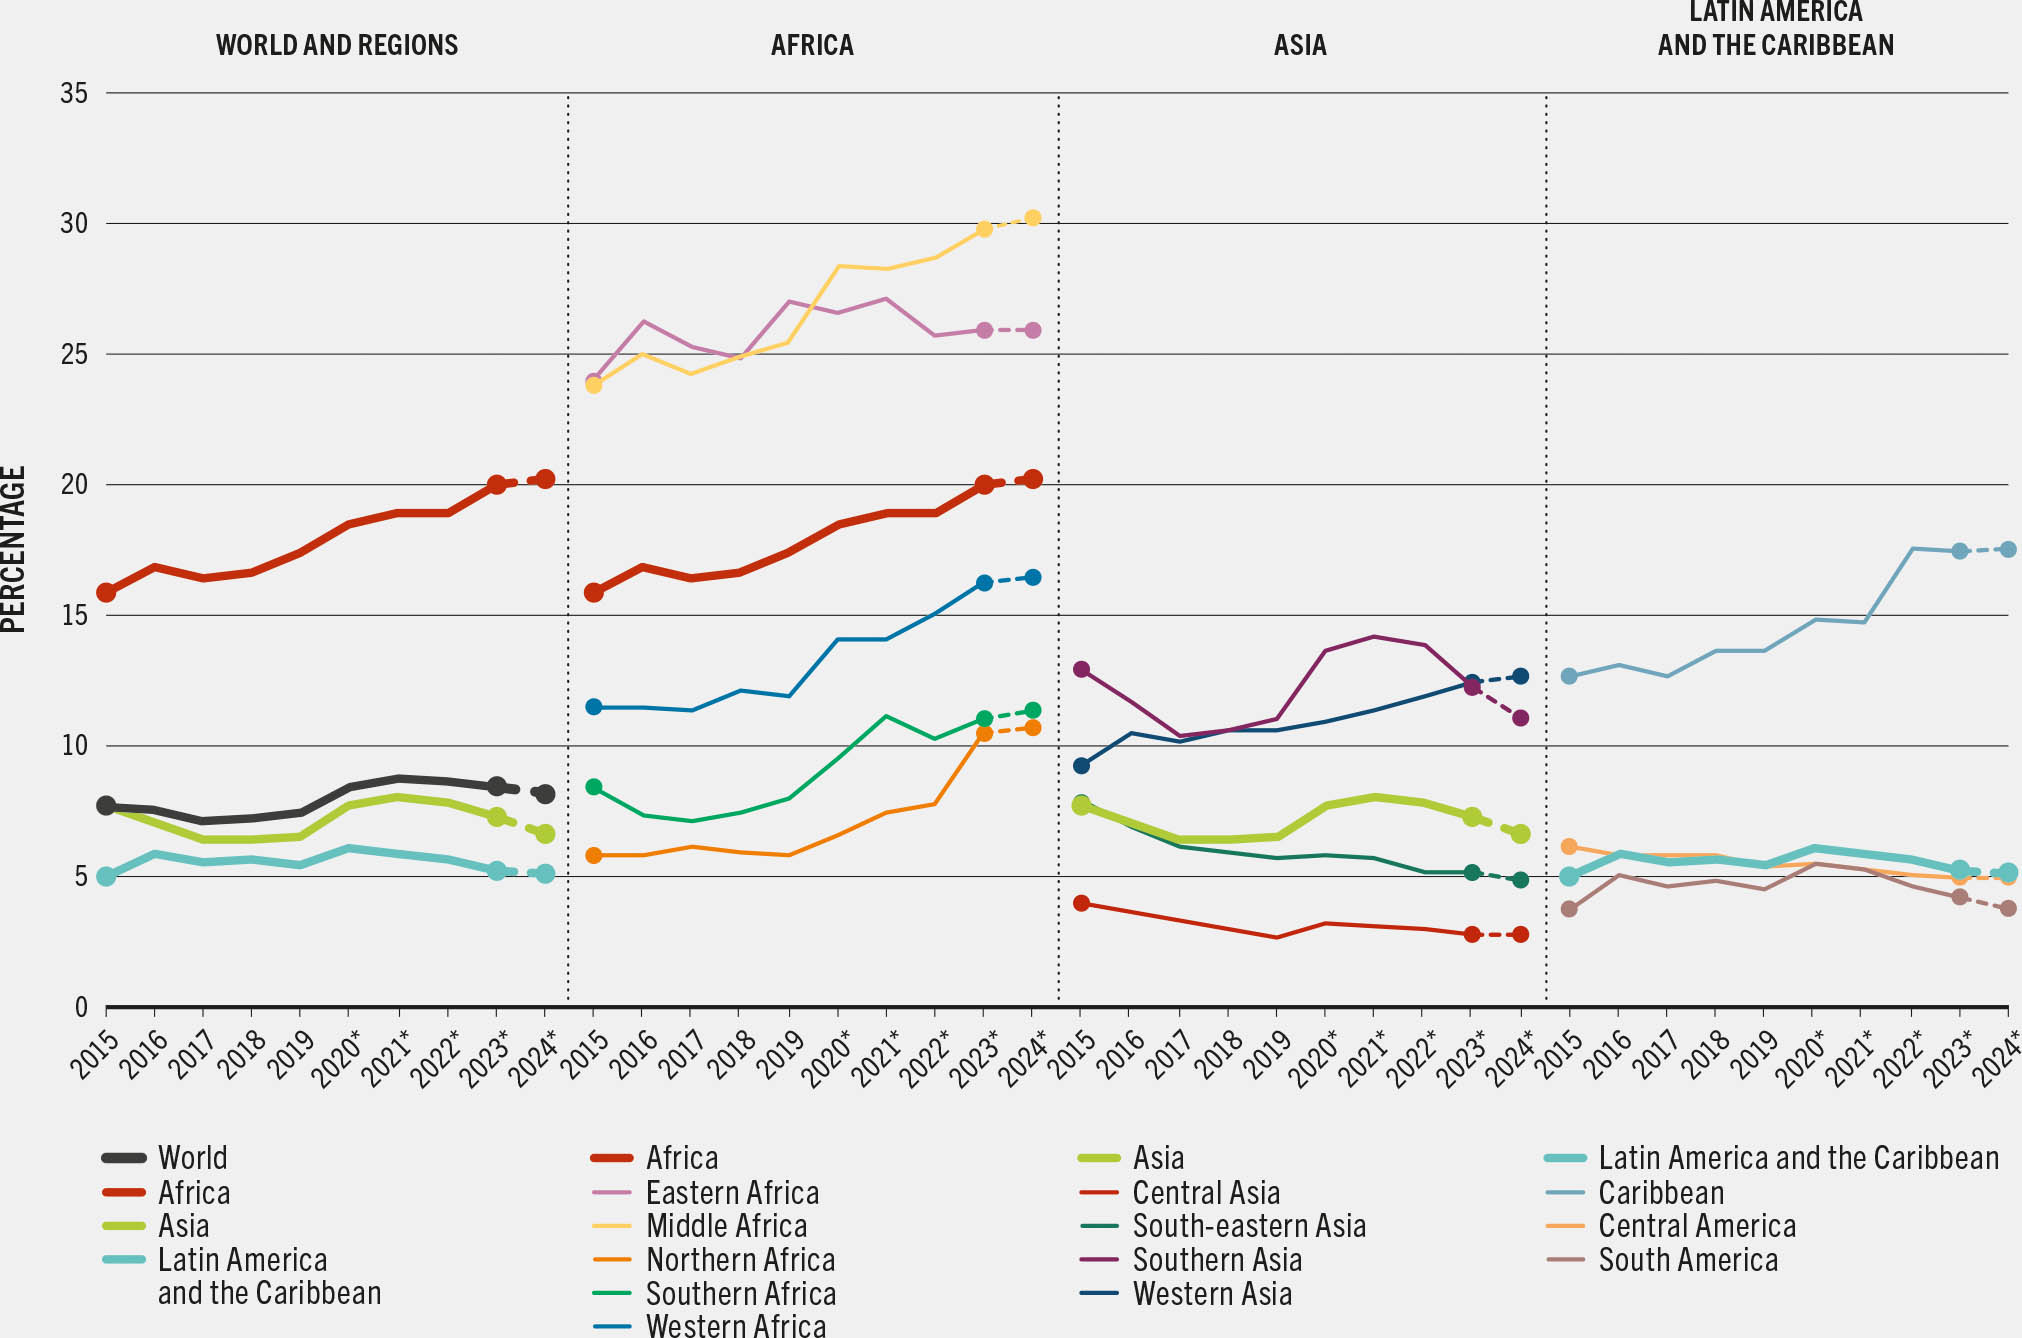
- ➔ The progress seen at the global level is driven by notable improvement in South-eastern Asia and Southern Asia – which reflects new data from India – and in South America. Unfortunately, this positive trend contrasts with the continuing rise in hunger in most subregions of Africa and in Western Asia.
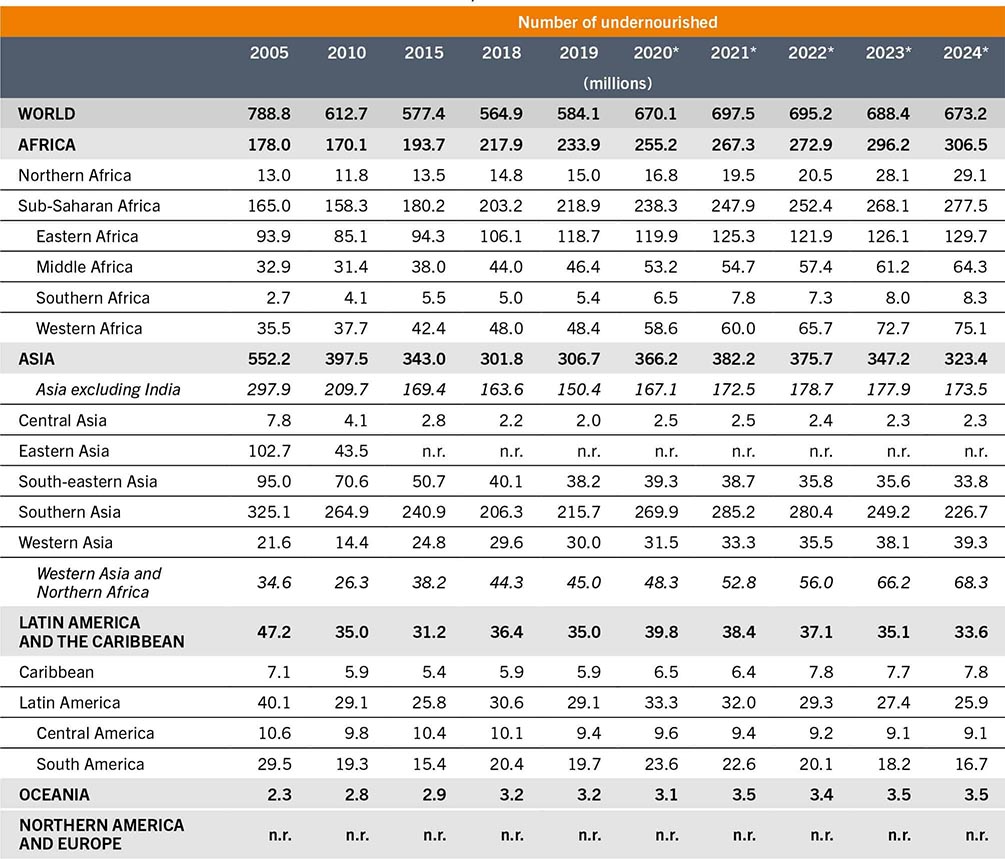
- ➔ It is estimated that between 638 and 720 million people, corresponding to 7.8 and 8.8 percent of the global population, respectively, faced hunger in 2024. Considering the point estimate (673 million in 2024), this indicates a decrease of 15 million people compared to 2023 and 22 million compared to 2022.
- ➔ In 2024, hunger affected about 307 million people in Africa, 323 million in Asia and 34 million in Latin America and the Caribbean – 20.2, 6.7 and 5.1 percent of the population, respectively.
- ➔ From 2025 to 2030, the global number of undernourished is expected to decrease, but 512 million people are still projected to be facing hunger in 2030, of whom nearly 60 percent will be in Africa.
- ➔ At the global level, the prevalence of food insecurity has declined gradually since 2021, the year when trends began to show signs of improvement following the sharp increase in the wake of the COVID-19 pandemic. The global prevalence of moderate or severe food insecurity decreased marginally from 28.4 percent in 2023 to 28.0 percent in 2024.
- ➔ About 2.3 billion people in the world are estimated to have been moderately or severely food insecure in 2024 – 335 million more than in 2019, before the pandemic, and 683 million more than in 2015 when the 2030 Agenda for Sustainable Development was launched.
- ➔ Trends at the regional level differ notably, with food insecurity on the rise in Africa, falling in Latin America and the Caribbean, and decreasing gradually in Asia for several consecutive years, while in Oceania and in Northern America and Europe, new estimates point to a slight decline from 2023 to 2024 following a several-year rise.
- ➔ Globally and in every region of the world except Northern America and Europe, the prevalence of moderate or severe food insecurity is higher in rural areas than in urban areas, while the relative situation in peri-urban areas differs among regions. From 2022 to 2024, food insecurity improved only in urban areas at the global level and in Asia. Improvements were distributed more equally across rural, peri-urban and urban areas in Latin America and the Caribbean, while in Africa, food insecurity worsened in both rural and urban areas and remained virtually unchanged in peri-urban areas.
- ➔ The gender gap narrowed at the global level from 2021 to 2023 but increased slightly in 2024, with the prevalence of food insecurity remaining consistently higher among women than among men, globally and in all regions.
2.1.1 SDG Indicator 2.1.1 Prevalence of undernourishment
FAO has produced estimates of the prevalence of undernourishment (PoU) since 1975 to capture the proportion of the population in each country who, on a regular basis, consume food in amounts that are insufficient to provide the energy required for a normal, active and healthy life. These figures have been used to report on the extent of world hunger since 1977. They serve as an indicator to monitor progress towards the goals agreed to at the World Food Summit in 1996, the Millennium Development Goals established in 1999, and finally SDG 2 of the 2030 Agenda for Sustainable Development, launched in 2015.
The latest assessment of world hunger, measured by the PoU (SDG Indicator 2.1.1), reveals signs of improvement in recent years. The level of PoU had begun to rise slowly in 2017 and then increased sharply in 2020 and 2021 in the wake of the COVID-19 pandemic. However, the latest assessment, which benefited from important data updates from various countries, in particular the populous country of India (see Box 2.1), points to encouraging progress from 2022 to 2024. An estimated 8.2 percent of the global population may have faced hunger in 2024, down from 8.5 percent in 2023 and 8.7 percent in 2022. It is estimated that between 638 and 720 million people (7.8 to 8.8 percent of the global population) faced hunger in 2024.a Considering the point estimate (673 million), this indicates a decrease of 15 million people compared to 2023 and 22 million compared to 2022.
BOX 2.1Updates in the series of prevalence of undernourishment estimates
As in every new edition of this report, the series of estimates of the prevalence of undernourishment (PoU) have been fully updated. The new, complete series are available through FAOSTAT, FAO’s corporate statistical database.1
In addition to the new data points added every year (i.e. for 2024 in this edition), the new series differ from those published previously due to revisions that cover the entire monitored period. Thorough revisions of the series are needed when FAO receives new or updated data and information after publication of the previous edition. As some of these data and information cover past years, the revisions lead to improved estimates of key parameters used to estimate the PoU also for earlier years. For this reason, readers are urged to avoid comparing figures published in different editions of the report.
ROUTINE UPDATES INDUCED BY NEW DATA*
New data on food supply
As with every cycle of data revisions in preparation for the new edition of this report, an important adjustment consists in updating the average per capita dietary energy supply (DES) used to compute the PoU. Countries provide new data on production, trade and utilization of food commodities not only for the previous year, but often for the past several years. This adjustment can affect all years for which new data are received. However, the adjustment is especially important for the preceding year (in this case, the values published for 2023 in the 2024 edition of this report), because those estimates are always computed as “nowcasts” based on projections of food supply from major commodities provided by the Markets and Trade Division of FAO (see Supplementary material to Chapter 2 ). The DES values used for 2023 in this edition of the report are now fully derived from the newly compiled food balance sheets (FBS), which rely on official data provided to FAO by countries through the annual Production and Utilization Questionnaire. This new evidence reveals that, for many countries, nowcasts of food supply in 2023 had been overly pessimistic. Actual data indicating greater availability of food (together with other evidence noted below) contributed to a revision of the trend, which now points to a reduction in the number of undernourished people from 2022 to 2023 rather than no change, as had been previously reported.
New data on population estimates
In this edition, major revisions were induced by the need to reflect new estimates of the population size and structure for all countries published in the World Population Prospects 2024,2 released on 11 June 2024 (after the deadline for consideration in the previous report).
The revision of a country’s population size has various implications for the estimates of the PoU and of the number of undernourished (NoU). First, the estimate of the total DES in the country needs to be reassessed in view of the new population size. Second, the estimated PoU for the country is multiplied by the revised population size to compute the NoU, which may therefore differ from previously reported values.
Related to the first point, when population estimates undergo substantial revision – as was the case for several countries** in this edition – a thorough review and recompilation of the supply utilization account/food balance sheet (SUA/FBS) series is necessary, as the simple adjustment of the DES to the new estimates of the population size would result in unrealistically low or high per capita values. Such a review and recompilation were completed for most countries (see Supplementary material to Chapter 2).
New data from food consumption surveys
Another set of revisions was induced by new data on food consumption from large-scale household surveys and supporting information that became available to FAO after the closing of the previous edition of the report. The analysis of these data led to new values of the coefficient of variation (CV) of dietary energy consumption (DEC) in the population for several countries. This revision involved the analysis of the information contained in 25 household surveys from 14 different countries.***
Of particular relevance for the global series of undernourishment is the impact of the revised assessment of food consumption inequality in India, based on a thorough re-analysis of the data contained in the recent, back-to-back, household consumption and expenditure surveys (HCES) conducted by the Ministry of Statistics and Program Implementation from August 2022 through July 2024.
An initial assessment of the impact of the HCES 2022/23 data had already been reflected in the PoU series published in last year’s edition of the report. New household consumption data collected over most of 2024, however, point to a reduction in inequality in food access, which leads to a new value for the CV – and hence the PoU – for India in the three-year period 2022 to 2024. Given the size of the Indian population, the impact of the update can also be clearly noted in the global series of PoU in 2023, estimated to be closer to the lower bound published in last year’s edition of the report, with a downward trend from 2022 to 2024.
INNOVATIONS IN REPRESENTING UNCERTAINTY AROUND GLOBAL HUNGER FIGURES
To better reflect the level of uncertainty that inevitably accompanies FAO estimates of undernourishment, special attention has been devoted this year to the computation of the upper and lower bounds around the point estimates of the PoU and the NoU (represented by the bars in Figure 2.1), which were introduced for the first time with the 2021 edition of the report. The new approach now considers three independent sources of uncertainty, two of which had not been explicitly considered before.
First, as in previous editions of the report since 2021, the lack of recent household surveys induces persistent uncertainty around estimates of the CV for many countries. For all countries for which the most recent consumption survey dates back to 2020 or earlier, rather than keeping the value of the CV constant at the level estimated from the last survey data, it is nowcasted following signals provided by Food Insecurity Experience Scale (FIES) data collected in recent years in those countries, following the approach used in previous editions of the report (see Supplementary material to Chapter 2). As the number of countries conducting household surveys increases, this element of uncertainty around the PoU gradually decreases.
Second, to reflect the uncertainty induced by the need to nowcast the DES given the absence of official data on actual production and trade of major food commodities, a new element has been added in the estimation of the upper and lower bounds around the point estimates of the PoU for 2024. In addition to the normal “nowcasting” based on evidence from FAO’s Food Outlook reports,3 an additional scenario is considered for each country of unchanged per capita food supply. This results in two possible levels of per capita DES for each country, which are used to compute the upper and lower bounds of the point estimates for regional and global PoU for 2024 (see Supplementary material to Chapter 2 for further details).
Third, the uncertainty regarding the amount of food waste occurring at the retail and household levels (which explains the difference between average levels of dietary energy supply and dietary energy consumption) is taken into account. A 10 percent margin of error around the waste factor coefficient is considered when computing the upper and lower bounds of the PoU for each country.
Notwithstanding the progress in recent years, the global estimates for 2024 are still far above pre-pandemic levels and even further above 2015 levels, when the 2030 Agenda was launched (Figure 2.1). About 96 million more people in the world are estimated to have been facing chronic hunger in 2024 compared to 2015.
FIGURE 2.1 Updated global estimates point to a decrease in world hunger in recent years following the sharp increase from 2019 to 2021
SOURCE: FAO. 2025. FAOSTAT: Suite of Food Security Indicators. [Accessed on 28 July 2025]. https://www.fao.org/faostat/en/#data/FS. Licence: CC-BY-4.0.
The differences among the regions of the world are stark. The progress seen at the global level is driven by notable improvement in South-eastern Asia, Southern Asia – which mainly reflects the impact of new data from India – and Latin America. Unfortunately, this positive trend contrasts with the continuing rise in hunger in most subregions of Africa and in Western Asia (Figure 2.2).
FIGURE 2.2 Progress was made towards reducing hunger in South-eastern and Southern Asia and in SOUTH America, but hunger continues to climb in most subregions of Africa and in Western Asia
SOURCE: FAO. 2025. FAOSTAT: Suite of Food Security Indicators. [Accessed on 28 July 2025]. https://www.fao.org/faostat/en/#data/FS. Licence: CC-BY-4.0.
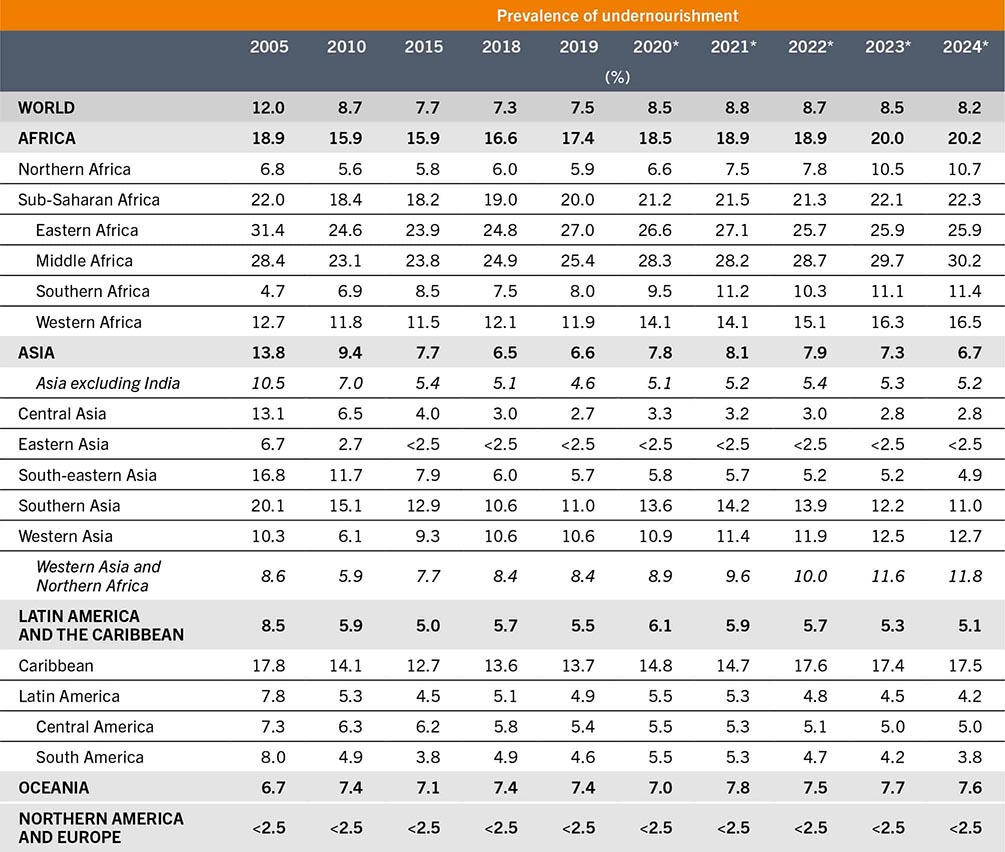
The PoU in Africa surpassed 20 percent in 2024. It is estimated that more than one in five people living in Africa are facing chronic hunger, equivalent to nearly 307 million people (Table 2.1 and Table 2.2). Hunger is on the rise in all subregions except Eastern Africa, with the most notable increases in Middle Africa, which had the highest PoU in Africa and the world in 2024 (30.2 percent), and in Northern Africa, where the PoU increased from 7.8 percent in 2022 to 10.7 percent in 2024. The PoU also continued to rise in Southern Africa and Western Africa in this period, although at a slower pace, reaching 11.4 and 16.5 percent, respectively. The number of people facing chronic undernourishment in Africa has increased by 113 million since 2015, when the 2030 Agenda was launched.
TABLE 2.1Prevalence of undernourishment, 2005–2024
SOURCE: FAO. 2025. FAOSTAT: Suite of Food Security Indicators. [Accessed on 28 July 2025]. https://www.fao.org/faostat/en/#data/FS. Licence: CC-BY-4.0.
TABLE 2.2Number of undernourished people, 2005–2024
SOURCE: FAO. 2025. FAOSTAT: Suite of Food Security Indicators. [Accessed on 28 July 2025]. https://www.fao.org/faostat/en/#data/FS. Licence: CC-BY-4.0.
The most progress towards reducing hunger in recent years has been made in Asia, driven by the above-mentioned notable decrease in Southern Asia, which includes India. The PoU in Asia decreased from 7.9 percent in 2022 to 7.3 percent in 2023, and further to 6.7 percent (323 million people) in 2024 – a decrease of 52 million people in two years. The PoU of Southern Asia decreased from 13.9 to 11.0 percent in the same period. However, it is important to note that progress in Asia is due to improvements in many countries, as the PoU for Asia excluding India also showed a slight decline from 2022 to 2024 (Table 2.1). Some progress was also made in South-eastern Asia, where the PoU had been gradually declining for several years and reached 4.9 percent in 2024. No change occurred from 2023 to 2024 in Central Asia, which has the lowest PoU in the region (2.8 percent) except for Eastern Asia, where the PoU has remained below 2.5 percent since 2015. On the other hand, the situation is very different in Western Asia, which is the only subregion in Asia where chronic undernourishment has been steadily on the rise since 2015, reaching 12.7 percent in 2024. It is important to note that this subregion includes some of the countries most affected by persisting crises and for which lack of solid data poses a challenge for estimating the PoU. Assessments of acute food insecurity can provide important insights into the situation in these countries (see Box 2.2).
BOX 2.2Deepening humanitarian crises increase acute food insecurity and threaten the right to adequate food in many places in the world
During the preparation of this edition of The State of Food Security and Nutrition in the World, deepening humanitarian crises continued to seriously erode food security and the realization of the right to adequate food in many countries. To inform decision-makers about this evolving situation, the 2025 Global Report on Food Crises4 details the acute food insecurity in a set of countries that are currently exposed to food crisis situations. Both The State of Food Security and Nutrition in the World and the Global Report on Food Crises are multipartnership efforts that provide complementary international analyses of food security, but readers should be aware of their different objectives and geographical scope, as well as their reliance on distinctly different data and methodologies for their analyses.
The focus of the Global Report on Food Crises is on acute food insecurity, which refers to any manifestation of food insecurity at a specific point in time that is of a severity that threatens lives, livelihoods or both, regardless of the causes, context or duration. Analyses of acute food insecurity reported in the Global Report on Food Crises are based mainly on the Integrated Food Security Phase Classification/Cadre Harmonisé (IPC/CH). Since timeliness is of the essence in crisis situations, IPC/CH rapid assessments are conducted by local teams of analysts through a consultative process among the main food security partners in the country, including government counterparts, aimed at finding convergence among all pieces of sometimes partial available evidence, including data from official and non-official sources commonly collected and used by the international humanitarian community and that differ considerably from those that inform the Sustainable Development Goal (SDG) indicators.5
The State of Food Security and Nutrition in the World, on the other hand, has the broad objective of monitoring chronic food insecurity – defined as food insecurity that persists over time, largely due to structural causes – in all countries, on a regular basis as needed for SDG monitoring. Chronic food insecurity also includes less severe forms of food insecurity that do not necessarily threaten lives or livelihoods but that persist over time and can negatively affect people’s well-being and the long-term development of communities and countries. The chronic inability to access food is monitored using indicators such as the prevalence of undernourishment and those based on the Food Insecurity Experience Scale, which are collected through nationally representative surveys and designed to ensure global comparability over time.
The geographical scope of the two reports is also different. While The State of Food Security and Nutrition in the World provides a global overview of chronic food insecurity trends, covering all countries and regions of the world, the Global Report on Food Crises is crisis-focused and context-specific. In 2025, the Global Report on Food Crises covered 53 countries and territories experiencing food crises, where acute food insecurity is most severe and widespread. As such, while The State of Food Security and Nutrition in the World presents a global picture, the Global Report on Food Crises provides a targeted analysis of acute food insecurity in the world’s most crisis-affected contexts.
The different messaging – improvement in chronic food insecurity at the global level reported in this edition of The State of Food Security and Nutrition in the World, versus the continued rise in acute food insecurity in crisis-affected countries highlighted by the Global Report on Food Crises 2025 – is therefore not a contradiction, but a reflection of these different objectives, scopes and data coverage. While global indicators, in the aggregate, may show modest recovery, many specific countries remain engulfed in emergencies where acute hunger continues to deepen and where urgent humanitarian response is most needed. These are also countries where recent data of the kind typically used to inform SDG indicators are missing and for which the estimates of current trends of chronic food insecurity may be less reliable. Understanding this distinction is essential for interpreting the data and using both reports effectively to guide long-term development strategies and short-term humanitarian response.
According to the Global Report on Food Crises 2025, around 295 million people faced high levels of acute food insecurity (IPC/CH 3+) in the 53 food-crisis countries and territories that were included in the analysis in 2024. Of these, more than 35 million were in IPC Phase 4 (Emergency) and almost 2 million in IPC Phase 5 (Catastrophe).* The five countries with the largest numbers of people facing high levels of acute food insecurity were, in descending order, Nigeria, the Sudan, the Democratic Republic of the Congo, Bangladesh and Ethiopia, while the countries with the largest share of the analysed population facing high levels of acute food insecurity were Palestine (Gaza Strip), South Sudan, the Sudan, Yemen and Haiti. One hundred percent of the population of the Gaza Strip faced high levels of acute food insecurity, as did more than half of the people living in South Sudan and the Sudan, and nearly half the population of Yemen and Haiti.
Almost 2 million people in five countries and territories** were estimated or projected to be facing Catastrophe (IPC/CH Phase 5) levels of acute food insecurity in 2024, more than half of them (1 106 900) in the Gaza Strip. This figure was nearly twice the 576 600 people estimated to be in this phase at the end of 2023 – a number that was already the highest ever recorded in any country or territory in IPC history.
These are some of the most serious humanitarian crises in the world that are posing daunting challenges for the realization of the right to adequate food. Humanitarian aid, including in the form of emergency agriculture, nutrition and food assistance, is urgently needed, together with an end to the hostilities, access to populations in need, and rebuilding of essential infrastructure and institutions crucial for guaranteeing people’s livelihoods and access to basic necessities. The seeds of future peace, food security and shared prosperity must be planted today.
Progress towards the Zero Hunger target was also made in Latin America and the Caribbean, where the latest estimates show the PoU decreasing to 5.1 percent in 2024 after peaking at 6.1 percent in 2020. There was no improvement in the Caribbean, where for the last three years, around 17.5 percent of the population may have faced hunger. This period of stagnation followed a sharp increase in 2022, such that the PoU in the Caribbean in 2024 was more than three times the regional average. South America, on the other hand, has made progress for several consecutive years, with a steady decline in the PoU from 5.5 percent in 2020 to 3.8 percent in 2024. No change occurred in Central America from 2023 to 2024 following a period of gradual improvement during the previous three years. In 2024, an estimated 7.8 million people in the Caribbean, 9.1 million in Central America and 16.7 million in South America faced chronic hunger.
The PoU has changed little in recent years in Oceania, where 7.6 percent of the population was estimated to be chronically undernourished in 2024.
When considering these results, it is also important to keep in mind the deteriorating food insecurity situation in countries affected by evolving humanitarian crises, which may not be fully reflected in the PoU nowcast for 2024 (see Box 2.2).
Towards ending hunger (SDG Target 2.1): projections to 2030
As in previous editions of this report, an exercise was conducted to project how many people may be facing hunger in 2030 based on what can be inferred from available forecasts of fundamental demographics, agricultural productivity and economic variables, in particular macroeconomic forecasts. The projections were obtained by jointly projecting each of the parameters that inform the model used to estimate the PoU (see Supplementary material to Chapter 2).
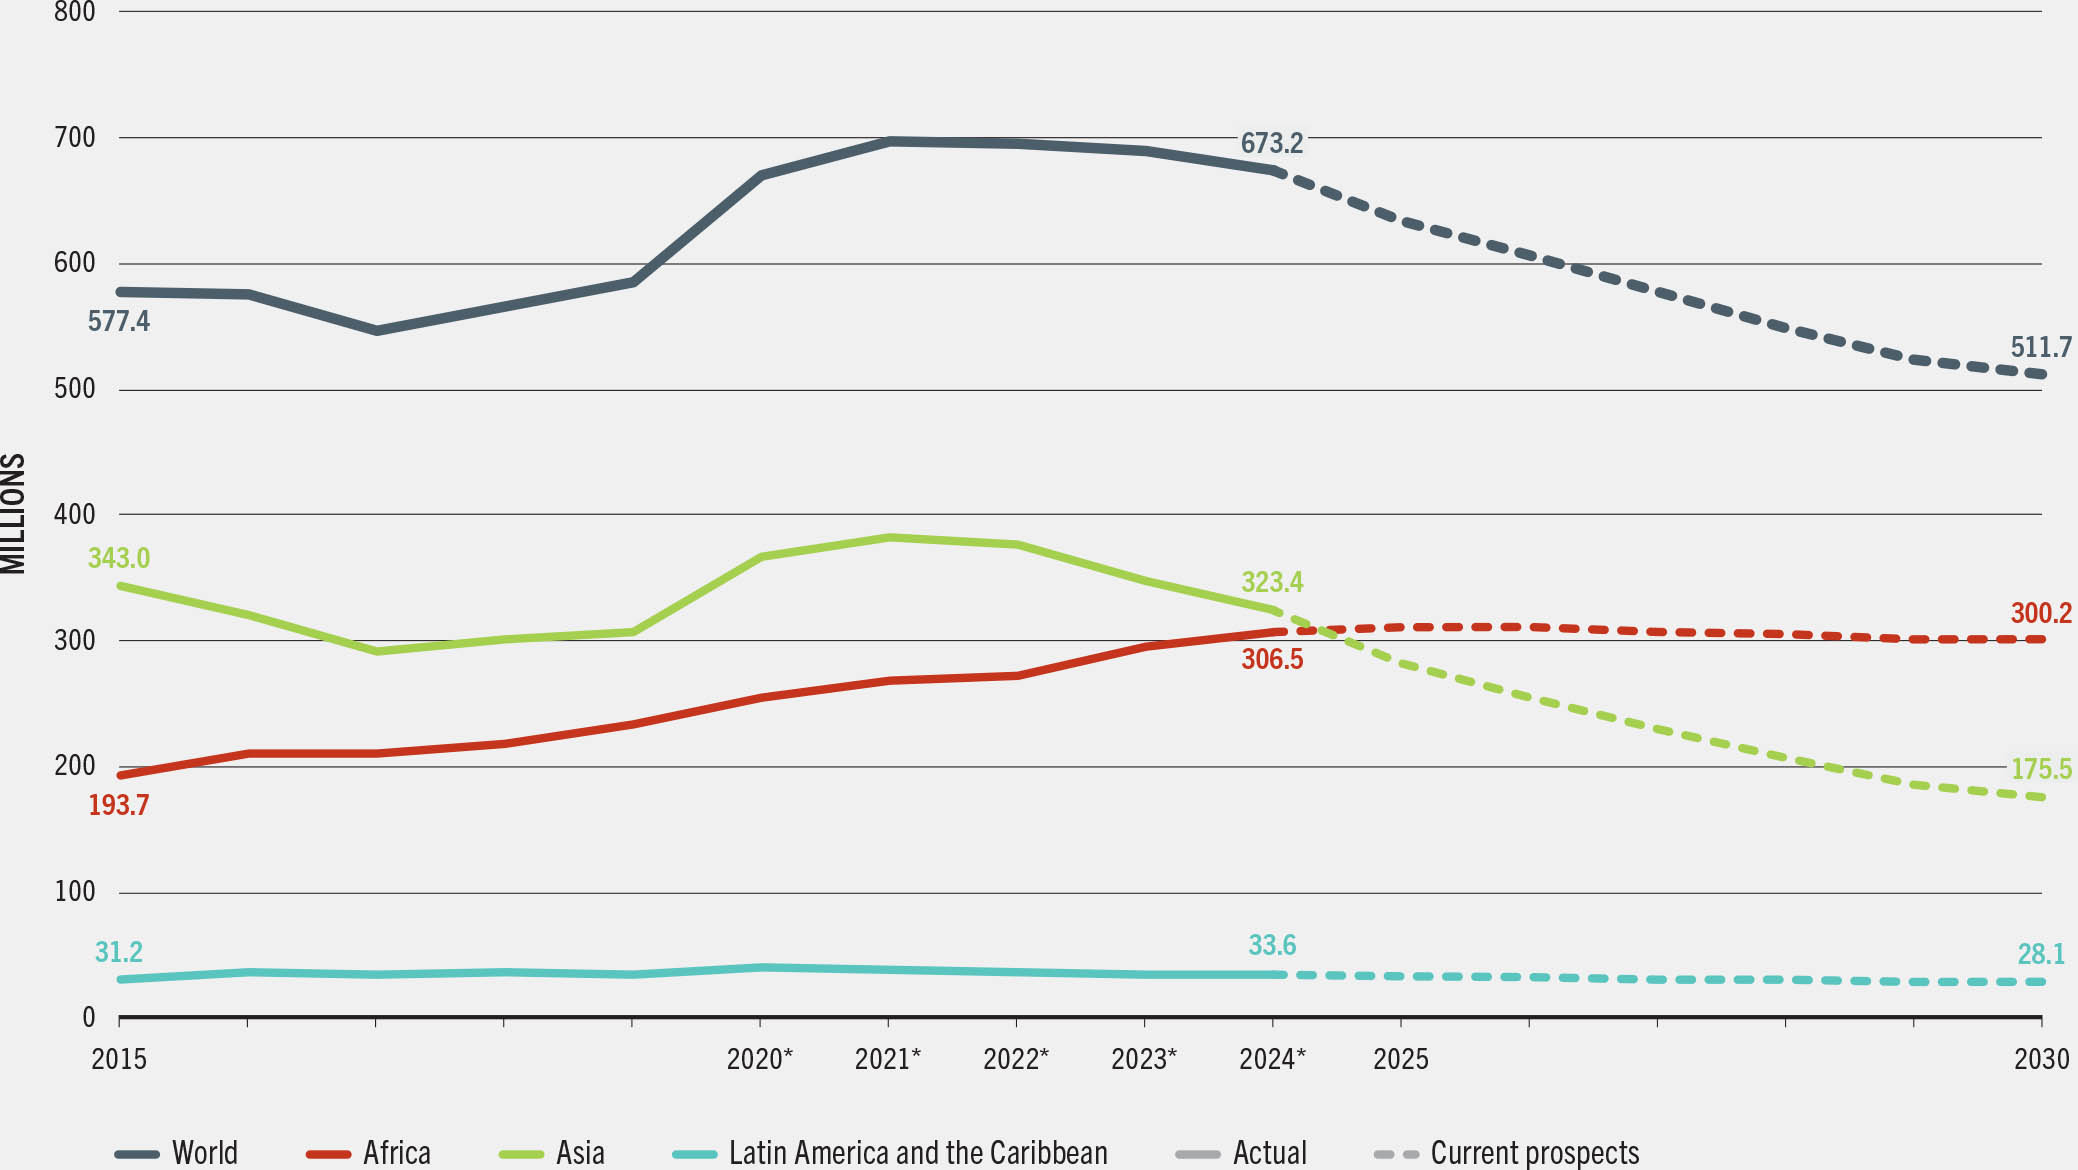
Trajectories showing “current prospects”, which aim to capture current projections to 2030, are based on the April 2025 edition of the International Monetary Fund World Economic Outlook database.7 According to the current projection, 512 million people, or 6 percent of the global population, may be chronically undernourished in 2030, highlighting the immense challenge of achieving SDG 2 (Zero Hunger) (Figure 2.3). It is projected that by 2030, the number of undernourished people will have fallen by only 65 million – from 577 million to 512 million – since the 2030 Agenda was launched in 2015.
FIGURE 2.3 Eliminating hunger by 2030 remains an elusive target
SOURCE: Authors’ (FAO) own elaboration.
While improvements are expected in all regions over the next five years, significant differences remain (Figure 2.3). By 2030, 60 percent of the undernourished people in the world will be in Africa, where 17.6 percent of the population will be facing chronic hunger. In Asia, as well as in Latin America and the Caribbean, the prevalence of undernourishment will fall below 5 percent.
2.1.2 SDG Indicator 2.1.2 Prevalence of moderate or severe food insecurity in the population, based on the Food Insecurity Experience Scale
SDG Indicator 2.1.2 – the prevalence of moderate or severe food insecurity in the population, based on the Food Insecurity Experience Scale (FIES) – was introduced in the SDG global monitoring framework with the specific aim of tracking progress towards the broader goal outlined in SDG Target 2.1 of ensuring access for all people to safe, nutritious and sufficient food all year round. Improvement in this indicator is a positive sign of progress towards the realization of the right to food.
People experiencing moderate food insecurity are uncertain about their ability to obtain adequate food and have been forced to decrease the quality and/or quantity of food they consume. Those facing severe food insecurity have typically run out of food at times during the year and, at worst, have gone an entire day or more without eating. Although obtained using very different methodologies and sources of data, both the prevalence of severe food insecurity and the prevalence of undernourishment are indicators of severe constraints on access to food.
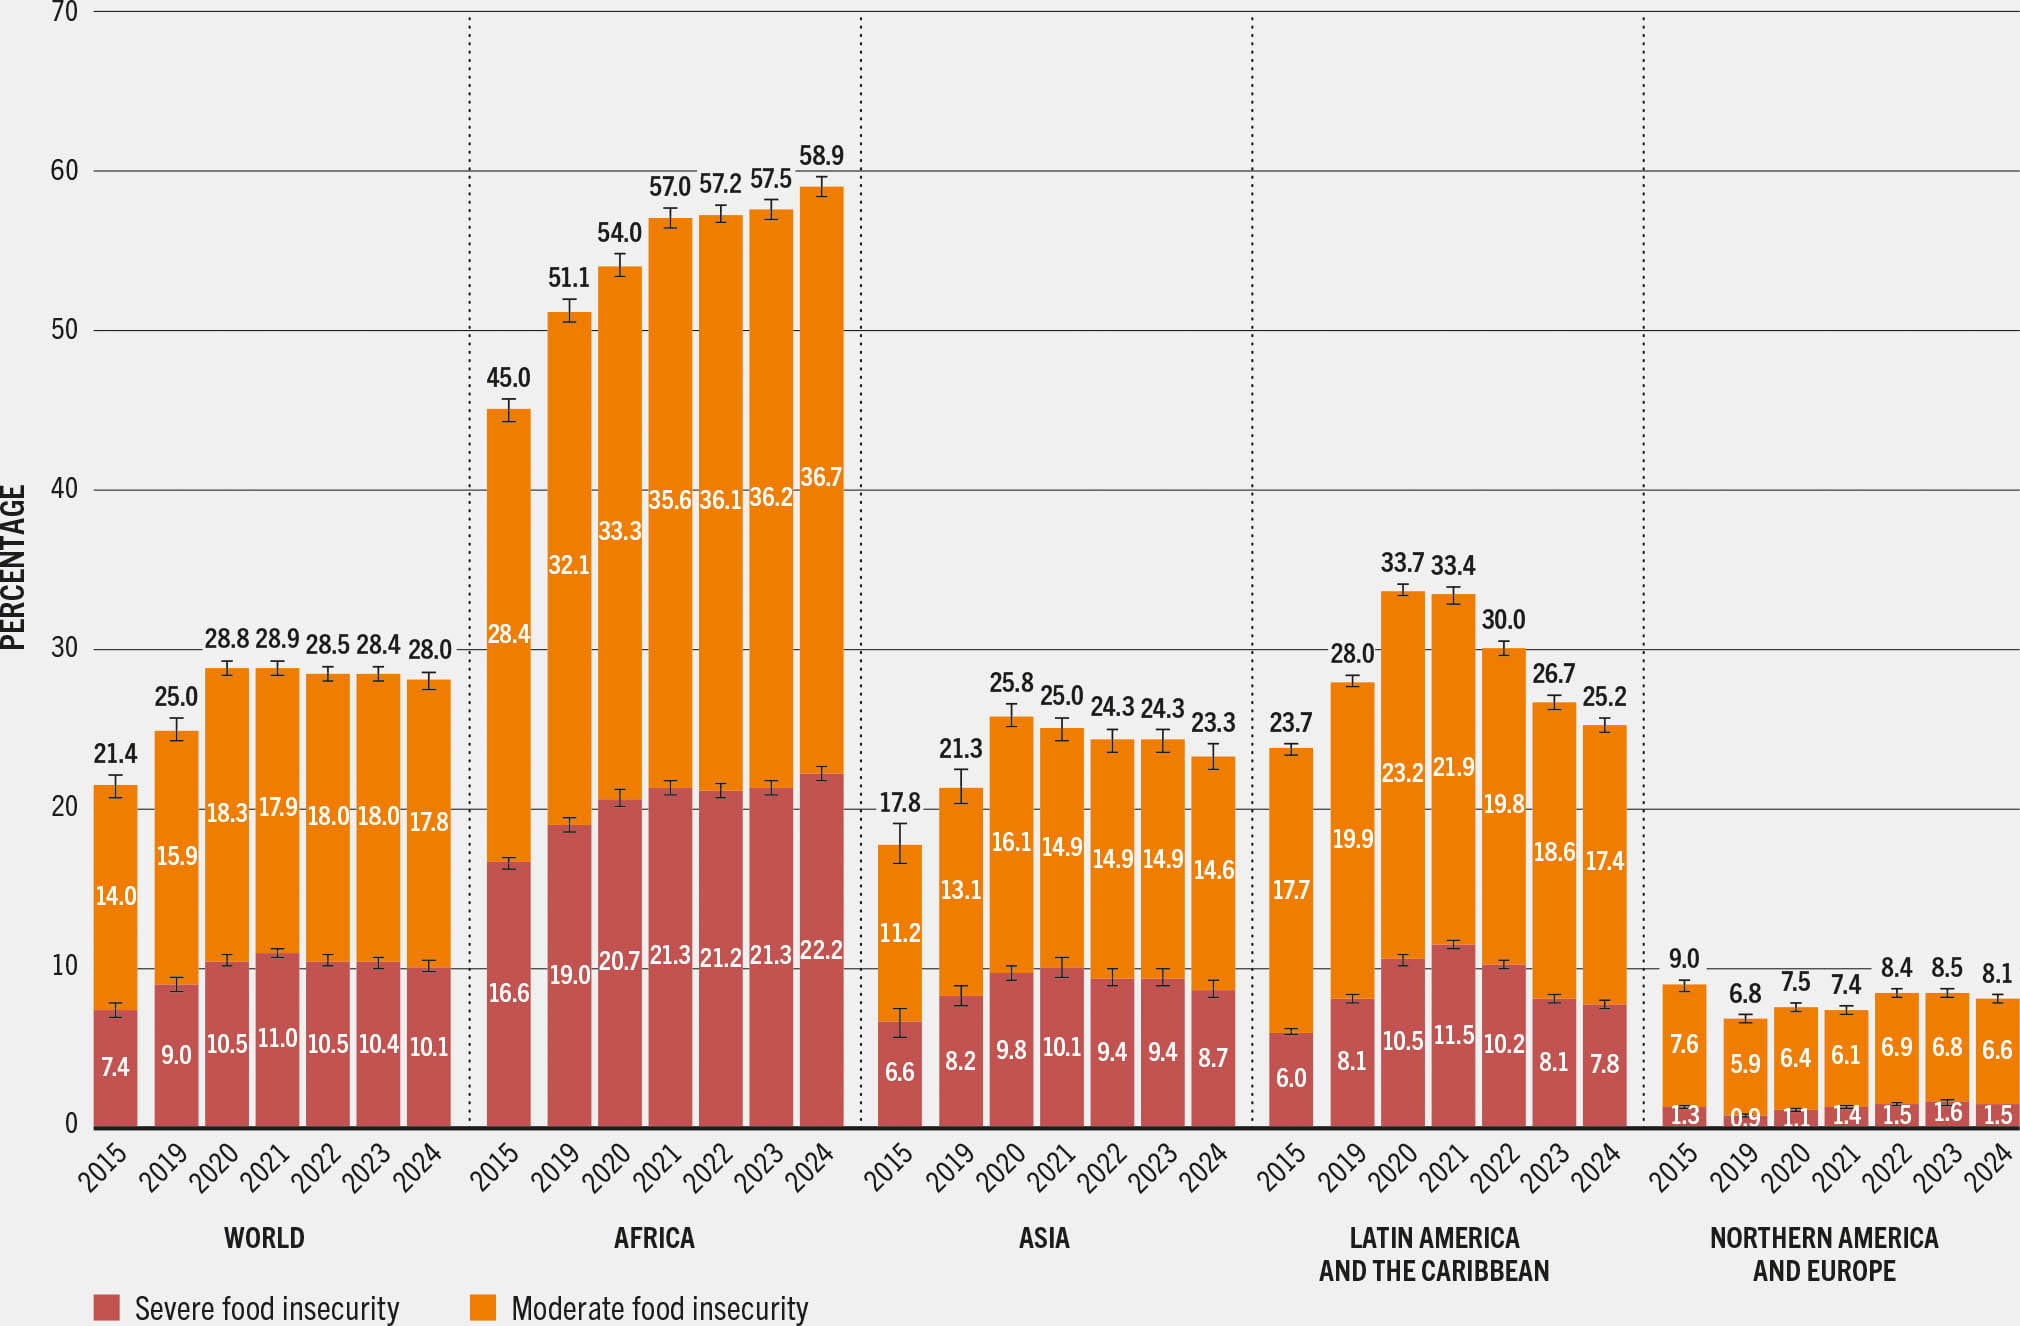
At the global level, the prevalence of food insecurity, both for moderate and severe food insecurity combined and for severe food insecurity only, has declined very gradually since 2021, following the sharp increase in the wake of the COVID-19 pandemic in 2020. From 2023 to 2024, the global prevalence of moderate or severe food insecurity decreased slightly, from 28.4 to 28.0 percent (Figure 2.4 and Table 2.3). It is now estimated that about 2.3 billion people in the world were moderately or severely food insecure in 2024, which is still 335 million more than in 2019, before the pandemic, and 683 million more compared to 2015, when the 2030 Agenda was launched (Table 2.4).
FIGURE 2.4 Global food insecurity levels declined gradually from 2021 to 2024, with Latin America and the Caribbean showing notable progress
SOURCE: FAO. 2025. FAOSTAT: Suite of Food Security Indicators. [Accessed on 28 July 2025]. https://www.fao.org/faostat/en/#data/FS. Licence: CC-BY-4.0.
TABLE 2.3Prevalence of food insecurity at severe level only, and at moderate or severe level, based on the Food Insecurity Experience Scale, 2015–2024
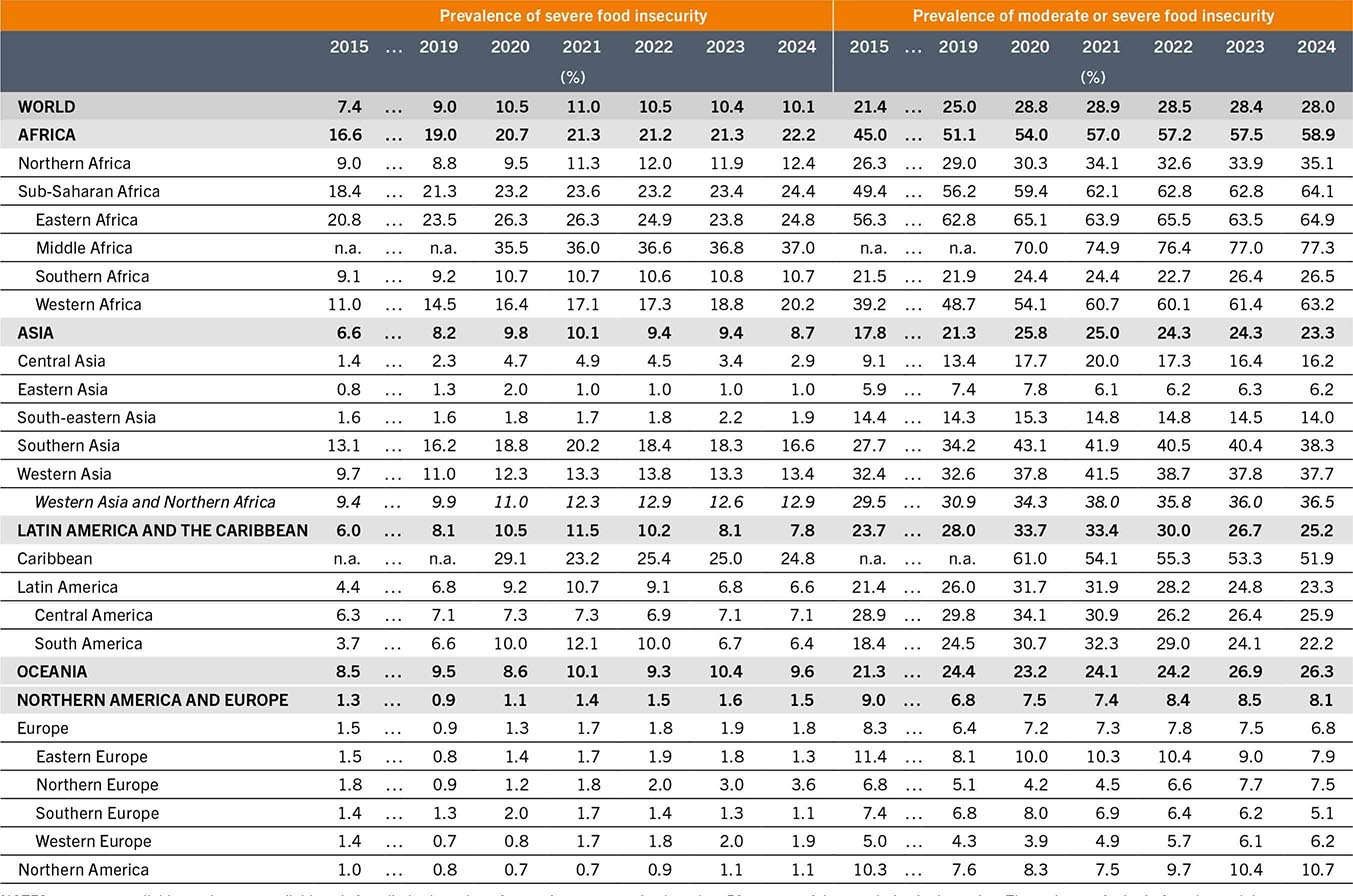
SOURCE: FAO. 2025. FAOSTAT: Suite of Food Security Indicators. [Accessed on 28 July 2025]. www.fao.org/faostat/en/#data/FS. Licence: CC-BY-4.0.
TABLE 2.4Number of people experiencing food insecurity at severe level only, and at moderate or severe level, based on the Food Insecurity Experience Scale, 2015–2024
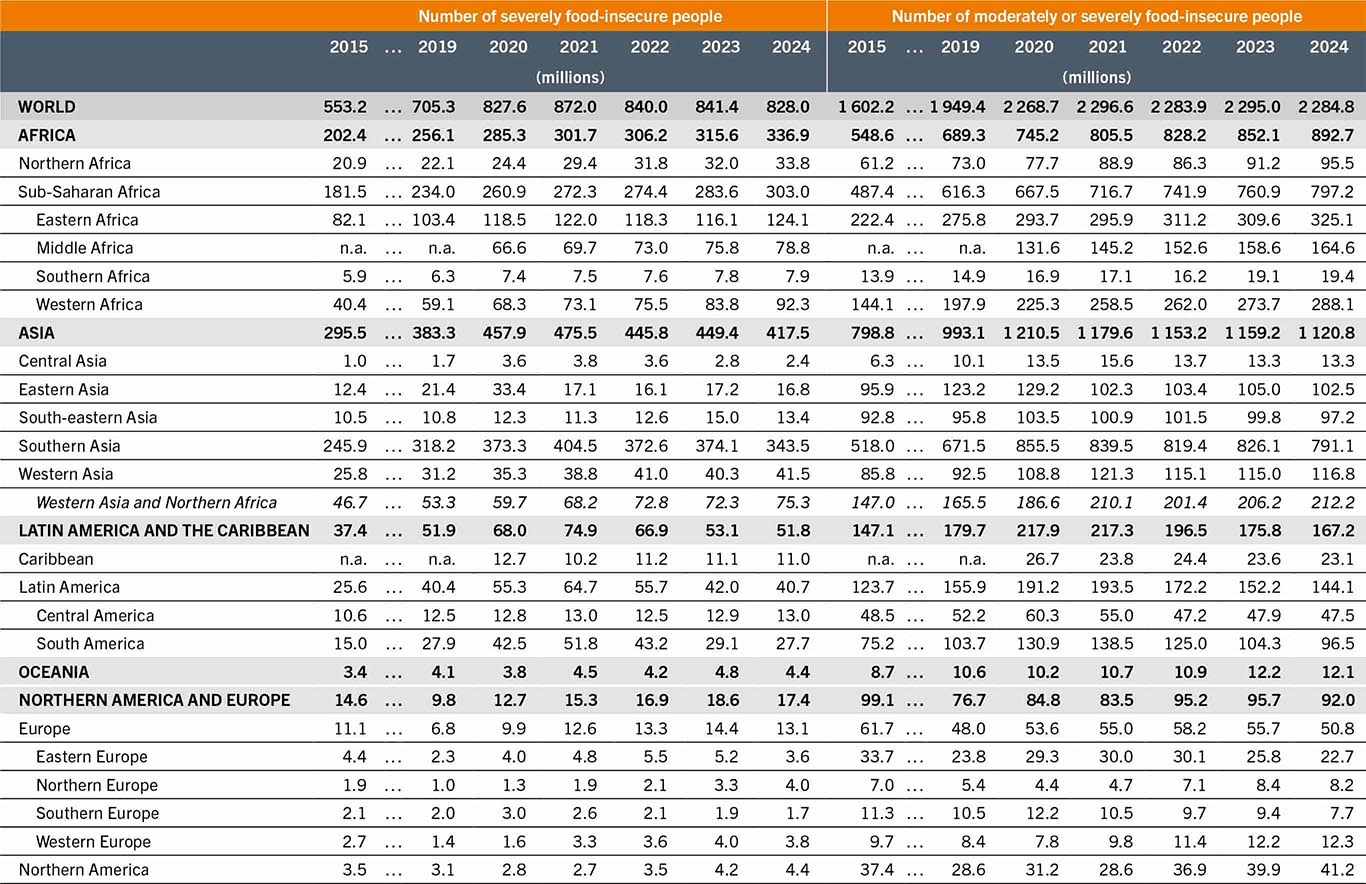
SOURCE: FAO. 2025. FAOSTAT: Suite of Food Security Indicators. [Accessed on 28 July 2025]. www.fao.org/faostat/en/#data/FS. Licence: CC-BY-4.0.
Of the approximately 2.3 billion people in the world facing moderate or severe food insecurity in 2024, an estimated 828 million were severely food insecure. The prevalence of severe food insecurity decreased marginally from 10.4 percent in 2023 to 10.1 percent in 2024.
Trends at the regional level differ notably, with food insecurity on the rise in Africa, falling in Latin America and the Caribbean, and decreasing gradually in Asia for several consecutive years, while in Oceania and in Northern America and Europe, new estimates point to a slight decline from 2023 to 2024 following a several-year rise (Table 2.3, Table 2.4 and Figure 2.4).
The prevalence of moderate or severe food insecurity in Africa appears to have risen from 57.5 percent in 2023 to 58.9 percent in 2024 – an increase of nearly 41 million people in one year. An estimated 893 million people in Africa were moderately or severely food insecure in 2024; of these, 337 million were possibly facing food insecurity at severe levels. The rise in food insecurity in Africa from 2023 to 2024 is due to the combined effect of marginal increases in all subregions of Africa. In 2024, moderate or severe food insecurity may have affected more than one-quarter of the population in Southern Africa, more than one-third in Northern Africa (although the estimates do not include an update for the Sudan), nearly two-thirds in Eastern and Western Africa, and more than three-quarters in Middle Africa.
Food insecurity levels continued to decrease slightly in Asia, with estimates of the prevalence of moderate or severe food insecurity declining from 24.3 percent in 2023 to 23.3 percent in 2024, equivalent to a decrease of about 38 million people in one year. It is estimated that about 1.1 billion people in Asia were facing moderate or severe food insecurity in 2024; of these, 418 million (8.7 percent of the population of the region) may have been severely food insecure. The region as a whole has been making gradual progress since 2020. All subregions of Asia showed signs of improvement from 2023 to 2024. Southern Asia and Western Asia had the highest estimated prevalence of moderate or severe food insecurity (both around 38 percent) in 2024, although Southern Asia saw the largest decrease from 2023 to 2024 (nearly 2 percentage points). Eastern Asia revealed the lowest prevalence, estimated at 6.2 percent of the population.
The most improvement occurred in Latin America and the Caribbean, where steady progress has been made since 2021. The number of people affected by moderate or severe food insecurity may have fallen by nearly 9 million in one year, from about 176 million to 167 million, with estimates dropping from 26.7 percent of the population in 2023 to 25.2 percent in 2024, driven mainly by progress in South America. The most recent trends in the estimates reveal that food security appears to be improving in all subregions of Latin America and the Caribbean, but most significantly in South America, where the estimated prevalence of moderate or severe food insecurity was nearly 10 percentage points lower in 2024 than in 2021, a difference that is equivalent to a reduction of more than 40 million people experiencing food insecurity. More than half the covered population of the Caribbean was estimated to be moderately or severely food insecure in 2024, compared to approximately one-quarter of the population in both Central America and South America. The proportion of the total food-insecure population in the Caribbean that is facing food insecurity at severe levels is also larger – nearly half.
Food insecurity improved marginally in Oceania. However, over 26 percent of the region’s population (about 12 million people) may still have faced moderate or severe food insecurity in 2024, including 9.6 percent (4.4 million) who may have been severely food insecure. This points to possible signs of a positive turnaround in the trend for the region, where food insecurity had been increasing since 2020.
There were also signs of a positive turnaround in Northern America and Europe, where a marginal improvement was seen from 2023 to 2024. Current estimates point to slightly over 8 percent of the population (92 million people) being moderately or severely food insecure in 2024, and 1.5 percent (17.4 million people) possibly facing severe food insecurity. The situation is the result of different trends in the two regions, with the estimated prevalence of moderate or severe food insecurity decreasing in Europe, from 7.5 percent in 2023 to 6.8 percent in 2024, but marginally increasing in Northern America, from 10.4 percent to 10.7 percent.
Nearly half of the total number of moderately or severely food-insecure people in the world live in Asia, given its very large population, even though the prevalence of people who are food insecure is much higher in Africa (Table 2.3 and Table 2.4). It is also worth noting that the share of food-insecure people facing severe food insecurity varies by region. In Africa, Asia and Oceania, between 36 and 38 percent of the total number of food-insecure people are severely food insecure, compared to 31 percent in Latin America and the Caribbean and only 19 percent in Northern America and Europe.
Differences in food insecurity across rural, peri-urban and urban areas and between men and women
One of the key guiding principles of the 2030 Agenda is leaving no one behind. Efforts to uphold this principle require evidence on specific subpopulations to understand whether some groups are more food insecure than others and what policies may be needed to address their specific needs.
Globally and in every region of the world except Northern America and Europe, people living in rural areas tend to be more food insecure than those living in urban areas, while the relative situation of peri-urban populations differs among the regions (Figure 2.5).b About 32.0 percent of people living in rural areas in the world were moderately or severely food insecure in 2024, compared to about 28.6 percent in peri-urban areas and 23.9 percent in urban areas. Focusing specifically on severe food insecurity only, a similar pattern emerges; around 11.5 percent of the rural population in the world is severely food insecure compared to 11.0 percent of the peri-urban population and 8.1 percent of the urban population.
FIGURE 2.5 Globally and in most regions, the prevalence of food insecurity has remained consistently higher in rural areas than in urban areas since 2022, with notable improvements in urban areas in Asia and across urban, peri-urban and rural areas in Latin America and the Caribbean
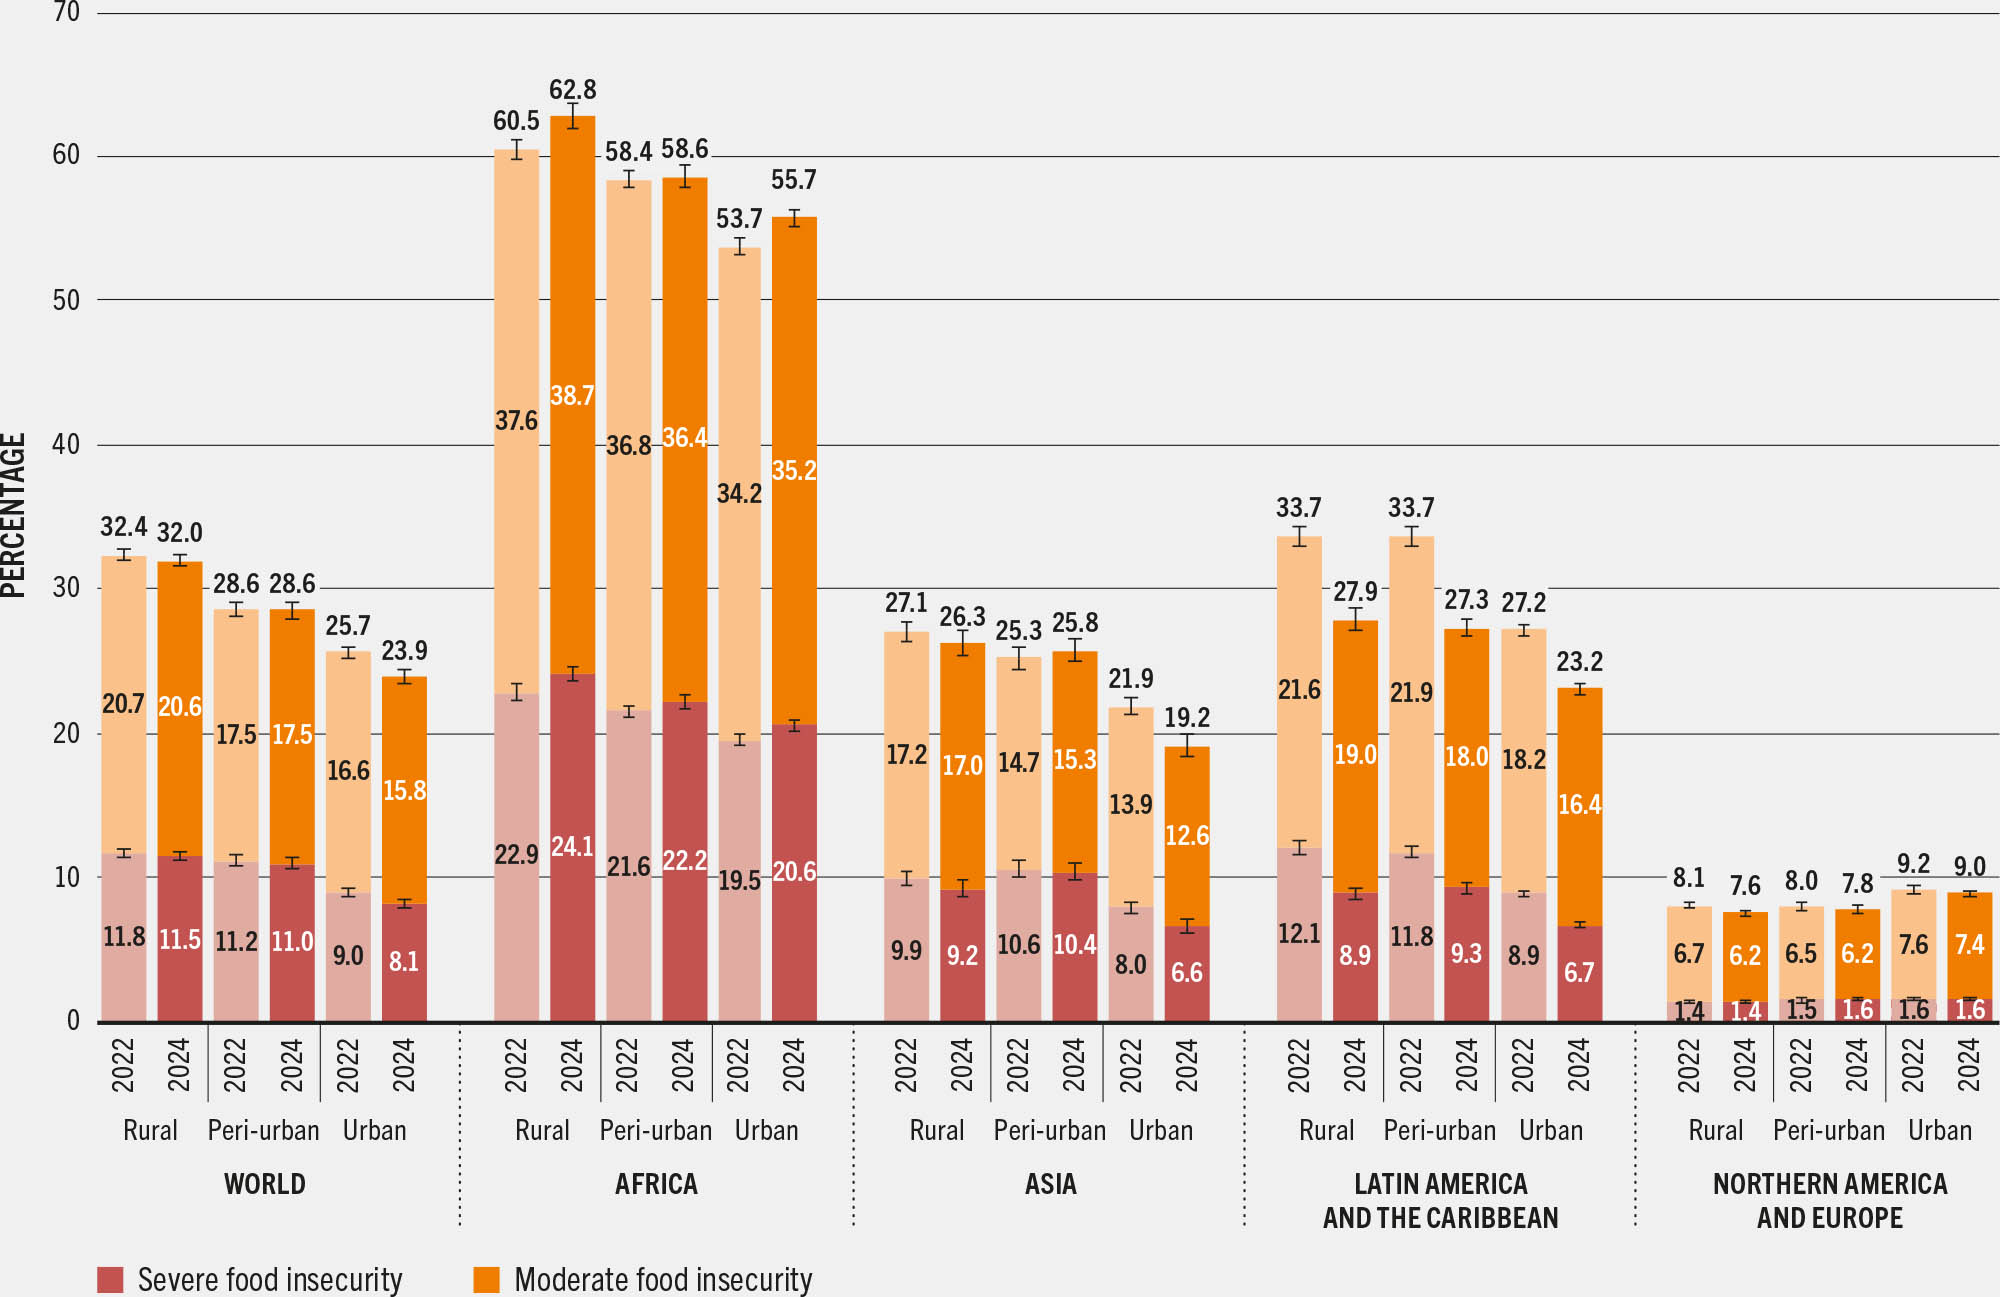
SOURCE: FAO. 2025. FAOSTAT: Suite of Food Security Indicators. [Accessed on 28 July 2025]. https://www.fao.org/faostat/en/#data/FS. Licence: CC-BY-4.0.
The pattern of decreasing food insecurity with increasing degree of urbanization is clear in Africa, where an estimated 62.8 percent of people living in rural areas were moderately or severely food insecure, compared to 58.6 percent in peri-urban areas and 55.7 percent in urban areas. Rural populations are notably more food insecure than urban populations in Asia and Latin America and the Caribbean as well, but the relative situation of peri-urban populations differs from that in Africa. In Asia and Latin America and the Caribbean, there is virtually no difference between rural and peri-urban populations for moderate or severe food insecurity, and for severe food insecurity, there are even signs of slightly higher levels in peri-urban areas. The only region where there are indications that food insecurity may increase slightly with increasing urbanization is Northern America and Europe (considered together for this analysis).c
Comparing the assessment in 2024 with the baseline of 2022 – the first year FAO disseminated the disaggregation by degree of urbanization for SDG Indicator 2.1.2 – a clear pattern emerges: at the global level the prevalence of moderate or severe food insecurity decreases only in urban areas, from 25.7 to 23.9 percent, while remaining virtually unchanged in rural and peri-urban areas. The same pattern is observed in Asia, where people’s access to food improves mostly in urban areas, as reflected in the drop in the prevalence of moderate or severe food insecurity from 21.9 percent in 2022 to 19.2 percent in 2024. Notably, in Latin America and the Caribbean, improvements were distributed more equally across rural, peri-urban and urban areas, while in Africa, food security worsened in both rural and urban areas and remained virtually unchanged in peri-urban areas. In Northern America and Europe, there were signs of marginal improvement in all areas.
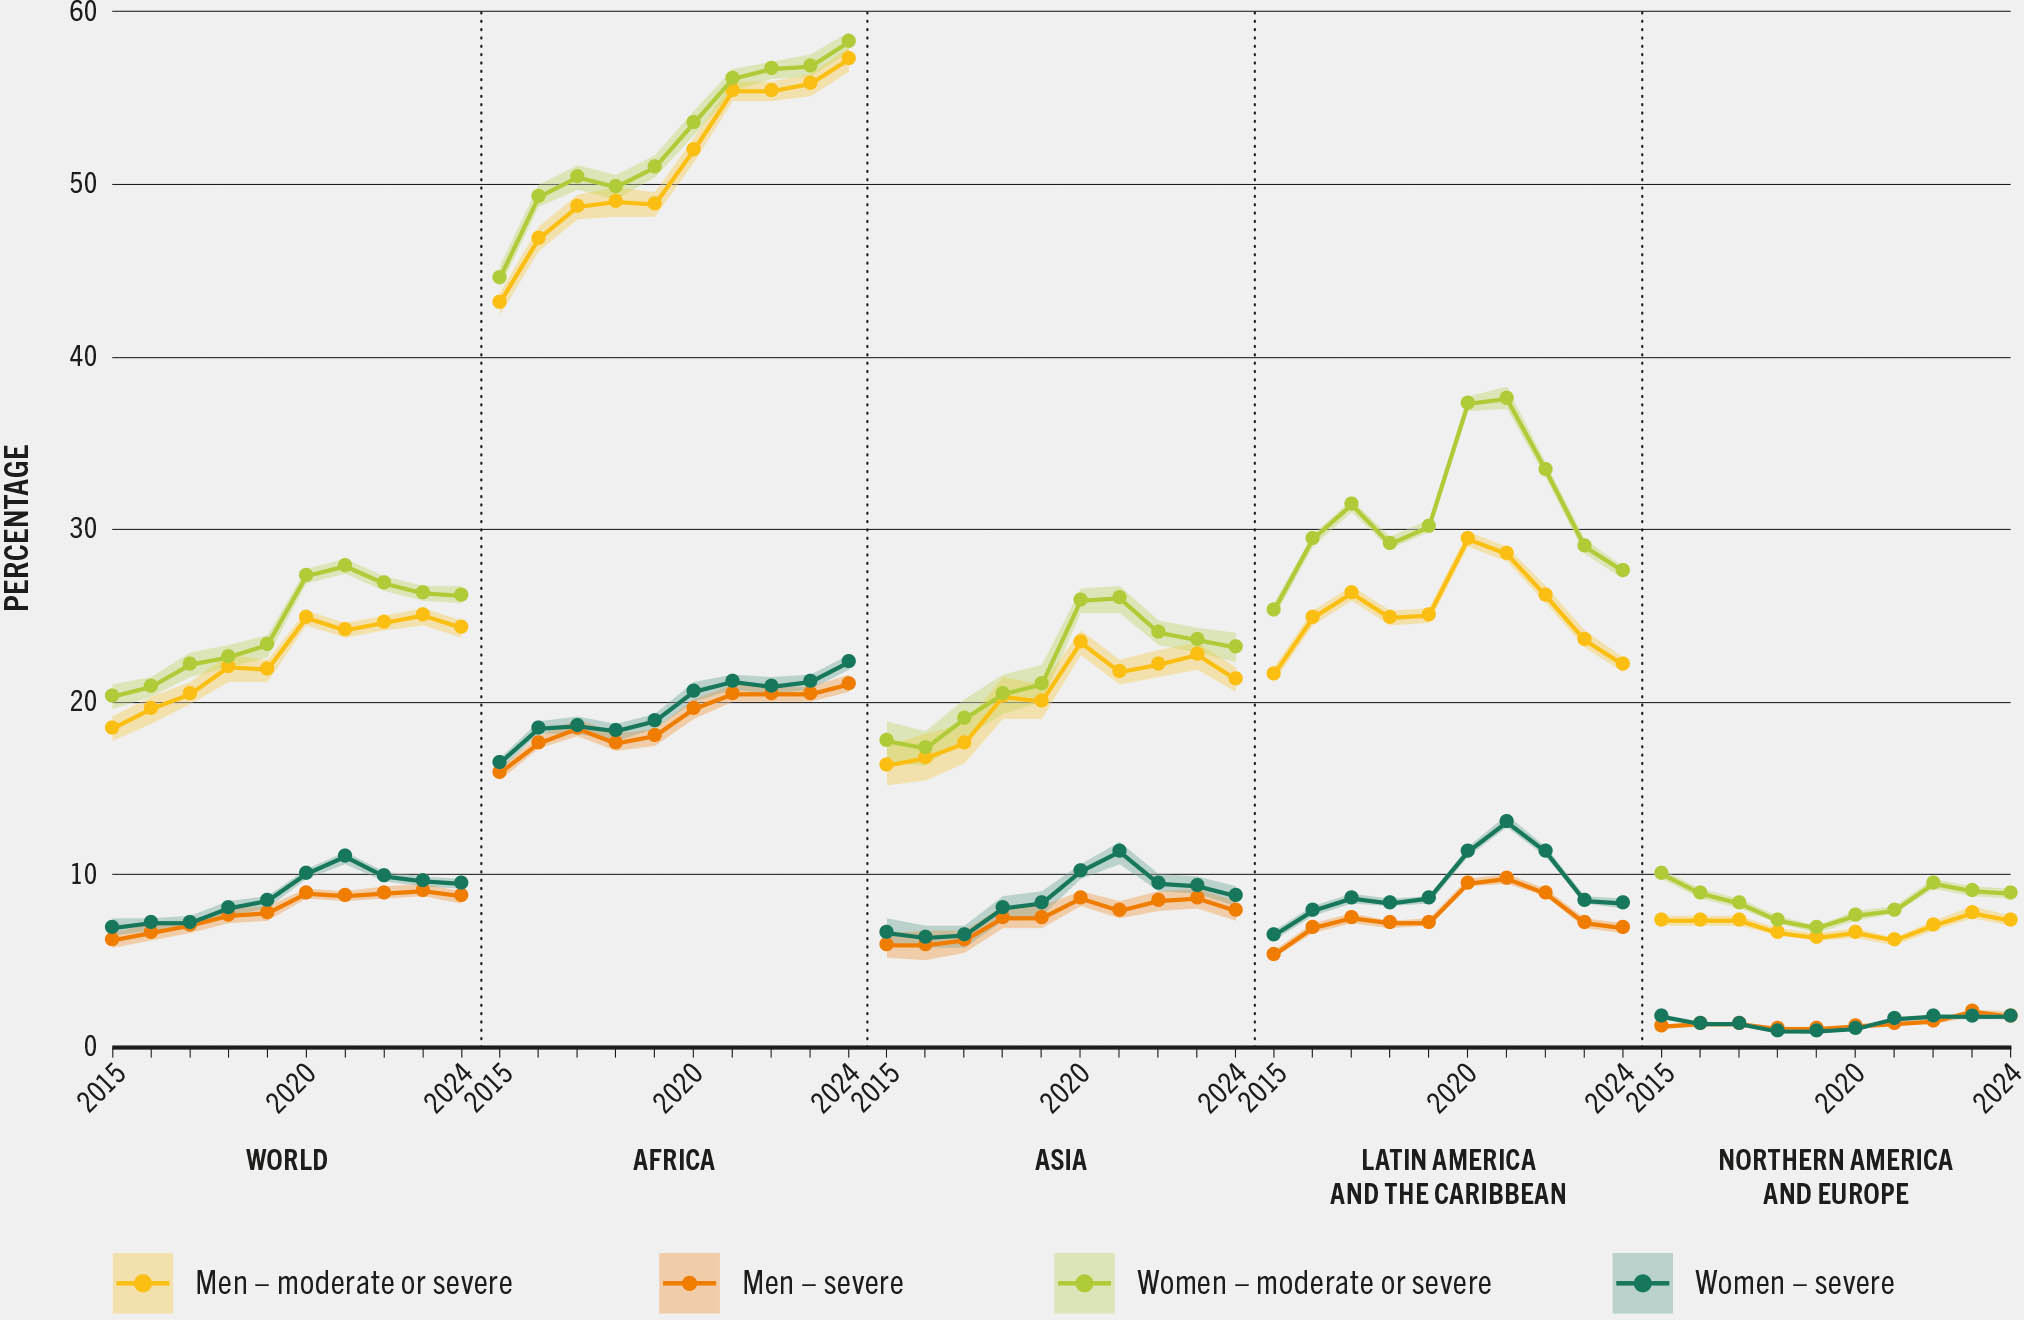
Persistent inequalities between men and women are also evident, with food insecurity still more prevalent among adult women than men in every region of the world (Figure 2.6).d The gender gap widened considerably at the global level in the wake of the COVID-19 pandemic, most notably in 2021; it then grew smaller for two consecutive years. But new estimates point to a widening of the gap at the global level between 2023 and 2024. During this period, the difference in the prevalence of moderate or severe food insecurity between women and men increased from 1.3 to 1.9 percentage points, and for severe food insecurity, from 0.6 to 0.8 percentage points. After these fluctuations over the past nine years, the gender gap in 2024 was about the same as it was in 2015, when the 2030 Agenda was launched.
FIGURE 2.6 The gender gap narrowed at the global level from 2021 to 2023, but increased slightly in 2024, with the prevalence of food insecurity remaining consistently higher among women than among men, globally and in all regions
SOURCE: FAO. 2025. FAOSTAT: Suite of Food Security Indicators. [Accessed on 28 July 2025]. https://www.fao.org/faostat/en/#data/FS. Licence: CC-BY-4.0.
For moderate or severe food insecurity, the increase in the gender gap from 2023 to 2024 was driven mostly by Asia, where the difference in the prevalence between men and women grew from 1.0 to 1.9 percentage points, and by Northern America and Europe, where the gap increased from 1.2 to 1.6 percentage points.
For severe food insecurity, however, the increase is mostly due to Africa, where a worrisome increase was seen in the gender gap, from 0.7 percentage points in 2023 to 1.3 percentage points in 2024.
The gender gap in food insecurity changed little in Latin America and the Caribbean between 2023 and 2024. However, this remains the region with the largest differences in the prevalence of food insecurity between men and women in the world – 5.3 percentage points at moderate or severe level, and 1.3 percentage points at severe level, in 2024.
In summary, the updated trends in hunger and food insecurity point to progress in some regions in recent years towards SDG Target 2.1 of ending hunger and ensuring access by all people to sufficient food all year round. However, global levels of hunger and food insecurity remain far above those recorded at the beginning of the 2030 Agenda; hundreds of millions more people struggled to meet their basic food needs in 2024 than in 2015. The number of chronically undernourished people in the world has increased by nearly 17 percent since 2015, and the number of people who are moderately or severely food insecure has increased by more than 40 percent globally and in Asia, and by more than 60 percent in Africa. Zero Hunger by 2030 may seem out of reach, but commitment to urgent action aimed at the progressive realization of the right to adequate food for all is a global obligation that cannot be neglected. Everyone benefits from a world in which all people have access to enough food – especially nutritious food comprising a healthy diet.


