


- ➔ Global food price inflation has significantly outpaced headline inflation since 2020, reflecting the heightened volatility and persistent pressures within agricultural and food markets. In January 2023, food price inflation peaked at 13.6 percent, outpacing headline inflation by 5.1 percentage points (8.5 percent). Although both rates were beginning to show signs of a downward trend by mid-2023, they remained elevated throughout the rest of the year. By 2024, food price inflation had reached its pre-COVID levels of 2019.
- ➔ The effects of two major shocks, the COVID-19 pandemic and the war in Ukraine, combined with extreme weather events, led to a sharp increase in the price of global agricultural commodities, with its peak in March 2022, fuelled also by concurrent energy price shocks.
- ➔ The combination of these shocks with unprecedented fiscal spending and relaxed monetary policies created a perfect storm, setting the stage for high food price inflation. Unlike previous high inflation episodes, this one began with demand-driven factors and later evolved into supply-driven inflation.
- ➔ The rise in global agricultural and energy commodity prices and the associated effects explain 47 and 35 percent of food price inflation at its peak in the United States of America and the euro area, respectively. The remaining 53 and 65 percent are explained by other factors, including rising labour costs, exchange rate fluctuations and pricing behaviour along the supply chain.
- ➔ Food price inflation has been particularly acute in low-income countries, where households often depend on markets for food supplies. Global median food price inflation rose significantly from 2.3 percent in December 2020 to 13.6 percent in January 2023, while low-income countries experienced an even steeper increase, with inflation hitting 30 percent in May 2023.
- ➔ The global recovery in wages has been highly uneven. In some countries, wage growth has kept pace with rising food prices. However, in many others, especially those affected by conflict, real wages have continued to decline, making it increasingly challenging for households to afford essential food items.
- ➔ Low-income countries, which have experienced the highest rates of food price inflation, with a pronounced peak between mid-2022 and mid-2023, have faced increases in food insecurity. Rising food prices can significantly impact households’ food security. A 10 percent increase in food prices is associated with a 3.5 percent rise in moderate or severe food insecurity and with a 1.8 percent increase in the proportion of individuals experiencing severe food insecurity. Structural and gender inequalities amplify the impact of food price inflation, particularly in countries with high income inequality. At its peak in January 2023, 65 percent of low-income countries and 61 percent of lower-middle-income countries (home to more than 1.5 billion people) faced rates of food price inflation above 10 percent, underscoring its potentially pervasive contribution to food insecurity.
- ➔ The recent episode of food price inflation is closely linked to rising rates of wasting among children under five years of age. A 10 percent increase in food prices is associated with a 2.7 to 4.3 percent rise in the prevalence of wasting and a 4.8 to 6.1 percent increase in severe wasting among children under five.
- ➔ Relative prices of different types of foods (by food group, level of processing and nutritional profile) appear, on average, to have been stable between 2011 and 2021 around the world. Nutrient-dense foods such as fruits and vegetables consistently have the highest prices per kilocalorie. In contrast, ultra-processed foods, in general, tend to have lower prices per kilocalorie than processed alternatives. Ultra-processed foods are increasingly displacing more nutrient-dense alternatives despite growing evidence of their adverse health impacts.
- ➔ Between 2019 and 2024, prices for starchy staples and oils exhibited the sharpest rise across food groups in Mexico, Nigeria and Pakistan. As starchy staples form the core of diets for the poorest households, such steep increases may undermine food security and nutrition; however, access to low-cost items in other food groups may help sustain dietary adequacy despite inflation.
Rising food prices have emerged as a global concern since 2022, capturing public attention. According to a global Ipsosg survey, inflation has become one of the top worries worldwide, surpassing fears related to crime, violence and poverty.1 The surge in food prices, fuelled by a mix of pandemic-related fiscal measures, unbalanced monetary policies, supply disruptions and geopolitical conflicts, has negatively affected market-dependent households, particularly the most vulnerable ones. Although the rate of increase has slowed recently, elevated food costs remain a pressing issue, straining household budgets on a daily basis and increasing food insecurity and malnutrition. As a key component of the overall consumer price index, food price inflation has become also an important element to monitor and act upon for governments around the world.
Responding to growing global concerns, this report delves into the multifaceted impacts of rising food prices, exploring their implications for food security and nutrition. Section 3.1 introduces the concept of inflation with an emphasis on food prices, highlighting the sharp increase in food prices compared to the prices of other consumer goods and services. This disproportionate rise has placed a significant burden on poor households that spend a large portion of their income on food. Section 3.2 explores the underlying causes of the recent spike in food prices, drawing comparisons to previous inflationary episodes. Section 3.3 discusses the association between inflation and its impact on food security and nutrition outcomes. This is particularly relevant for low-income countries (LICs) where rising food prices make it difficult for families to afford sufficient, safe, and nutrient-dense foods all year round. Finally, Section 3.4 examines the inflationary pressures on different food groups, focusing on how rising prices could impact the affordability and accessibility of healthy diets.
3.1 Food price inflation: stylized facts
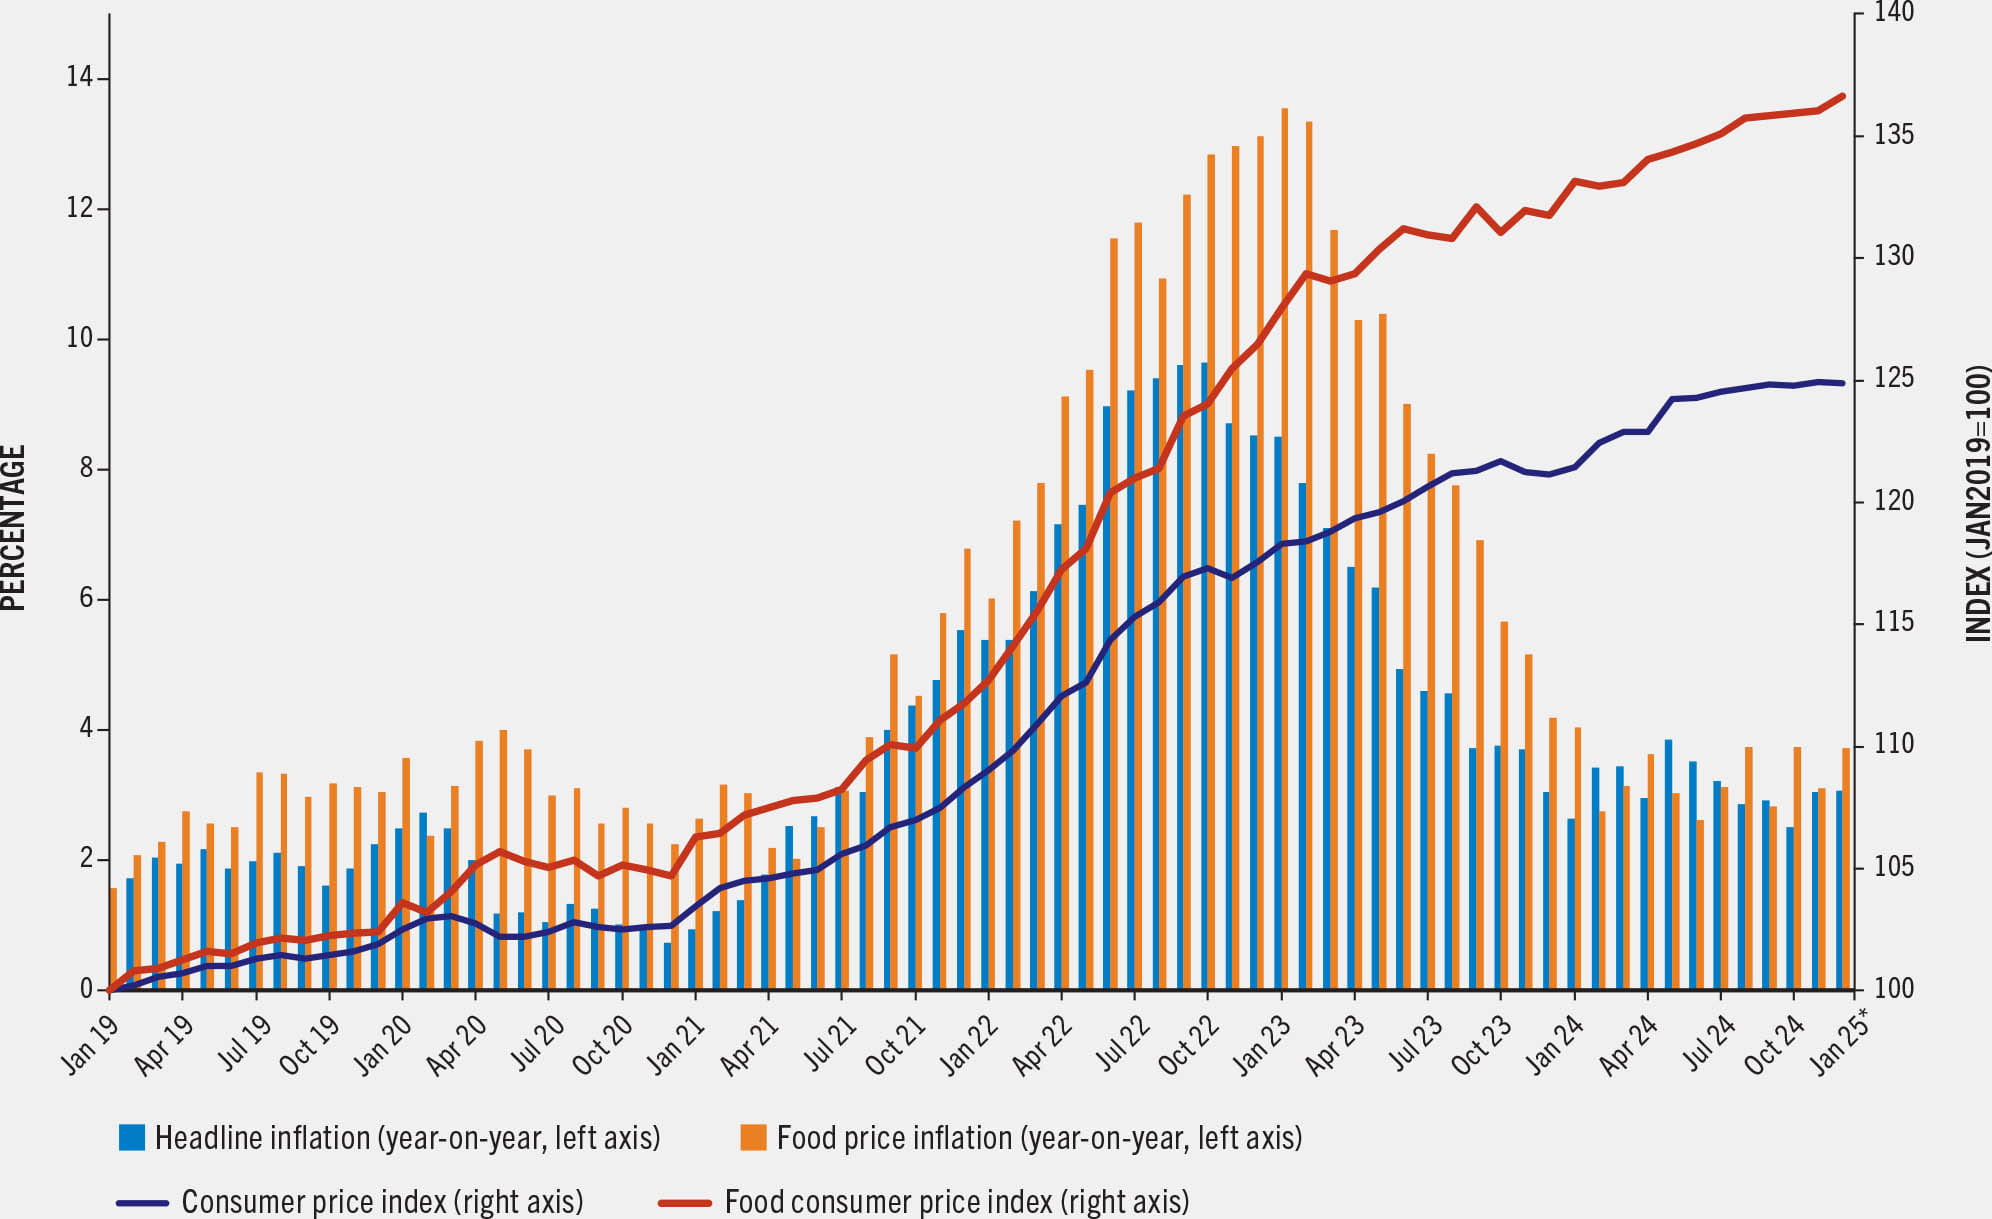
Since late 2020, domestic food retail prices have risen significantly across most countries, posing considerable challenges for both consumers and policymakers. Year-on-year global average food price inflation surged from 5.8 percent in December 2020 to a staggering 23.3 percent in December 2022.2 These figures are heavily influenced by countries that experienced hyperinflation, such as Lebanon, South Sudan, the Bolivarian Republic of Venezuela and Zimbabwe, where year-on-year inflation peaks reached levels well above 350 percent. As a result, using the median provides a more accurate reflection of global inflation levels:h median food price inflation increased sharply from 2.3 percent in December 2020 to 13.6 percent in January 2023 (see Figure 3.1, and Box 3.1 for definitions).
FIGURE 3.1 Food price inflation has risen since late 2020, peaking in January 2023
SOURCE: Authors' (FAO) own elaboration based on FAO. 2025. FAOSTAT: Consumer Price Indices. [Accessed on 18 June 2025]. https://www.fao.org/faostat/en/#data/CP. Licence: CC BY-4.0.
BOX 3.1Definitions and concepts: What is inflation? What is food price inflation?
General price level: The average level of all prices in an economy at a given point in time is expressed as an aggregate – or general – price level. Since an economy produces a range of different products, general price levels are usually measured through indices. The most common is the consumer price index.
Consumer price index: A consumer price index (CPI) measures changes in the prices of goods and services consumed by households. These changes affect the real purchasing power of consumers’ incomes and also consumers’ welfare. As the prices of different goods and services do not all change at the same rate, a CPI can only reflect their average movement. A CPI is typically assigned a value of unity (or 100) in a reference period, and the values of the index for other periods are intended to indicate the average proportionate (or percentage) change in prices from this price reference period.
Inflation: Inflation can be viewed as a process of continuously rising prices, or its equivalent, that is, a process of continuously falling value of money. There are several ways to measure prices, but the CPI is the most common approach. Thus, inflation is measured as the growth rate of the CPI over a given period. The overall inflation in an economy is measured by the headline inflation.
Headline inflation: The most reported measure of inflation, the rate of headline inflation reflects price changes across all items typically consumed by households. It measures changes in the prices of a broad basket of goods and services, and includes core inflation, food price inflation and energy inflation.
Core inflation: Core consumer inflation focuses on the underlying and persistent trends in inflation; it excludes prices set by the government and more volatile prices of products such as food and energy that are most affected by seasonal factors or temporary supply conditions.11
Food CPI and food price inflation: The food consumer price index (food CPI) measures change over time in the general price levels of foods and non-alcoholic beverages that households use, pay for or otherwise acquire for consumption. The cost of purchasing a fixed basket of consumer foods and beverages is measured during a specified period; the products in the basket are representative of household expenditure and are of constant quality and similar characteristics. Food price inflation is the growth rate of the food CPI over a given period. When aggregating over several countries (to provide, for example, global or regional estimates), the food CPI and inflation can be expressed as a weighted average* across countries. However, outliers and atypical values can disproportionately affect and distort aggregate estimates. As such, the median might be a better metric. The median is the 50th percentile of a distribution. In other words, it is the middle number in a series of data points that have been sorted in ascending or descending order.
Hyperinflation: Hyperinflation refers to a situation where the prices of goods and services rise uncontrollably over a defined period. In general, hyperinflation is used when inflation increases at a rate of over 50 percent a month.13
Global food price inflation has significantly outpaced headline inflation since 2020, reflecting the heightened volatility and persistent pressures within agricultural and food markets. General inflation (called “headline inflation”, see definitions in Box 3.1) increased from 2021 to 2023. It is important to assess whether the rise in food prices was faster or slower, in order to gain a better understanding of whether food was becoming more or less affordable than other household needs. At the onset of the COVID-19 pandemic in early 2020, overall inflation remained relatively low. Though still modest, food price inflation was significantly higher than headline inflation.i As governments began to relax stay-at-home restrictions and the global economy started the process of recovery from the pandemic, overall inflation was picking up by mid-2021. Subsequently, the eruption of the war in Ukraine in February 2022 led to increased prices of vital farm inputs (such as fertilizers), affected the global supply of agricultural commodities, and disrupted energy markets (see Section 3.2). This translated into higher overall prices, with major effects on food prices. At its peak in January 2023, food price inflation was 5.1 percentage points higher than headline inflation (13.6 percent vs 8.5 percent). Throughout 2023, both inflation rates remained at high levels but started showing a decreasing trend.
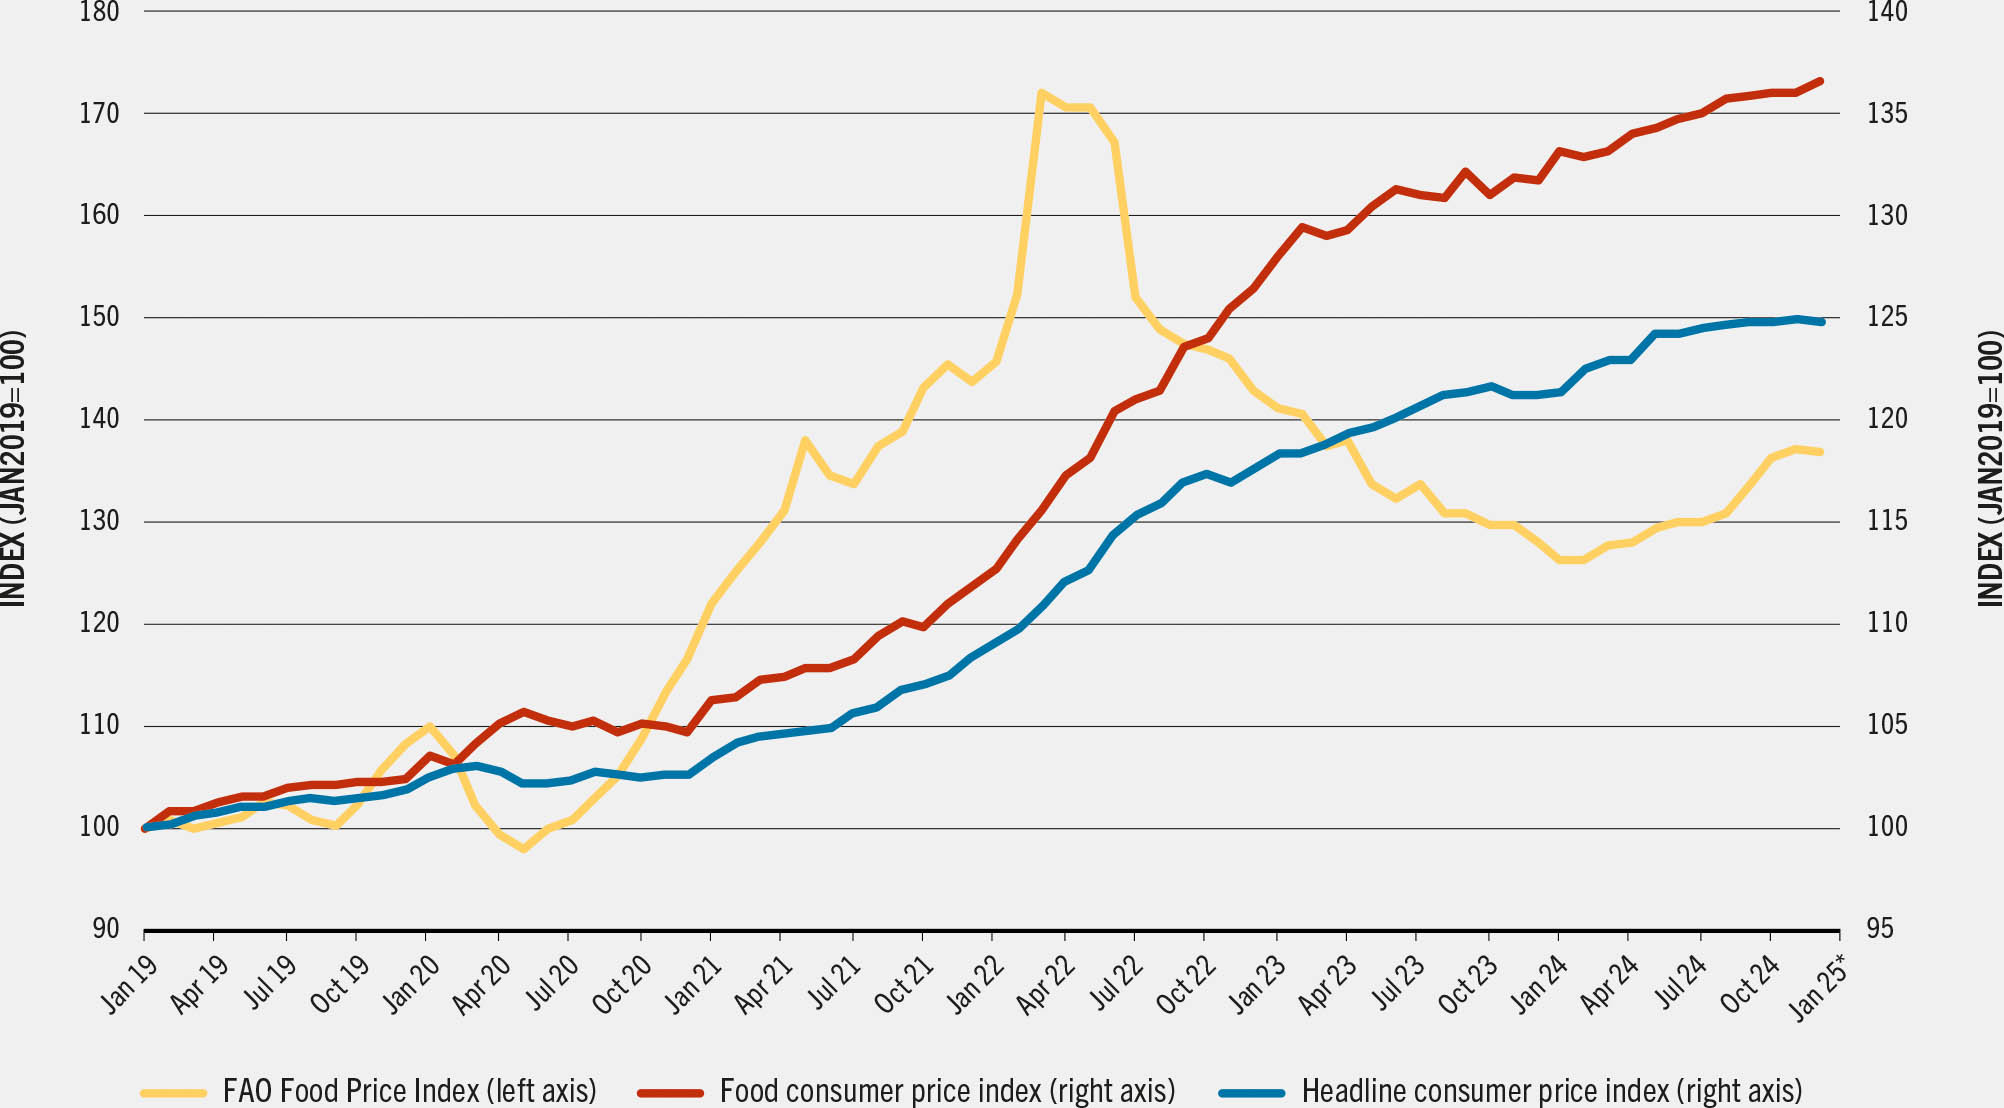
When monitoring food and agricultural prices, various metrics are available, each serving a specific purpose and capturing different aspects of the market. Box 3.2 highlights the fundamental differences between the FAO Food Price Index (FFPI) and the food CPI. The FFPI tracks international market trends for primary agricultural commodities such as cereals, dairy and oils, using export prices in US dollars and weighting commodities by their share in global trade. In contrast, the food CPI reflects consumer-level retail prices within a country, expressed in local currency and weighted by food items' share in household expenditures. These distinctions – in product scope, weighting methods, price source, and currency – underscore the FFPI’s global trade focus versus the food CPI’s role in measuring domestic food price inflation.
BOX 3.2Tracking prices of food and agricultural products
A key indicator to measure food prices is the FAO Food Price Index (FFPI). This index reflects monthly fluctuations in international prices for a selected basket of food commodities, measured in US dollars. The FFPI provides insights into global price trends, with monthly data available in both real and nominal terms from 1990 onwards, and annual indices dating back to 1961, enabling long-term historical comparisons.
This indicator is fundamentally different from the food consumer price index (food CPI) used to track food price inflation. The FFPI reflects the situation in global markets for agricultural commodities, while the food CPI captures the average price of food faced by consumers at the national level (Figure A). The real FFPI does not represent real prices in the traditional macroeconomic terms and is not deflated by inflation but tracks the relative prices between agricultural commodities and manufactured products. Various methodological details differentiate these two metrics, including:
- Scope of products: The FFPI focuses on key primary agricultural commodities such as cereals, vegetable oils, dairy, meat and sugars, excluding products like fish and seafood. In contrast, the food CPI covers a broader range of food items, including both primary and processed products and non-alcoholic beverages.
- Product weights in the index: The FFPI reflects the importance of selected commodities in global international markets. Each commodity group is weighted based on its average share in global exports during the 2014–2016 base period. For the food CPI, weights are based on national household expenditure shares at the consumer level. These shares are updated periodically by central banks or national statistical offices, according to country-specific needs and practices.
- Representation of relative country sizes in global and regional aggregates: The FFPI is computed only at the global level and does not apply explicit country weights. However, a country’s influence is indirectly captured through its share of global exports. Instead, in The State of Food Security and Nutrition in the World, global and regional food CPI figures are derived using the median across countries, providing a more balanced representation that minimizes the influence of outliers.
- Location of price measurement: Prices used in the FFPI are primarily export prices, capturing values at the point of international trade. In contrast, the food CPI reflects retail prices paid by consumers within each country. As a result, the FFPI excludes much of the cost associated with transportation, handling and processing – factors that are integral to consumer-level inflation and macroeconomic trends, which are captured by the food CPI.
- Currency of measurement: The FFPI is calculated using prices and sub-indices expressed in current US dollars, as this reflects how major commodities are quoted in international markets. The food CPI, by contrast, is a domestic measure expressed in the local currency unit. Therefore, large exchange rate fluctuations, such as currency depreciation, can significantly affect the national food CPI through imported inflation, while having limited or indirect effects on the FFPI.
Figure A Trends in international and domestic food prices: FAO Food Price Index vs consumer price index
SOURCES: Data for consumer price index are based on FAO. 2025. FAOSTAT: Consumer Price Indices. [Accessed on 18 June 2025]. https://www.fao.org/faostat/en/#data/CP. Licence: CC BY-4.0; data for FAO Food Price Index are based on FAO. 2025. World Food Situation. In: FAO. [Cited 6 June 2025]. https://www.fao.org/worldfoodsituation/foodpricesindex/en
International agricultural prices, as measured by the FFPI, experienced a sharp increase from mid-2020 to early 2022. This surge was followed by a rise in global inflation, initially driven by external shocks and subsequently by the delayed transmission of international price changes to domestic markets. In spring 2022, global markets began to stabilize as harvest conditions improved, the initial impact of the war in Ukraine was absorbed, and trade disruptions such as export restrictions were lifted. Despite the stabilization of the commodity markets, domestic inflation continued to climb reflecting the lagged cost-transmission pattern. A broader return to stability emerged towards the end of 2024.
Between 2021 and 2023, food prices rose substantially faster than prices for other consumer goods and services, placing a disproportionate burden on households that spend a large share of their income on food. This underscores how food became increasingly less affordable for households relative to other goods in the economy. After a protracted and intense period of inflation, both headline and food price indices showed signs of stabilization followed by a gradual decline in 2023.
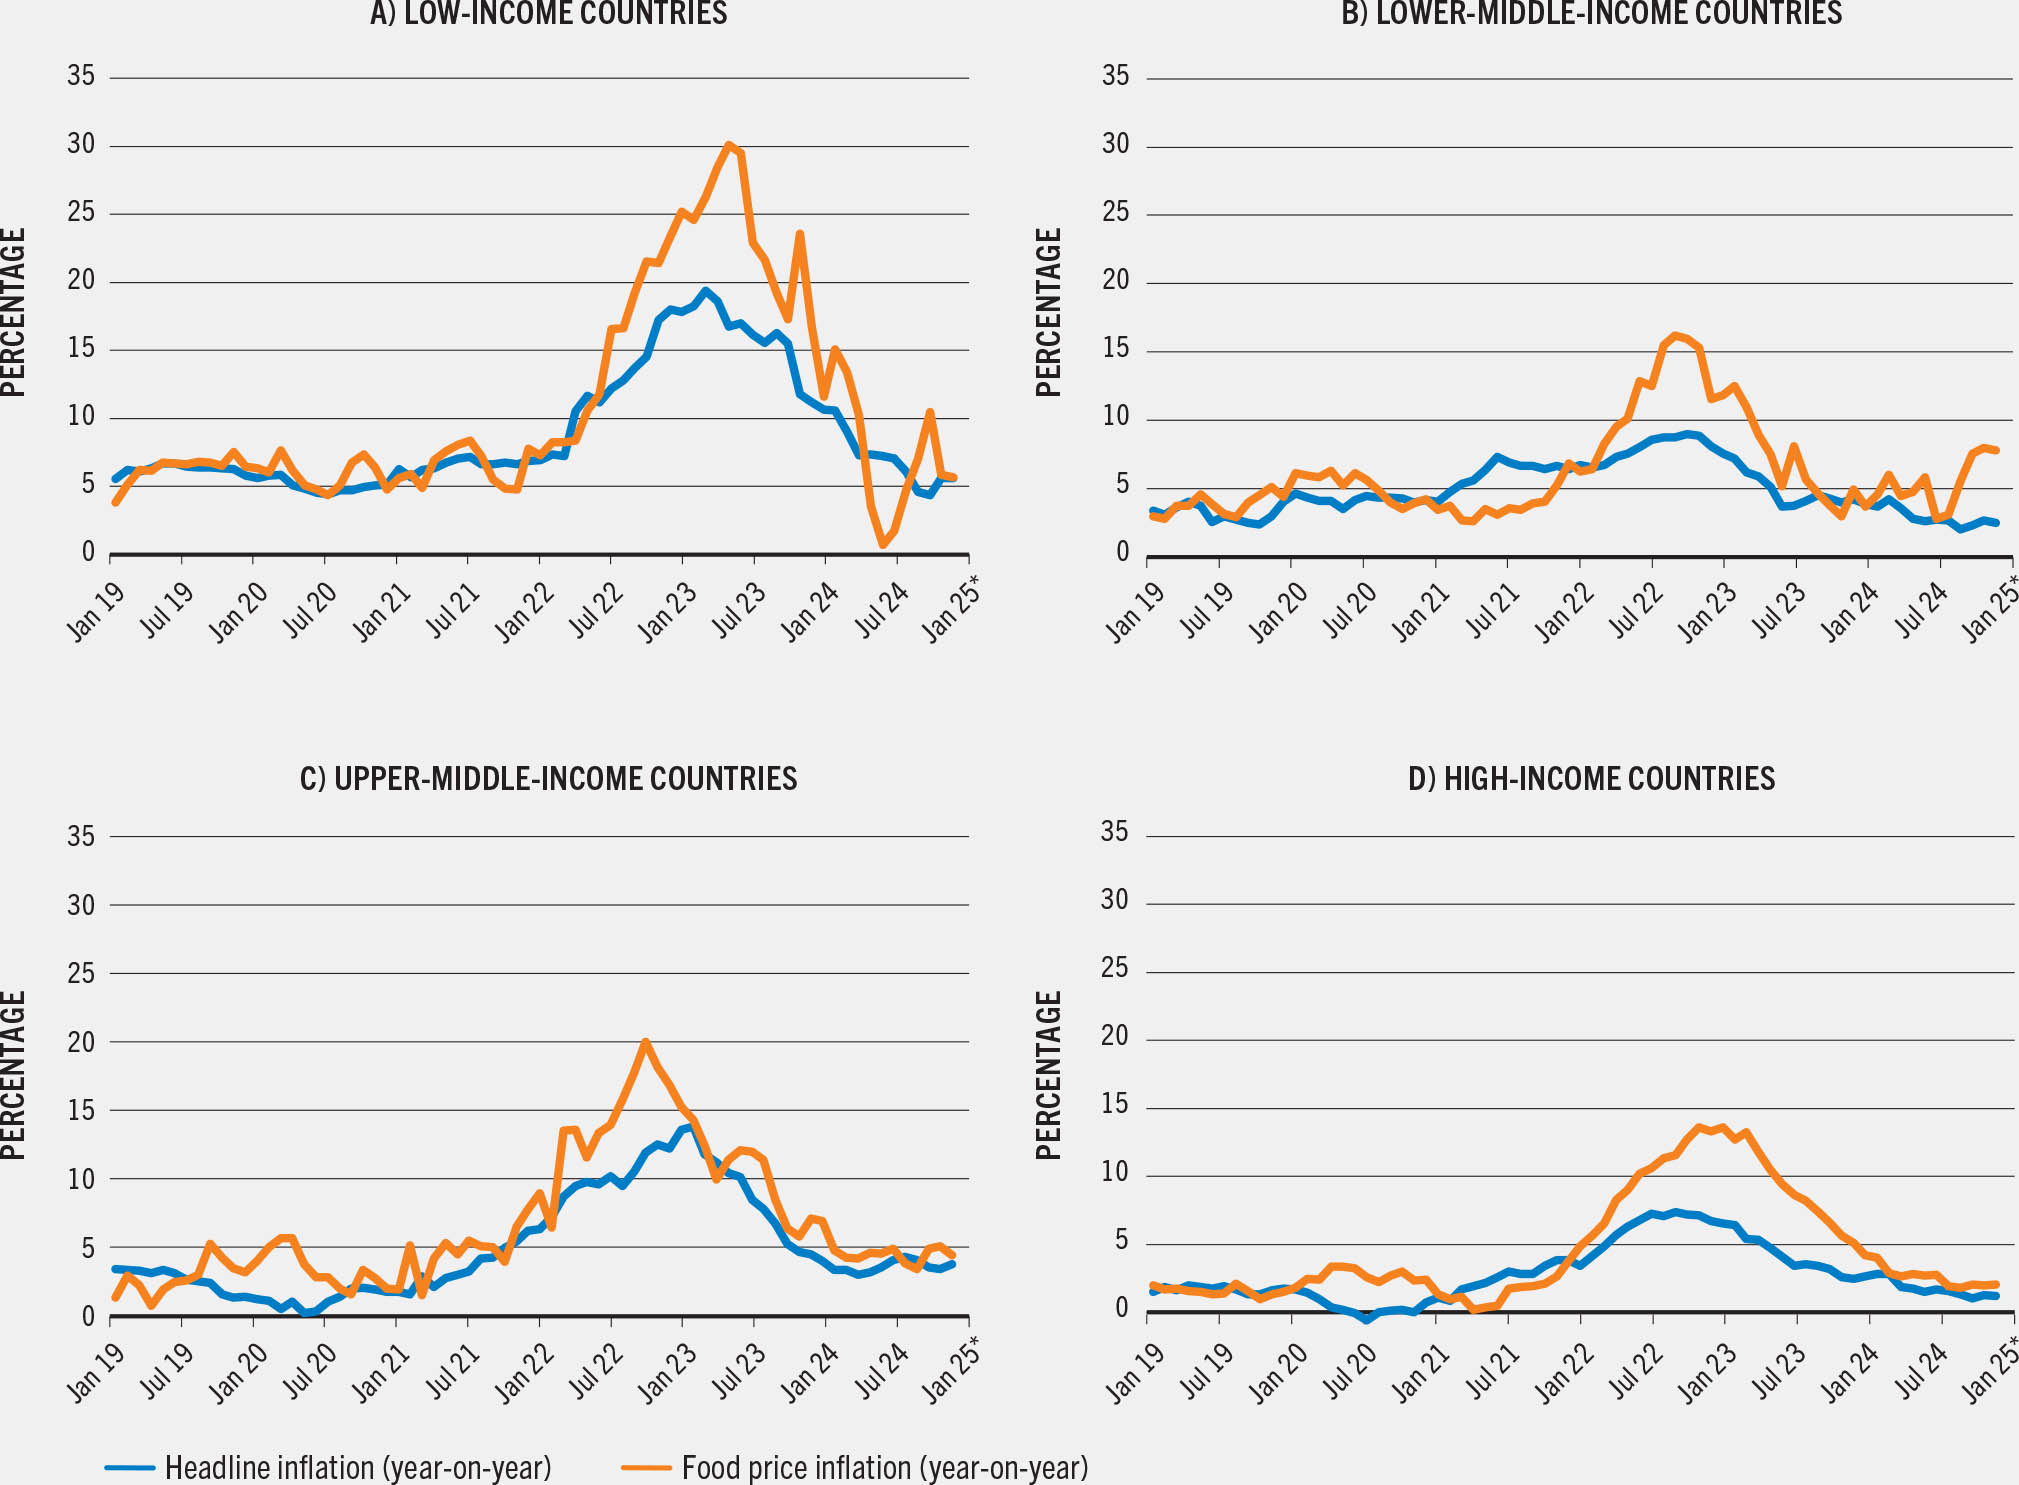
Food price inflation has been particularly acute in low-income countries (Figure 3.2). Most households, even those that depend on agriculture for their livelihoods, rely on markets for their food supplies.j Market-based food sourcing leaves households vulnerable to sharp price increases, exacerbating food insecurity and limiting access to and consumption of healthy diets. Smallholder farmers and agricultural labourers are often net food buyers, so rising food prices typically outweigh any income gains they receive from selling their produce. As a result, rising food prices not only strain household budgets, but also challenge rural livelihoods, undermining progress towards poverty reduction and food security and nutrition.27, 28
FIGURE 3.2 Food price inflation was the highest in low-income countries, 2019–2024
SOURCE: Authors' (FAO) own elaboration based on FAO. 2025. FAOSTAT: Consumer Price Indices. [Accessed on 18 June 2025]. https://www.fao.org/faostat/en/#data/CP. Licence: CC-BY-4.0.
Low-income countries experienced the most severe and sustained increases in food price inflation, with a pronounced peak between mid-2022 and mid-2023, when food price inflation rates were as high as 30 percent. During this period, headline inflation also spiked but remained significantly lower than food price inflation, indicating that food prices were the primary driver of cost-of-living increases. Even as inflationary pressures began to ease in 2024, this pervasive disparity emphasizes the challenges faced by households in LICs, which continue to grapple with food affordability issues.
Lower-middle-income countries (LMICs) and upper-middle-income countries (UMICs) also saw substantial surges in food price inflation, albeit less pronounced than in LICs. In LMICs, food price inflation peaked at around 16 percent in September 2022 before gradually declining, while UMICs saw a similar pattern with peak food price inflation nearing 20 percent in October 2022. Despite reductions, food price inflation remained significantly higher than headline inflation throughout the period, reflecting structural vulnerabilities in food supply chains and market dynamics in these countries.
In contrast, high-income countries (HICs) experienced relatively low levels of food price inflation, particularly before mid-2022; however, food price inflation peaked at around 14 percent in November 2022. Although food price inflation increased during global shocks, it remained more controlled and closer to headline inflation rates in HICs compared to lower income groups. Recent average food price inflation (January 2024 to December 2024) stabilized at 2.7 percent, slightly above the January 2019 to January 2021 average rate of 2.1 percent.
The scale of local food price increases since 2020 is striking when viewed through cumulative five-year food price inflation. Out of 203 countries, 139 experienced cumulative food price inflation exceeding 25 percent. In 49 of these, inflation surpassed 50 percent, and in 25 countries, it exceeded 100 percent. Such prolonged food price pressures risk undermining household coping capacities and worsening food insecurity.29–33


