


1. The Global Agro-ecological Zoning methodology (GAEZ)
1.1 Assessing land suitability for different crops
The Global Agro-Ecological Zoning (GAEZ) database represents the main source of information for the analysis of land suitability and yield gaps in this report, and for the assessment of climate impact on land suitability.
The GAEZ methodology, developed by FAO and IIASA, models the crop cultivation potential as the attainable limit to produce individual crops under given agroclimatic, soil and terrain conditions for specific levels of agricultural inputs and management (Fischer et al., 2021).
The levels of inputs and management are a central element of the GAEZ methodology. There are two main levels: high input and low input (Fischer et al., 2021).
- Low-level input/limited management. Under the limited management assumption, the farming system is largely subsistence-based and not necessarily market-oriented. Production is based mainly on the use of local cultivars, labour-intensive techniques. It entails no application of fertilizers, no use of chemicals for pest and disease control and minimum conservation measures.
- High-level input/advanced management. Under the advanced management assumption, the farming system is mainly market-oriented; producing producing for the market is a management objective. Production is based on improved varieties and mechanization with low labour intensity. It uses optimum applications of nutrients and chemical pest, disease and weed control.
The management level influences land suitability for a given crop. High-level management can alleviate some of the constraints that low-level management cannot address. Therefore, the extent of land suitable for a given crop under advanced management is usually greater than under limited management. GAEZ also considers two other categories not used in this report: intermediate-level and mixed-level management conditions.
The GAEZ modelling framework uses established land evaluation principles (FAO, 1976) to assess natural resources and determine suitable agricultural land-use options. It examines resource limitations and opportunities by considering the ecophysiological, climatic and soil requirements of different crops. These factors are used to evaluate the suitability and production potential of individual crops under various management conditions (Fischer et al., 2021). Comparing production potential with production statistics allows to calculate yield gaps and identify hotspots for more productive land use.
Georeferenced global climate, soil and terrain data are combined into a land resources database, which is assembled based on global grids, at 5 arc-minute and 30 arc-second resolutions. The land resources are matched with the crop-specific requirements and limitations regarding climate, soil and terrain properties under assumed levels of inputs and different management conditions (low- and high-input management levels).
Climatic data comprise precipitation, temperature, wind speed, sunshine duration and relative humidity. For soil, the agroecological zoning identifies seven soil qualities; these are combined into a crop- and input-specific edaphic suitability rating, which is integrated with information on prevailing terrain-slope conditions.
The GAEZ models provide attainable crop yields for each basic land resources unit under different land utilization types (LUTs). LUTs are generic agricultural production systems defined by crop parameters (e.g. harvest index, maximum rate of photosynthesis, maximum leaf area index), water supply systems (rainfed, irrigated) and levels of inputs and management (ranging from low to high). In this study, land suitability was analysed for four crop groups: cereals; pulses; oil crops; and roots and tubers.
1.2 Methodology to compute yield gaps
The computation of yield gaps in Chapter 3 was done as follows:
- Step 1. Download summary crop tablesac from the GAEZ v5 database for each crop in the selected crop group (cereals; pulses; oil crops; and roots and tubers), by source of water (rainfed/irrigated) and with high-input management level, selecting the area under current cropland.
- Step 2. Compute an average yield by cropland rainfed and cropland irrigated separately, based on the extent of the classes of suitability (i.e. very suitable; suitable; moderately suitable; marginally suitable; very marginally suitable).
- Step 3. Compute average yield values from the cropland rainfed and the cropland irrigated simulations respectively, by country and crop type.
- Step 4. Download FAOSTAT data on area harvested, productions and yields, by country and crop for the period 2001–2020 (FAO, 2025). Compute average values by country and crop over this period, accounting for eventual administrative changes during this period.
- Step 5. Compute an adjusted attainable yield to convert GAEZ v5 values to fresh matter as in FAOSTAT statistics (Equation 1).
Equation 1:
Attainable_yieldadj = GAEZ5 Attainable_yield * 1/ConvFactor
where:
Attainable_yieldadj is the adjusted yield (kg/ha), estimated by crop and country;
GAEZ5 Attainable_yield is the GAEZ v5 yield, estimated by crop and country; and
ConvFactor is the conversion factors (dimensionless), by crop, used to transform GAEZ v5 values (in dry matter) to fresh matter as in FAOSTAT.
The conversion factors for each crop in the four crop groups are derived from Table 9-1, p. 142 of the GAEZ model documentation (Fischer et al., 2021).
- Step 6. Compute differences between attainable and actual yields (in kg/ha).
- Step 7. Compute the yield achievement ratio as the ratio between actual and adjusted attainable yield (in percentage).
- Step 8. Compute the yield gaps as the difference between 1 and the yield achievement ratio (in percentage).
It should be noted that this methodology differs from the yield achievement ratio product, which is computed by GAEZ at pixel level and, at the time of writing, was not yet available for version 5.
1.3 Methodology to assess the impact of climate change on land suitability
The GAEZ v5 update, used here, includes the most recent global data on land cover and land use, soil, elevation, protected areas, and climatic conditions for the historical period 1981–2020. It uses AgERA5-derived products provided by the Copernicus programme (C3S, 2023), together with a selection of climate simulations using up-to-date models from the Coupled Model Intercomparison Project 6ad in IPCC (2023) for three SSPs. Shared Socioeconomic Pathways are a set of scenarios used to describe possible future socioeconomic developments. They are designed to explore how global society, demographics and economics might evolve over the twenty-first century, affecting greenhouse gas emissions and climate change (IPCC, 2023). The IPCC Sixth Assessment Report assesses the climate response to five illustrative scenarios covering the range of possible future development of human-induced climate change from the literature. These scenarios are labelled according to their expected radiative forcing values by 2100 (e.g. RCP2.6, RCP4.5, RCP7 and RCP8.5) and correspond to different levels of greenhouse gas emissions and global warming outcomes.
TABLE A.1 SHARED SOCIOECONOMIC PATHWAYS IN THE IPCC SIXTH ASSESSMENT REPORT
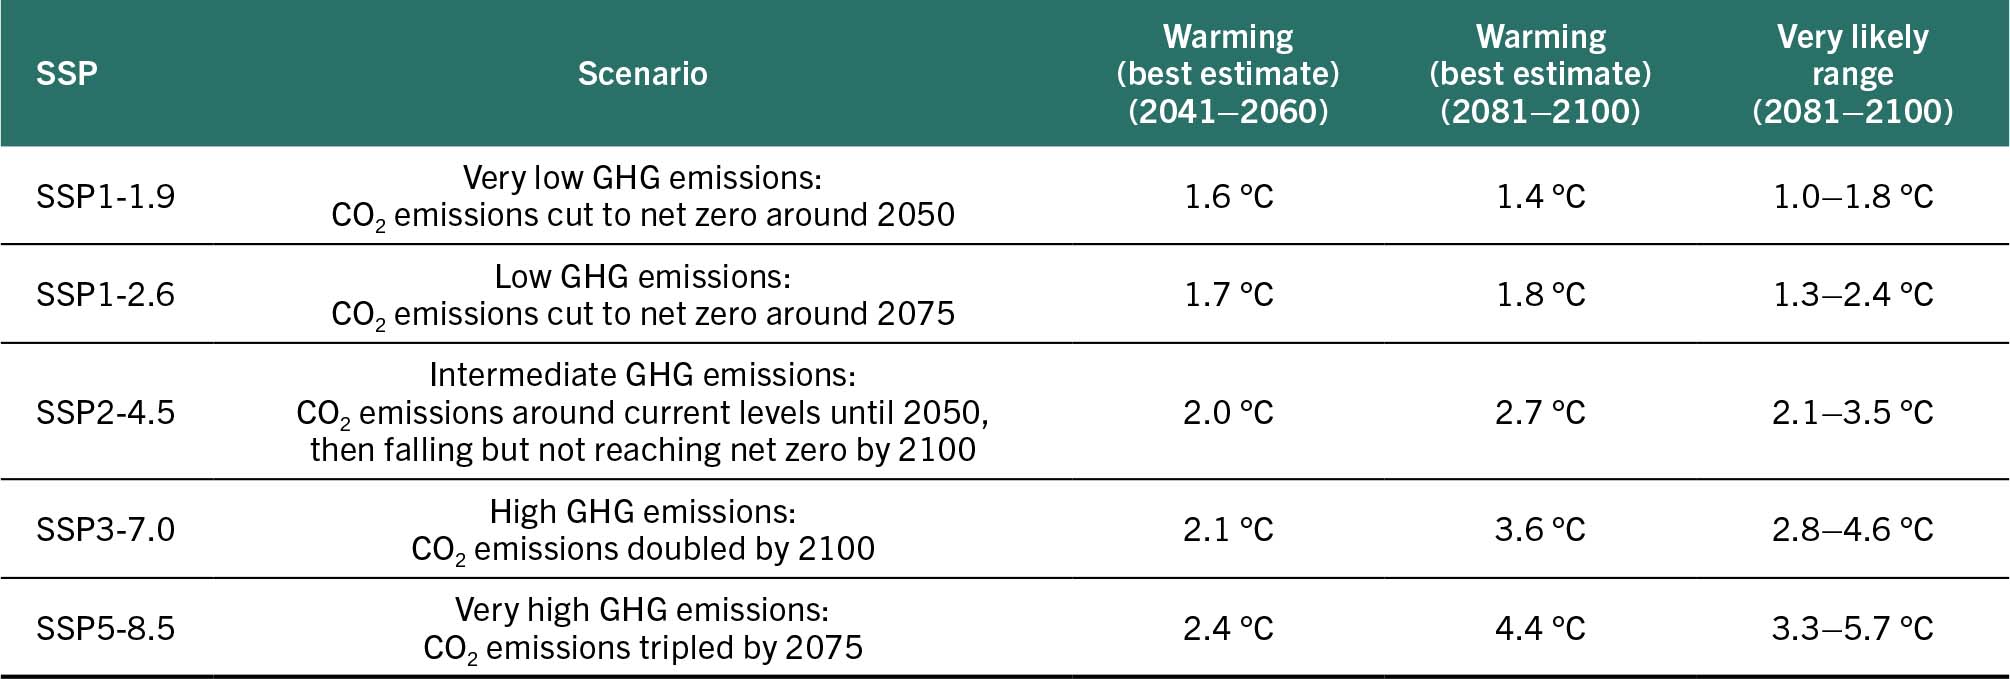
SOURCE: IPCC. 2023. Sections. In: H. Lee & J. Romero, eds. Climate Change 2023: Synthesis Report. Contribution of Working Groups I, II and III to the Sixth Assessment Report of the Intergovernmental Panel on Climate Change. Geneva, Switzerland. https://doi.org/10.59327/IPCC/AR6-9789291691647.001
Climate change is expected to increasingly impact land suitability. Using the most advanced tools available, such as general circulation models, it is now possible to compare current land suitability under baseline climate conditions (averaged from the period 2001–2020) with those under different climate scenarios. In this report, GAEZ v5 estimates of suitable land for four selected crops during the historical period 2001–2020 were compared with projected land suitability derived from an ensemble of five climate change models. The results are elaborated in Chapter 3.
More information on GAEZ v5 data and methodology, including on simulations under different climate scenarios, is available at: https://www.fao.org/gaez/en.
2. Regional aggregations
TABLE A.2 COUNTRY COMPOSITION OF THE REGIONS AND SUBREGIONS IN THE REPORT
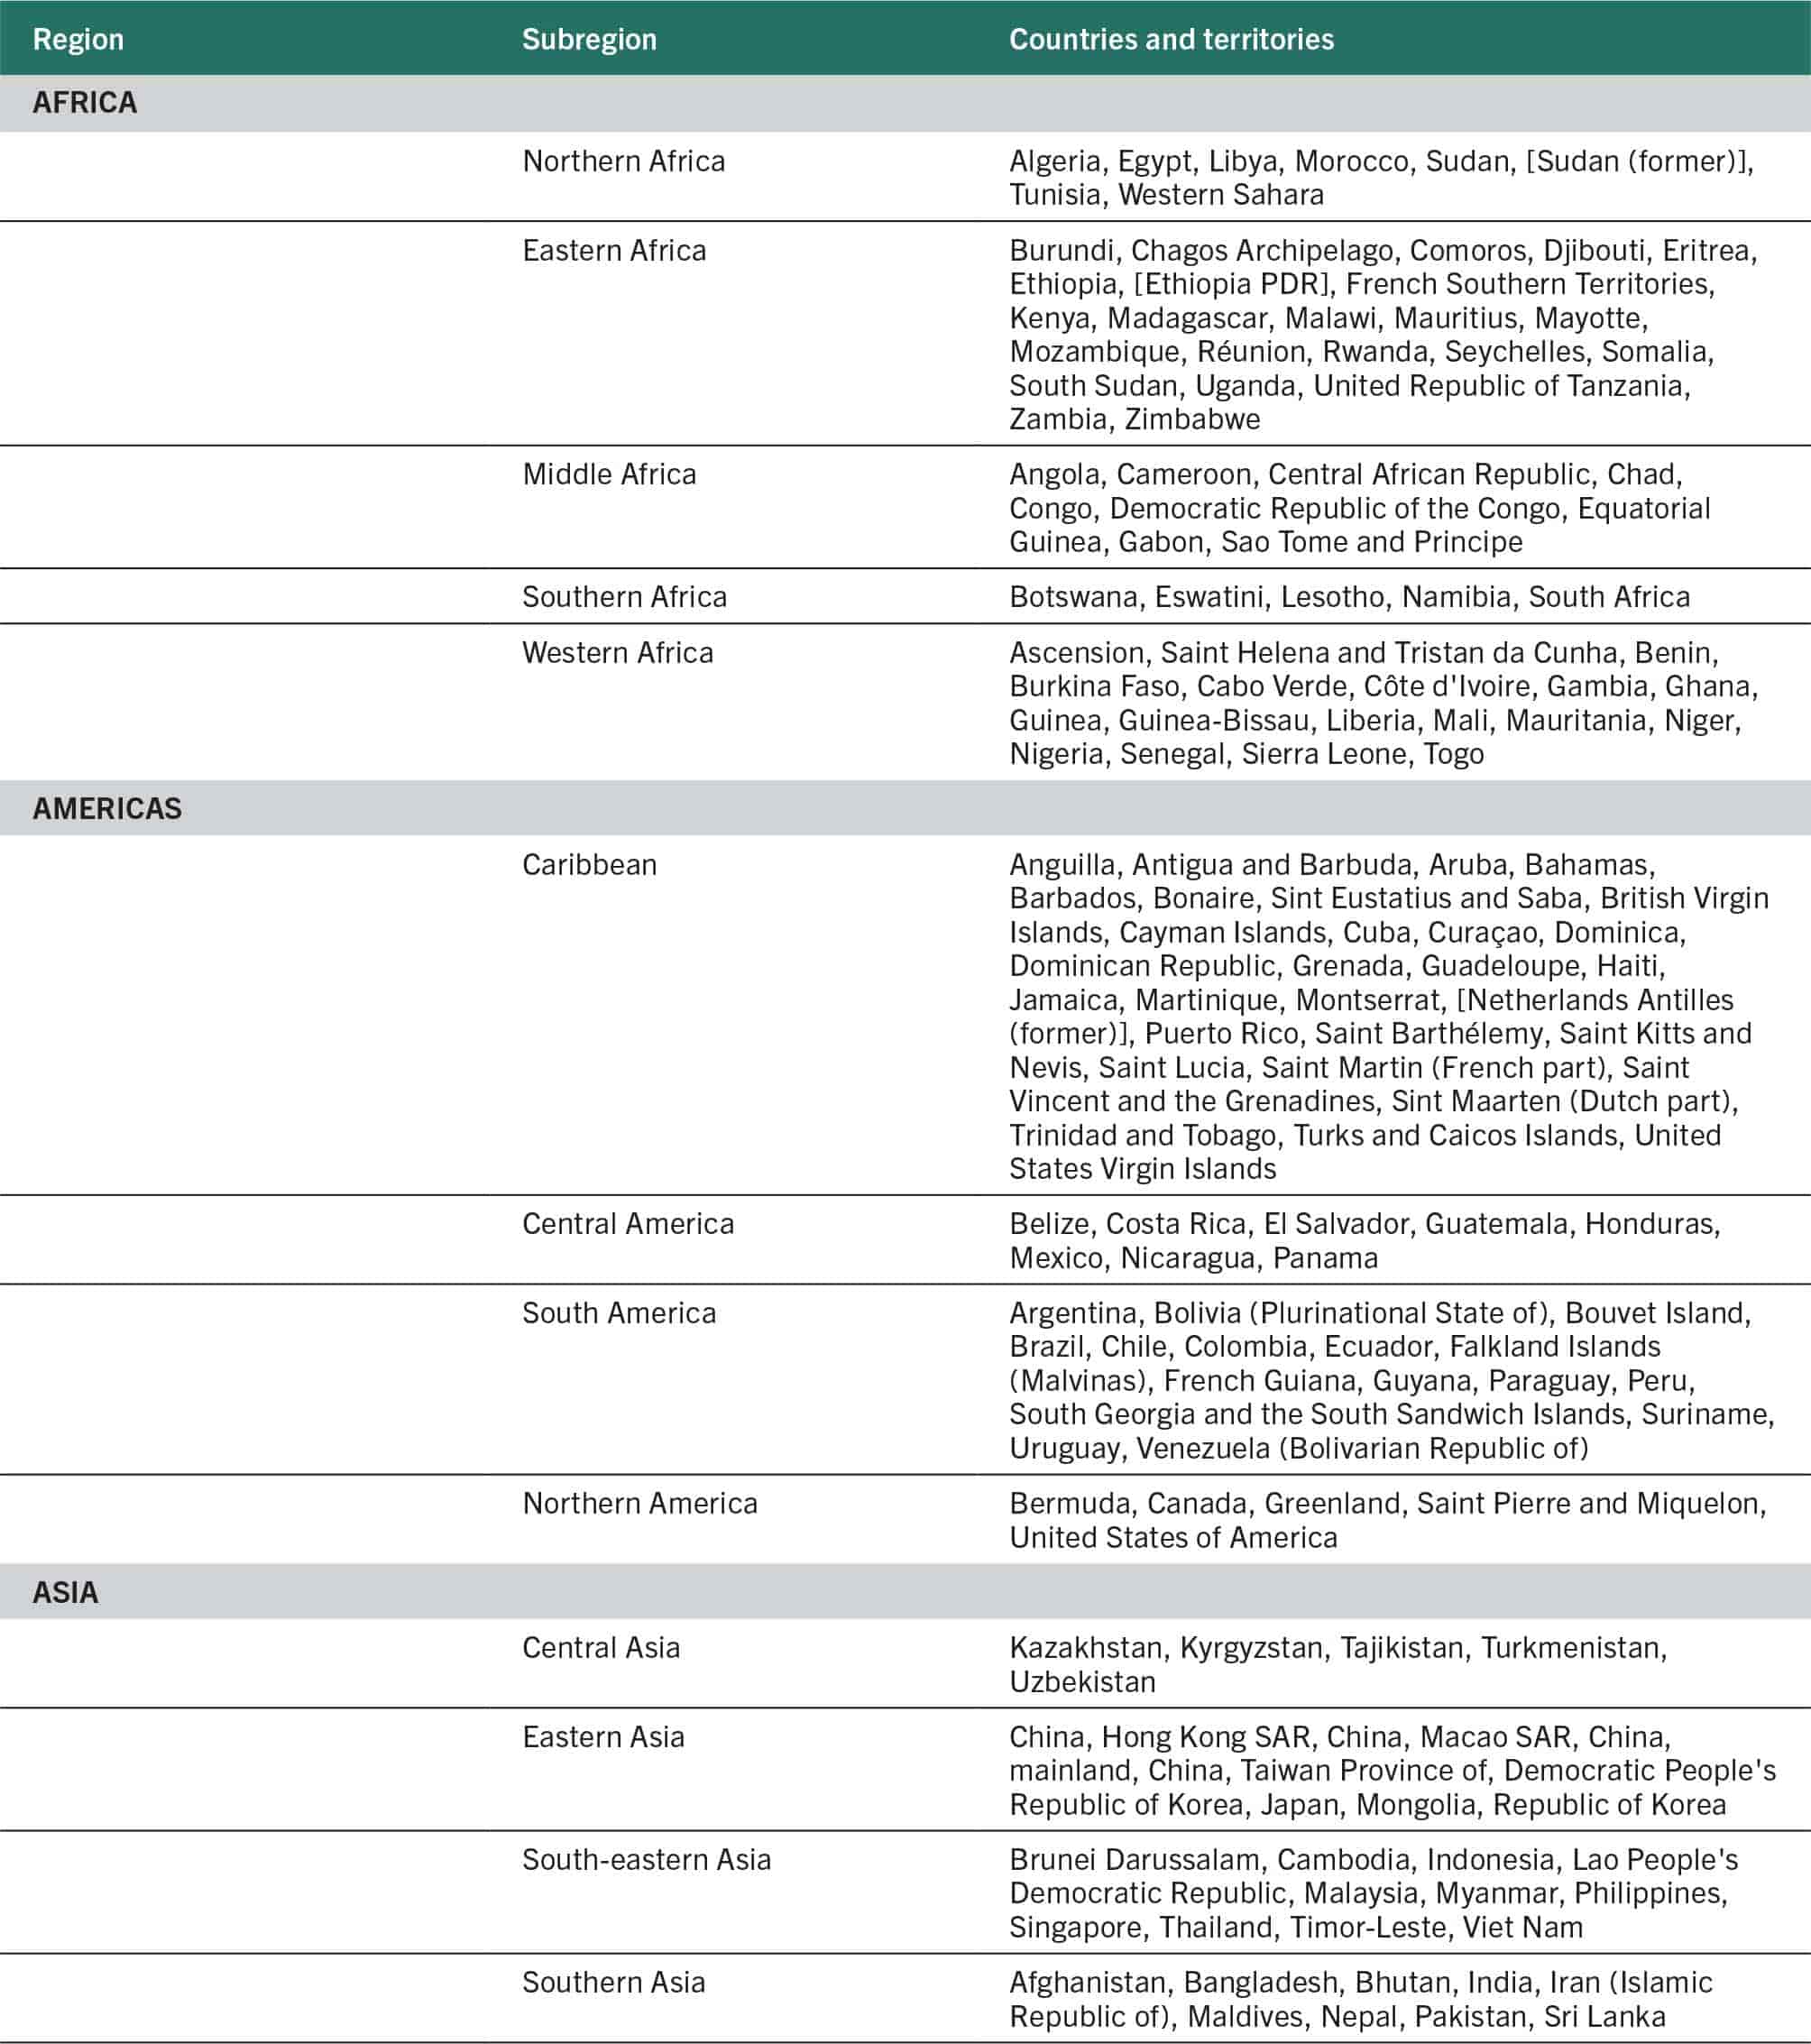
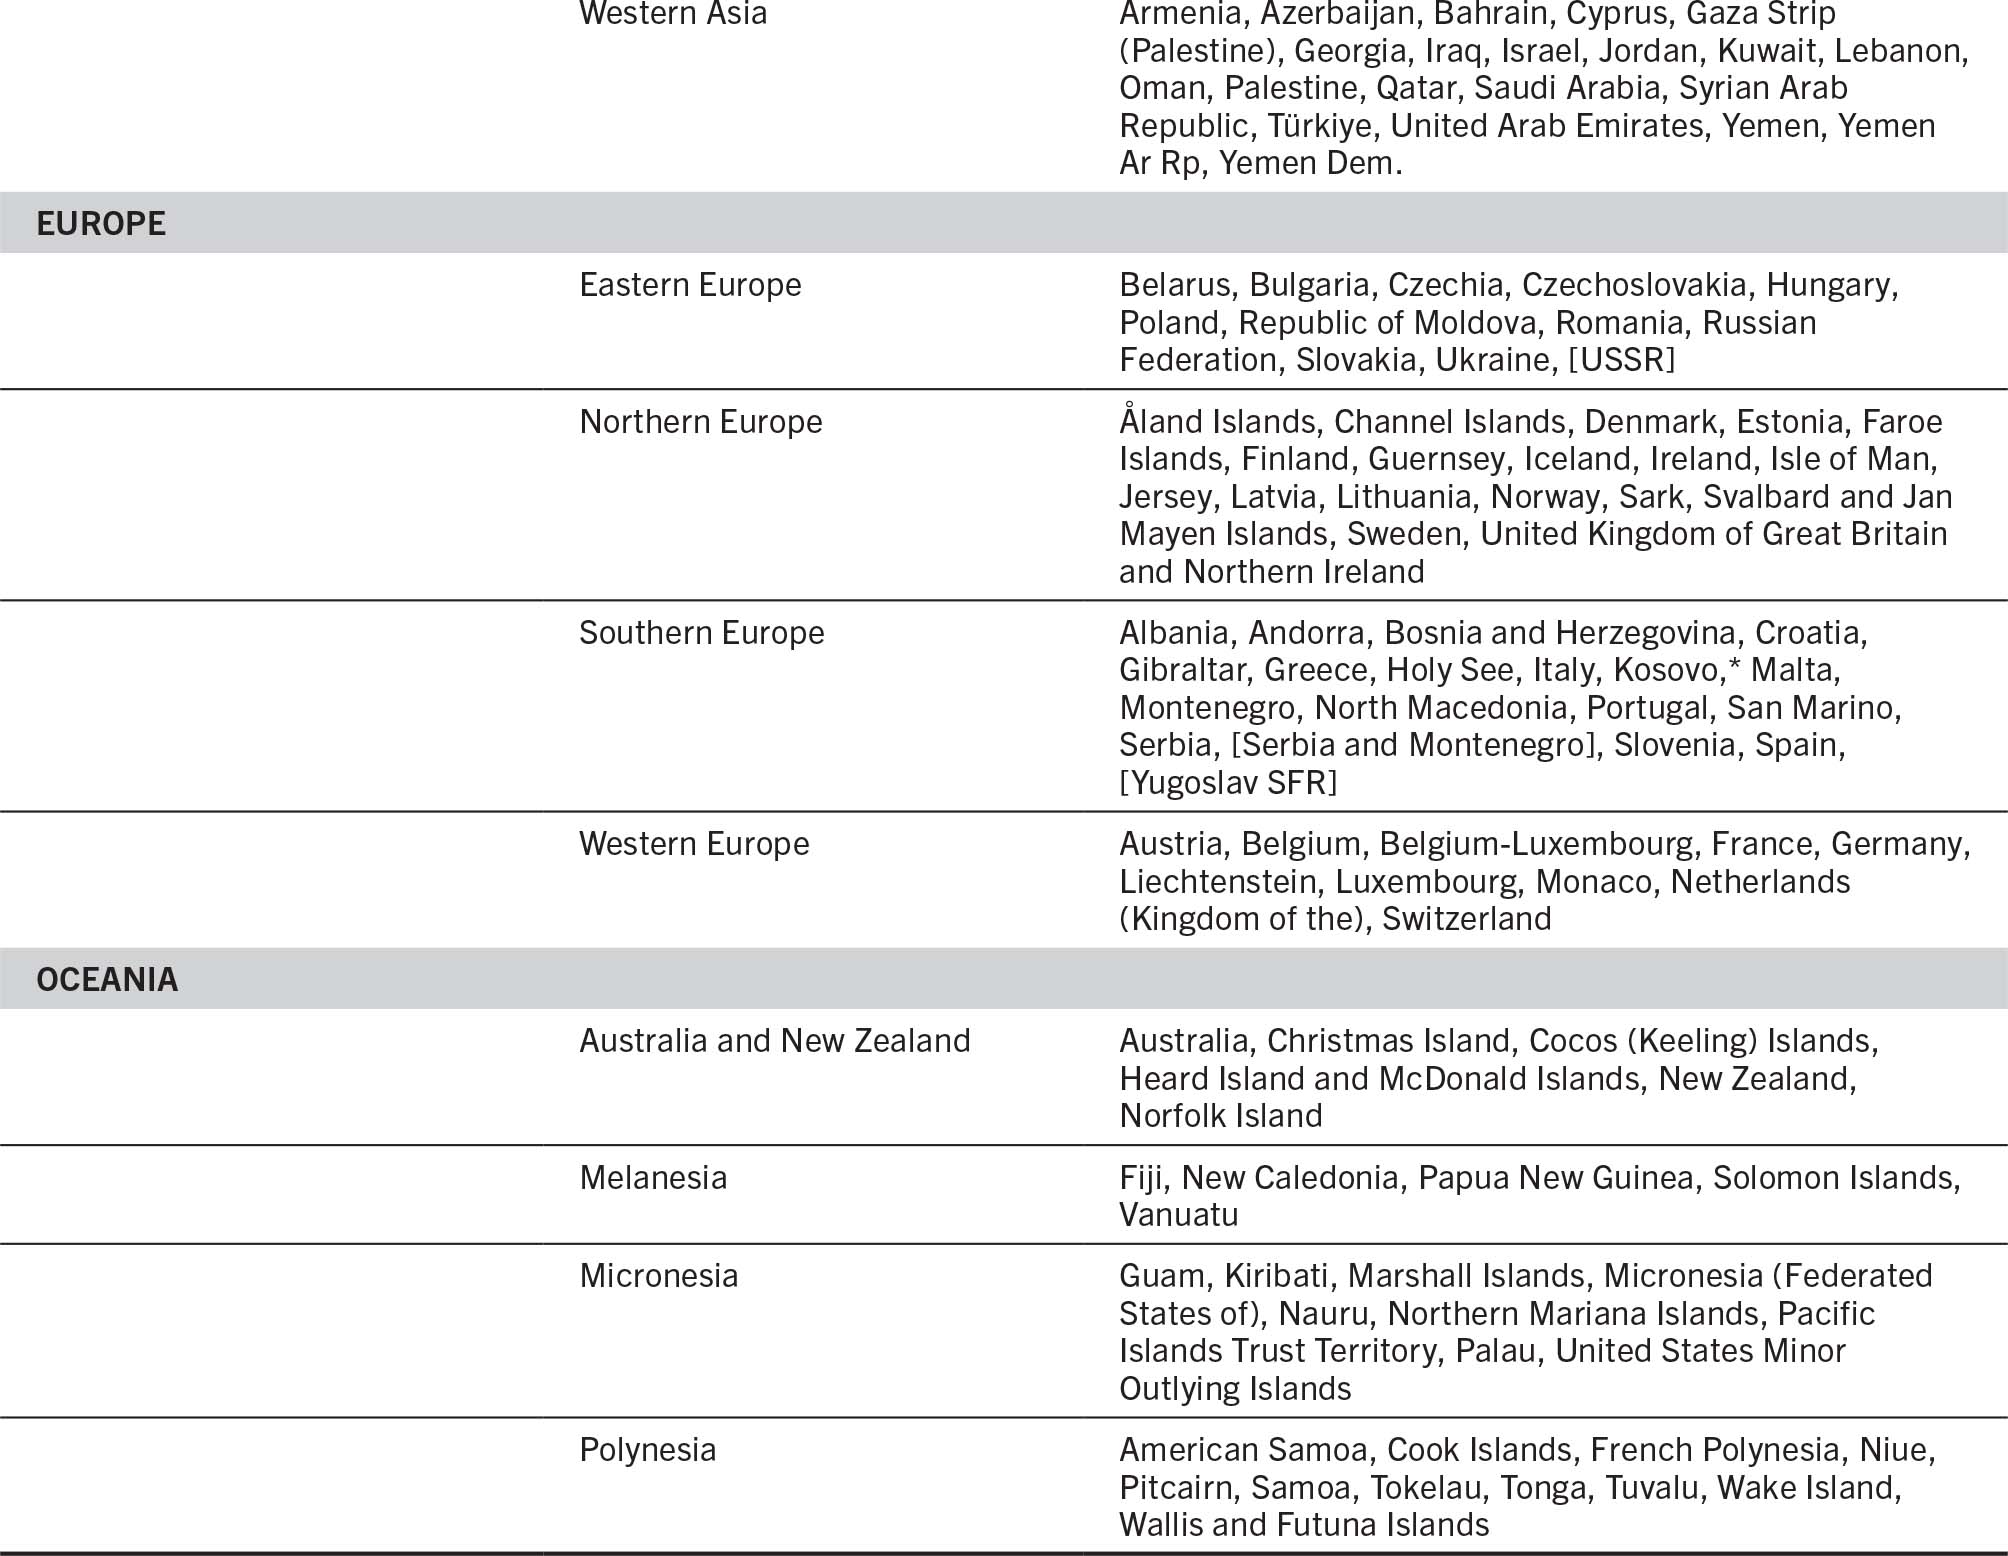
SOURCE: Authors’ own elaboration with regional and subregional aggregations based on FAO. 2025. FAOSTAT: Definitions and Standards. [Accessed on 7 May 2025]. https://www.fao.org/faostat/en/#definitions. Licence: CC-BY-4.0.


