

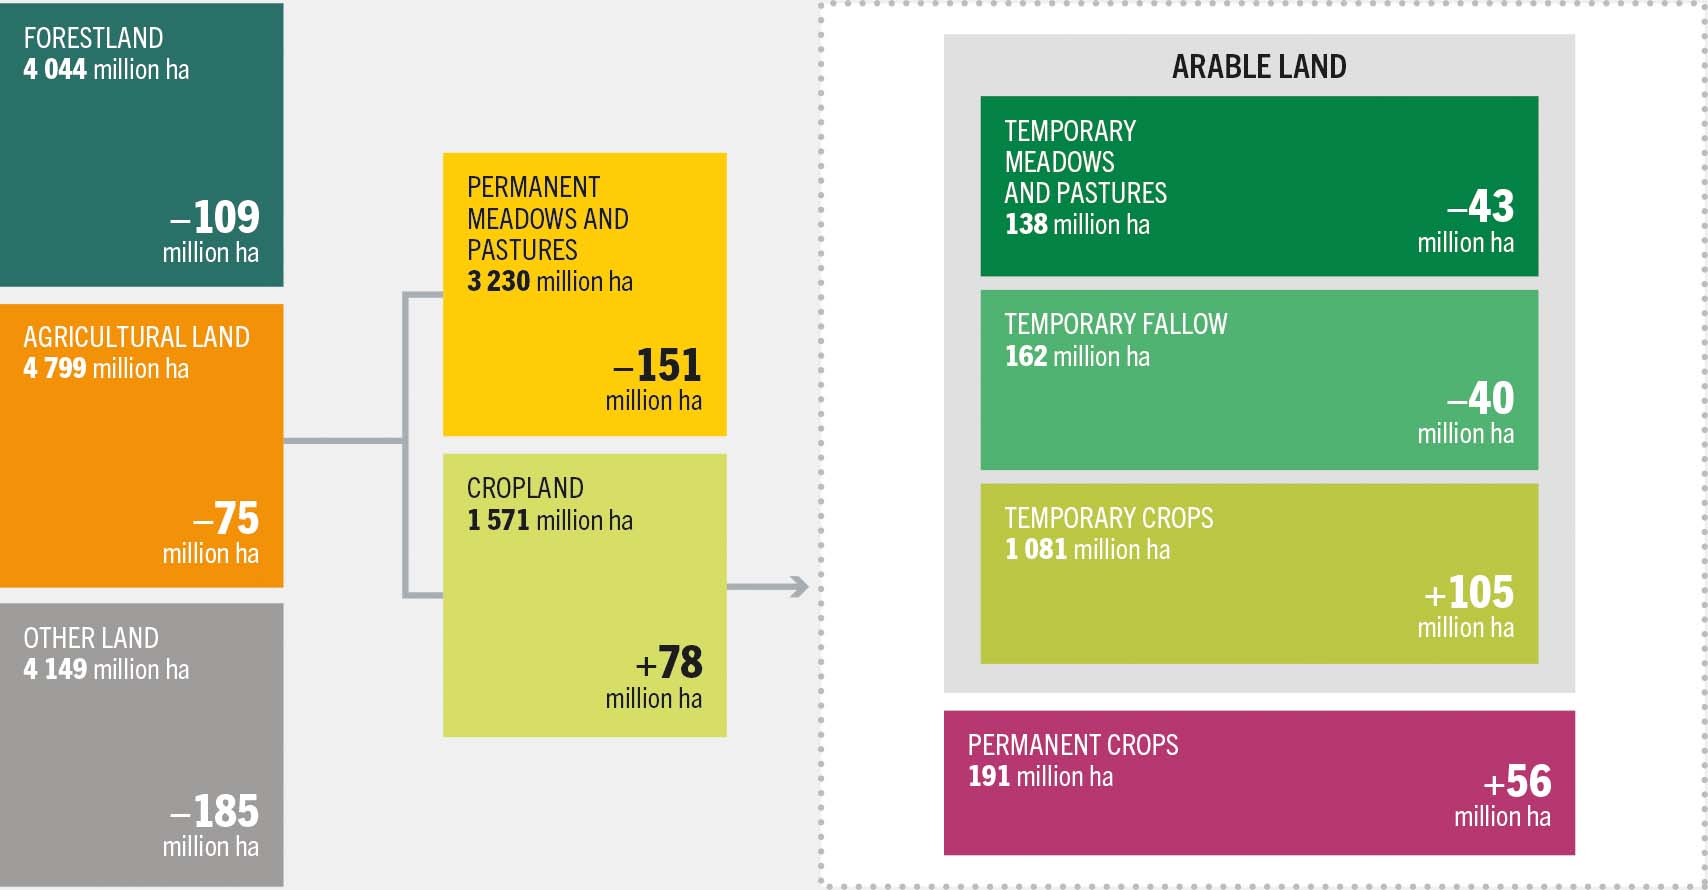
In 2023, agricultural land occupied more than one-third of the world’s land area, amounting to approximately 4.8 billion ha (FAO, 2025a).d This area was divided into cropland, and permanent meadows and pastures, constituting about one-third and two-thirds of agricultural land, respectively. These two components have exhibited changes in opposite directions: cropland increased by approximately 78 Mha, representing a 5 percent increase between 2001 and 2023, while the area used for pastures declined by 151 Mha, a 4 percent decrease over the same period. As a result, the total agricultural land area has decreased marginally since 2001 (FAO, 2025a).
According to FAO land-use definitions, cropland is further divided into arable land and permanent crops, which accounted for 1 381 and 191 Mha, respectively, in 2023. Arable land is land used for the cultivation of temporary crops – crops with an annual cycle – such as wheat and maize, in rotation with fallow land and temporary pastures in management cycles of up to five years. The interplay of these components over time determines the patterns of land-use change (see Figure 7).
Figure 7 Components of the world’s land use and net changes, 2001–2023
Within cropland, the net expansion of arable land is typically driven by the increase in temporary crops and is often accompanied by a reduction in the area left fallow (see Figure 8).
Figure 8 Net change in cropland area by region and land-use component, 2001–2023
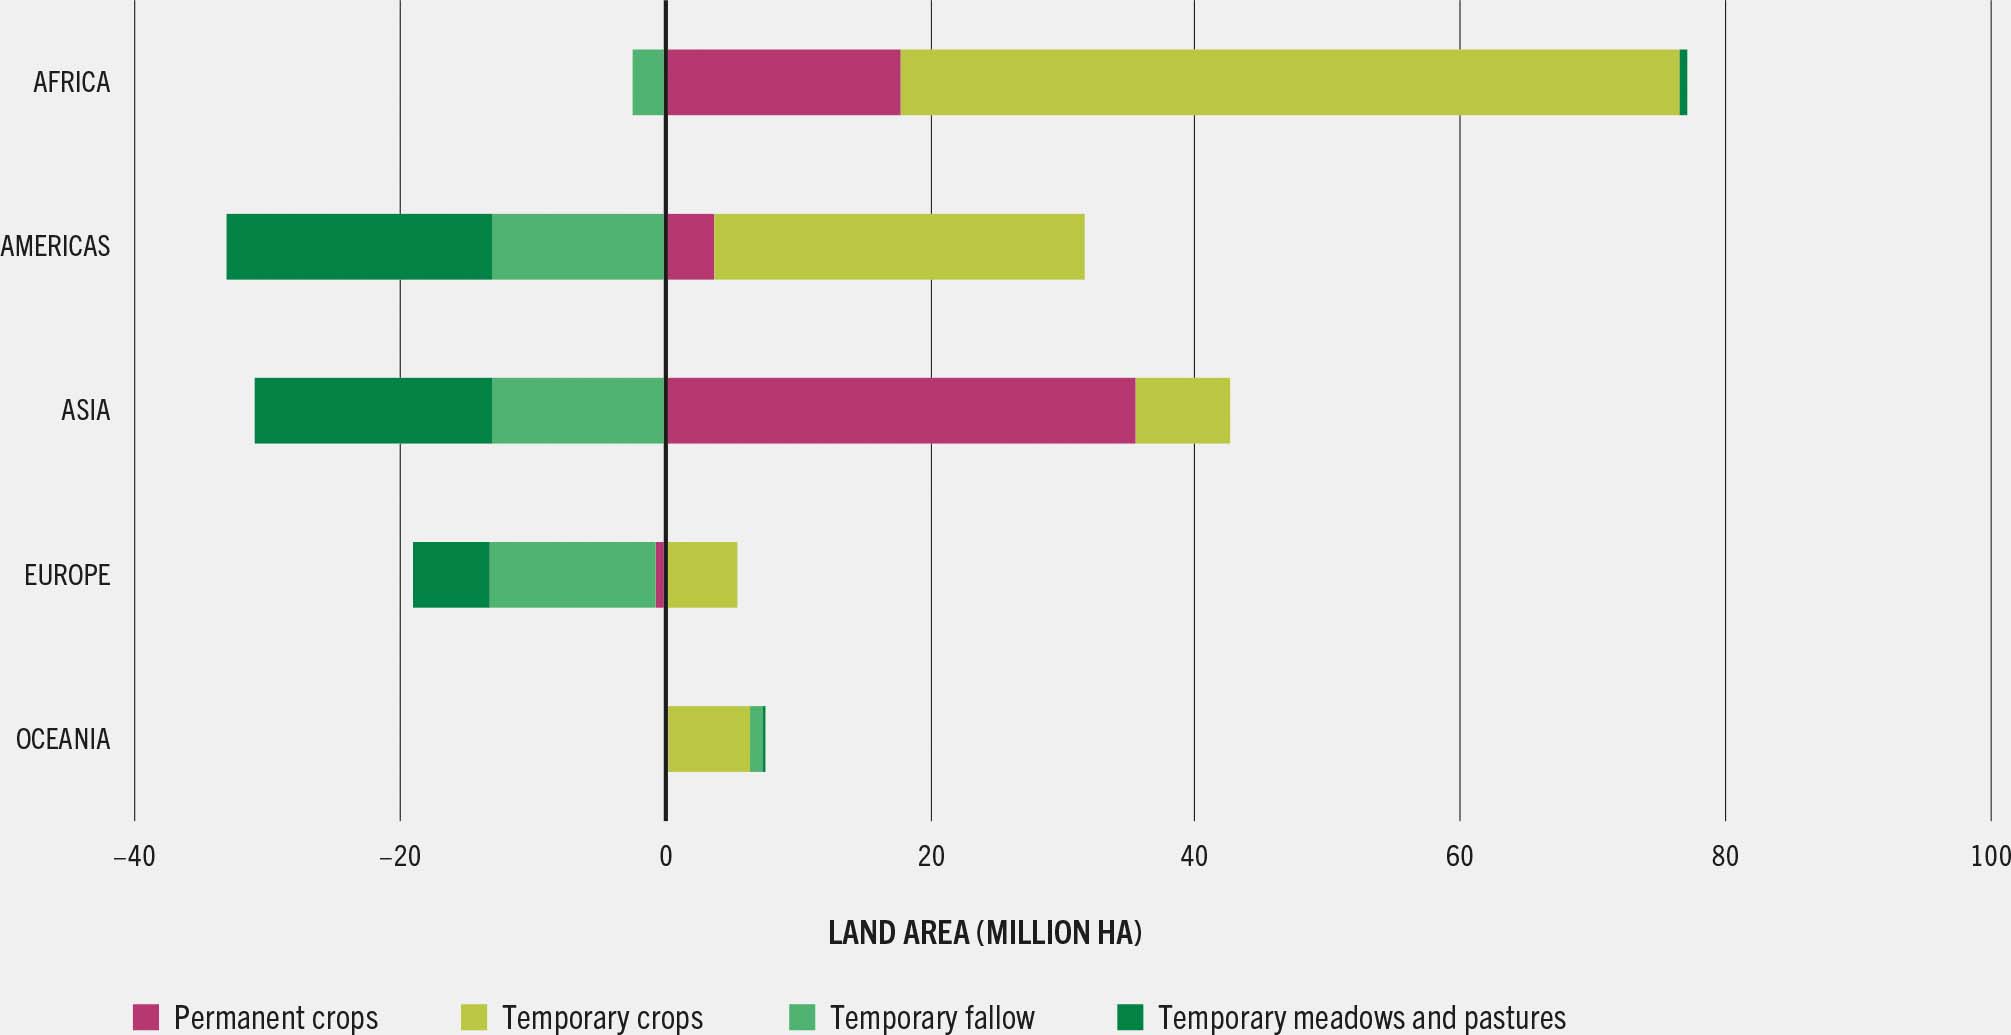
Across regions, increases in arable land were recorded in Africa (+28 percent, corresponding to an additional 57 Mha) and Oceania (+28 percent, +7 Mha), while the other regions exhibited marginal reductions. All regions except Oceania exhibited a decline in the area left fallow. In Africa, more than elsewhere, this reduction was accompanied by a significant increase in the area under temporary crops (+38 percent, +59 Mha). Across the subregions, Middle Africa (+56 percent, +12.5 Mha), Eastern Africa (+45 percent, +22 Mha), Australia and New Zealand (+28 percent, +7 Mha) and South America (+28 percent, +27 Mha) had the largest proportional growth in arable land. By contrast, Central and Northern America, Southern and Eastern Europe, and Eastern Asia recorded a net reduction in arable land between 2001 and 2023. In Eastern Europe, the increase in temporary crops was counterbalanced by a reduction in temporary fallow and pastures, resulting in a marginal decrease in total arable land (FAO, 2025a).
Permanent crops, including oil palm, coffee, tea and other tree crops, increased by 42 percent or 56 Mha between 2001 and 2023 in all regions and subregions of the world except Europe. In most cases, these crops serve the global market. The largest proportional increments were recorded in Middle and Western African and Eastern and South-eastern Asia.
According to FAO, human activities have already degraded 1 660 Mha of land due to unsustainable land-use practices (FAO, 2021). More than 60 percent of this degradation occurs on agricultural lands, including both cropland and pastureland (FAO, 2021, 2025b; Ziadat et al., 2025).
In the past 40 years, on a global scale, droughts have impacted people more than any other natural disaster. About 128 Mha (11 percent) of rainfed cropland (see Figure 9) and 656 Mha (14 percent) of pastureland (see Figure 10) frequently experience droughts (FAO, 2020). The intensity, duration, frequency and spatial extent of droughts are expected to increase due to climate change and rising temperatures. This will translate into an even greater burden on farmers if land degradation is not halted and reversed. Reports to the UNCCD from more than 100 countries revealed that 1.84 billion people were affected by droughts in the 2022–2023 biennium (UNCCD, 2023).
Figure 9 Historical drought frequency on rainfed cropland, 1984–2023
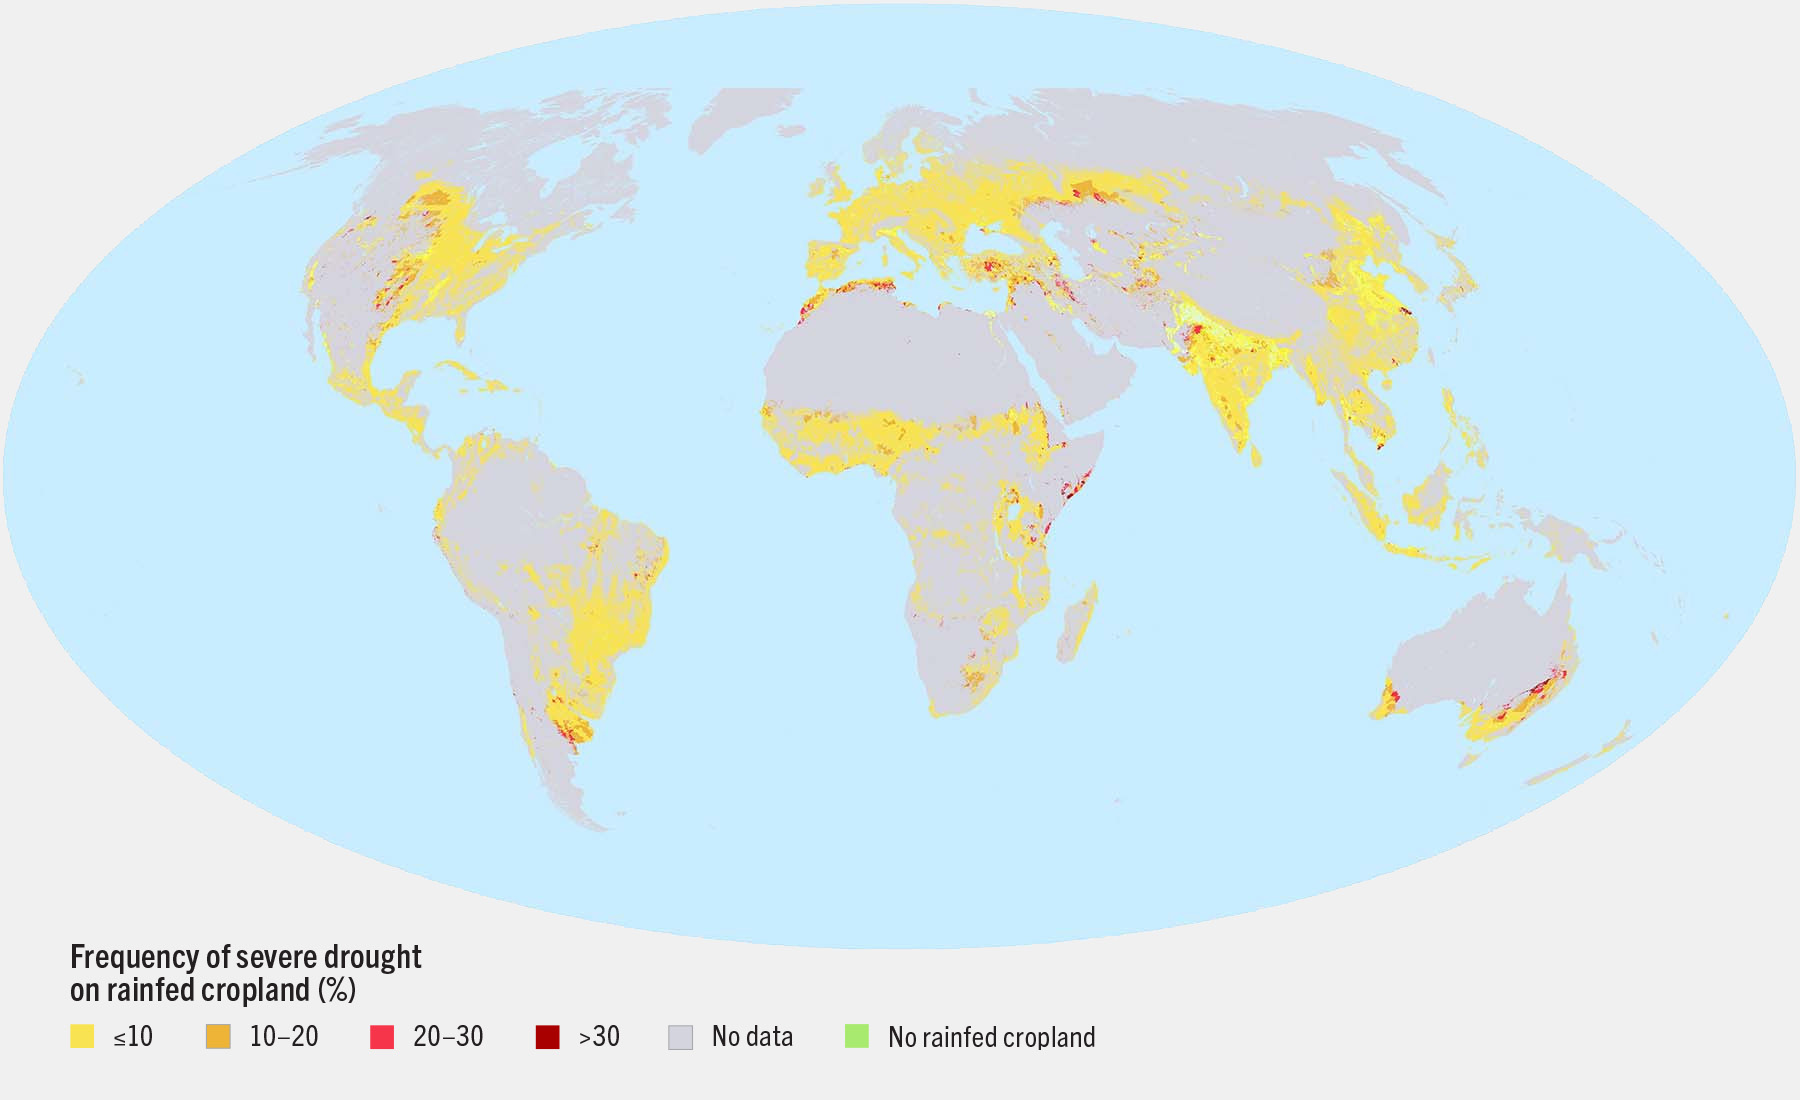
SOURCES: Authors’ own elaboration based on the methodology in FAO. 2020. The State of Food and Agriculture 2020 – Overcoming water challenges in agriculture. Rome. https://doi.org/10.4060/cb1447en; data from Historic agricultural drought frequency (Global – 1 km) – FAO ASIS. [Accessed on 23 July 2025]. https://data.apps.fao.org/catalog/iso/f8568e67-46e7-425d-b779-a8504971389b. Licence: CC BY-SA 4.0.
Figure 10 Historical drought frequency on rainfed pastureland, 1984–2023
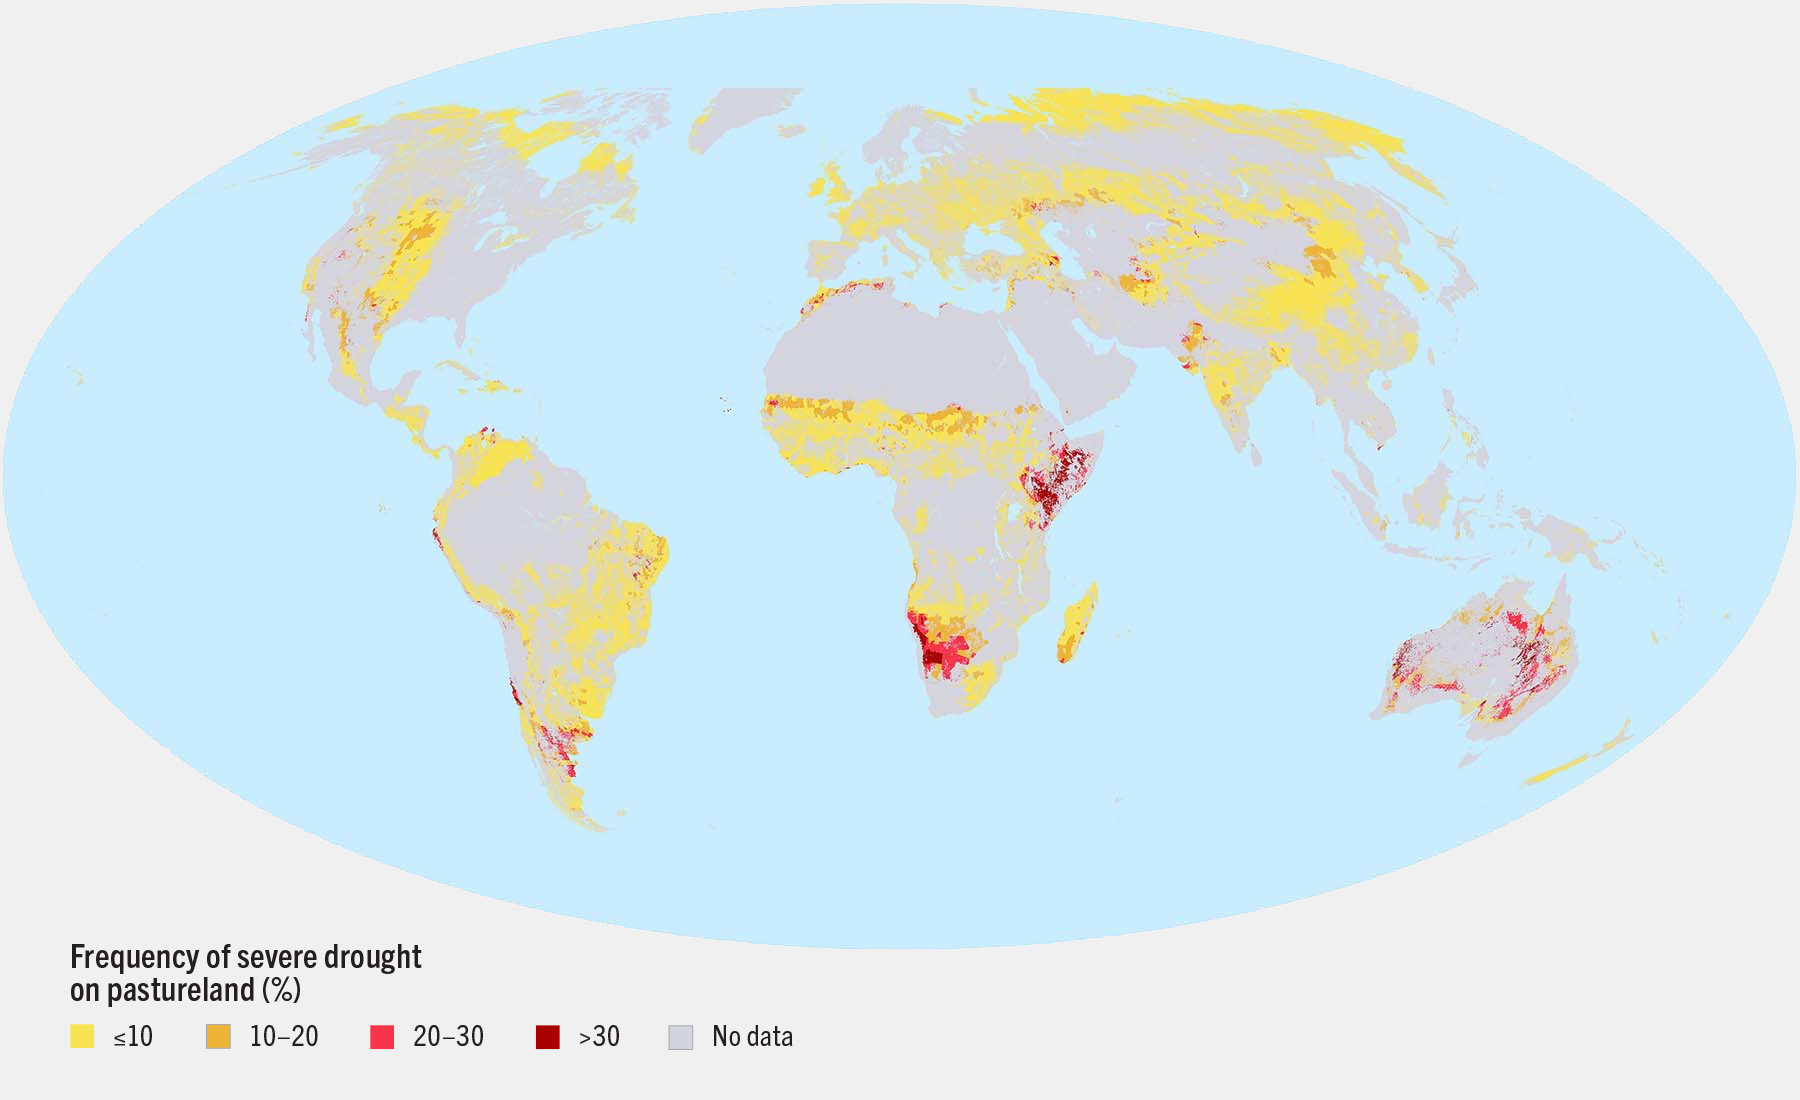
SOURCES: Authors’ own elaboration based on the methodology in FAO. 2020. The State of Food and Agriculture 2020 – Overcoming water challenges in agriculture. Rome. https://doi.org/10.4060/cb1447en; data from Historic agricultural drought frequency (Global – 1 km) – FAO ASIS. [Accessed on 23 July 2025]. https://data.apps.fao.org/catalog/iso/f8568e67-46e7-425d-b779-a8504971389b. Licence: CC BY-SA 4.0.


