

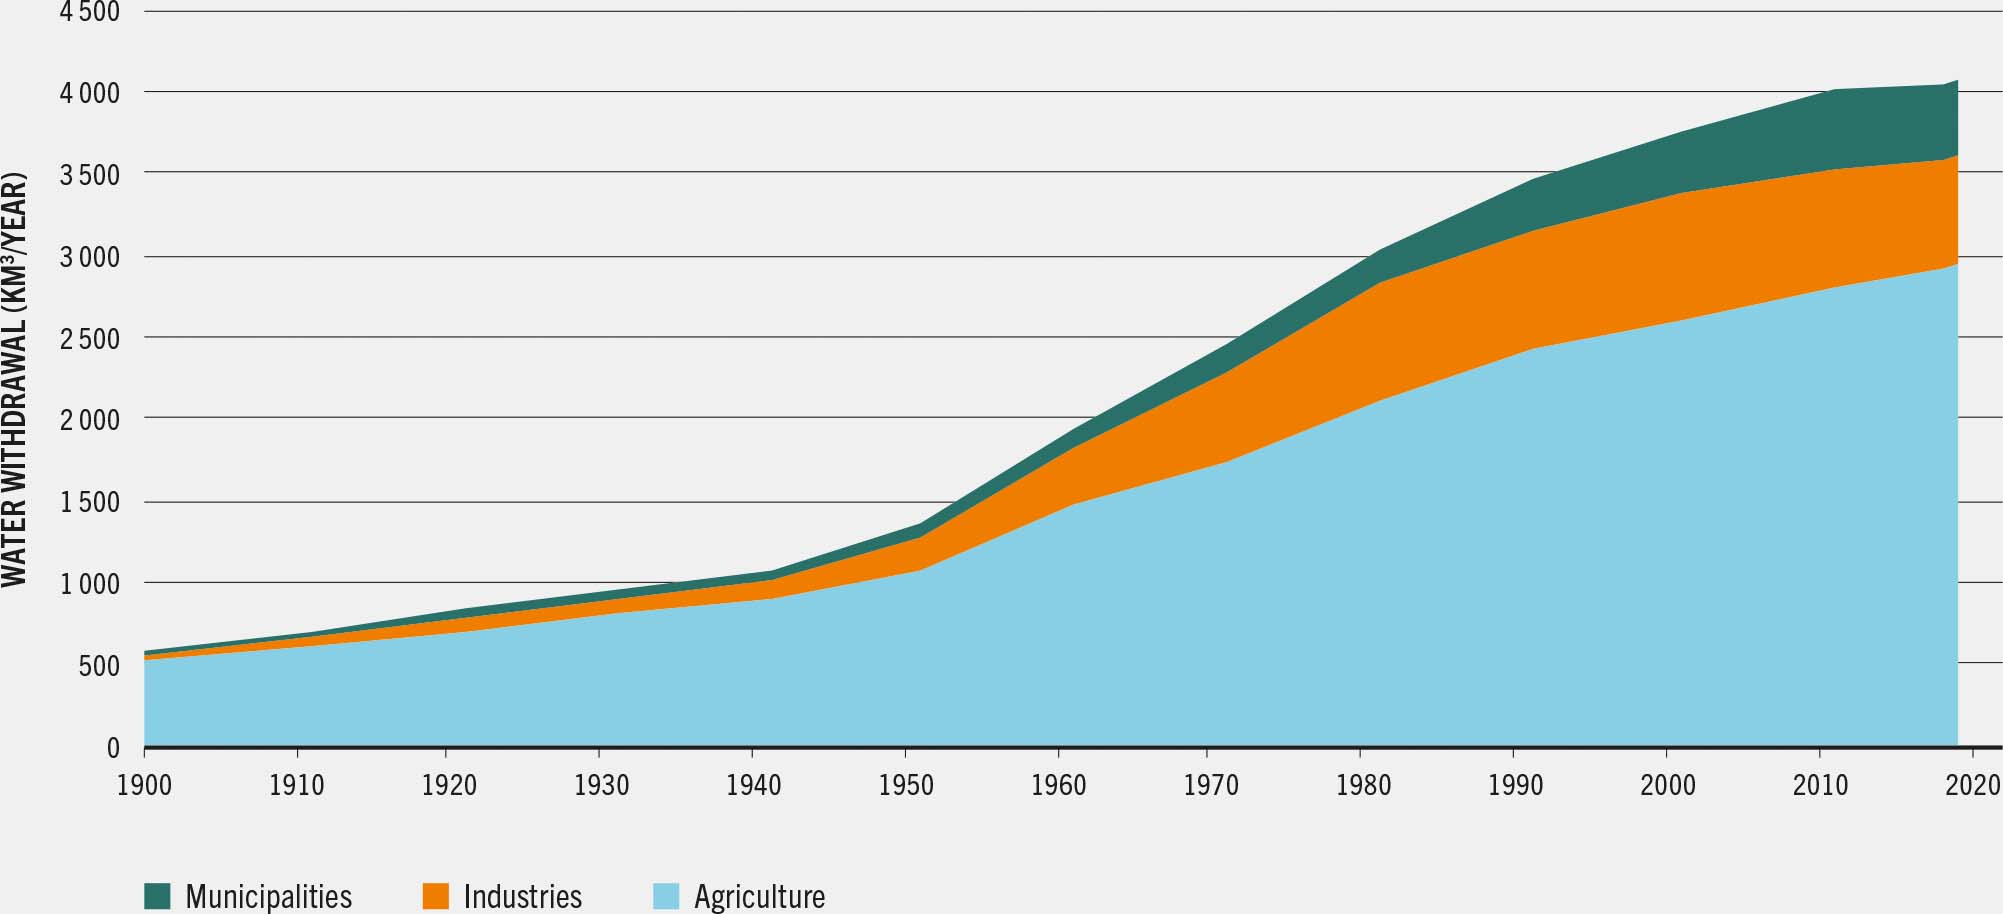
Globally, agriculture is the dominant sector in terms of freshwater withdrawals, representing 72 percent of total freshwater withdrawals in 2020, followed by the industrial sector at 16 percent and the service sector at 12 percent (FAO, 2020; Figure 13). While overall growth in water withdrawal is slowing, agricultural water withdrawal continues to rise, reflecting the continuous increase in areas under irrigation. The rapid rise in levels of water withdrawal over the past decades has resulted in a growing number of regions becoming subject to increased water stress.
Figure 13 Evolution of global sectoral water withdrawals, 1900–2020
Approximately 1.2 billion people, or about one-sixth of the global population, live in agricultural areas with severe water constraints. (FAO, 2020).
In Southern Asia, about 520 million people live in agricultural areas with severe water constraints, while in Eastern and South-eastern Asia, the number is approximately 460 million. This means that in both regions more than 40 percent of rural people live in areas with water constraints. In Central Asia, Northern Africa and Western Asia, around 20 percent of the population live in areas with significant water shortages or scarcity. By contrast, only 1 to 4 percent of the population in Europe, Latin America and the Caribbean, Northern America and Oceania face extreme water constraints. In sub-Saharan Africa, about 5 percent of the population live in affected areas, primarily due to severe droughts and lack of irrigation infrastructure. Although 5 percent might seem a small share, it translates into roughly 50 million people living in areas where severe droughts have devastating impacts on cropland and pastureland (FAO, 2020).
It is estimated that 171 million ha – more than 60 percent of irrigated croplands – are under high or very high levels of water stress (see Figure 14).
Figure 14 SDG Indicator 6.4.2 – Level of water stress on irrigated areas, 2018
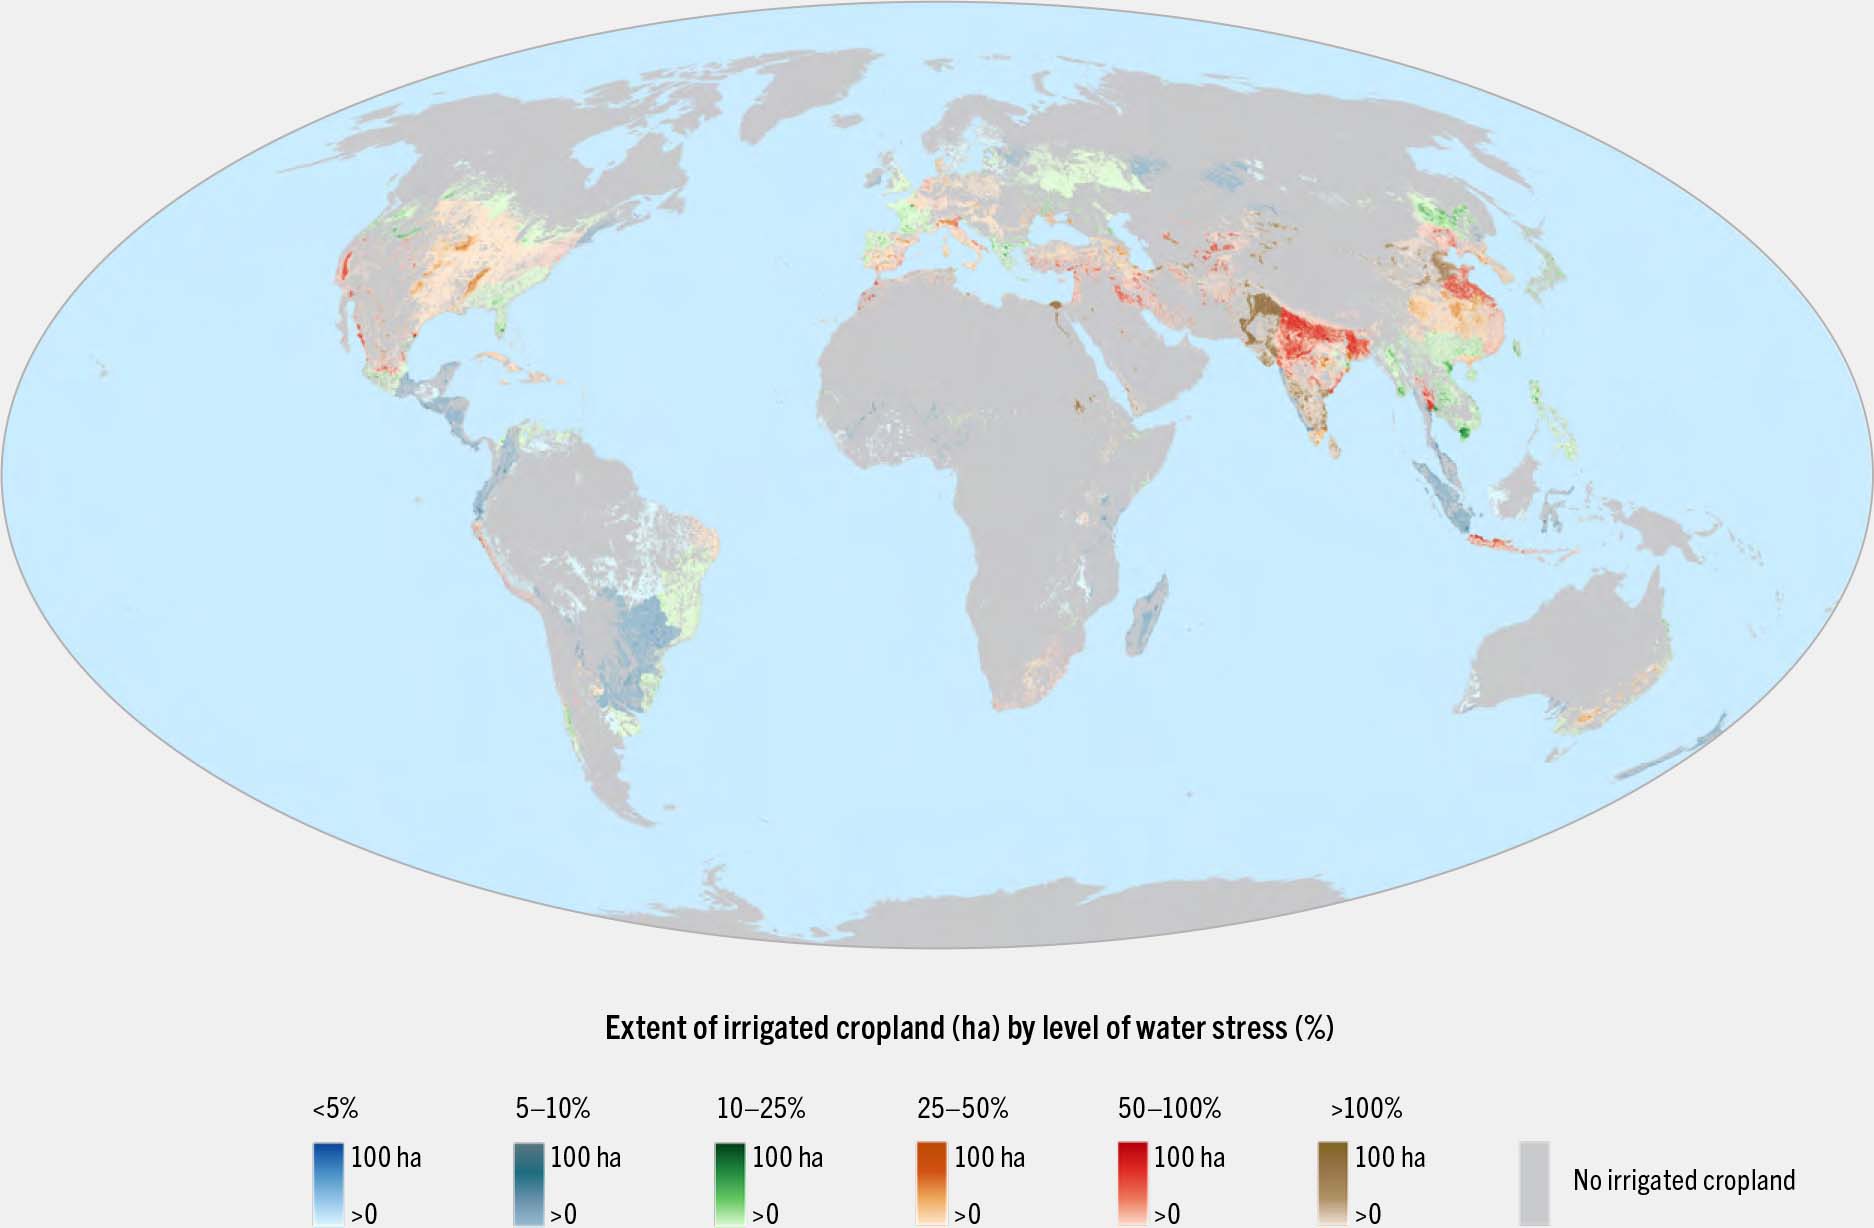
SOURCES: Authors’ own elaboration based on methodology from FAO. 2020. The State of Food and Agriculture 2020 – Overcoming water challenges in agriculture. Rome. https://doi.org/10.4060/cb1447en; data from Level of water stress (SDG 6.4.2) by major river basin (reference year 2018). [Accessed on 1 August 2025]. https://data.apps.fao.org/catalog/iso/40bc32f6-1467-44ac-8f7c-3d67cbb1cbd7. Licence: CC-BY-NC-SA 3.0 IGO.
To satisfy the needs of a growing and increasingly wealthy world population with changing diets (including more meat) and meet the increased demand for feeds and other agricultural products – accompanied by growing quantities of convenience food and, most likely, more food waste at the consumer level – agriculture will require more water than it currently uses. Evapotranspiration from irrigated land was estimated at 1 285 km³ and could increase by 20 to 30 percent by 2050, taking into account both biophysical effects such as climate change and the above-mentioned socioeconomic factors. The increase in water withdrawals for agriculture will probably be less than the expected increase in evapotranspiration – since irrigation efficiencies and land and water productivity will likely increase significantly. However, this will require a combination of technological and managerial solutions, and an enabling policy and governance environment. These solutions are discussed in Chapter 4 and Chapter 5.


