There are three ways to increase crop production: expanding areas under production, increasing crop yields, and increasing cropping intensity;e the latter two also contribute to intensification (more production per unit of land).
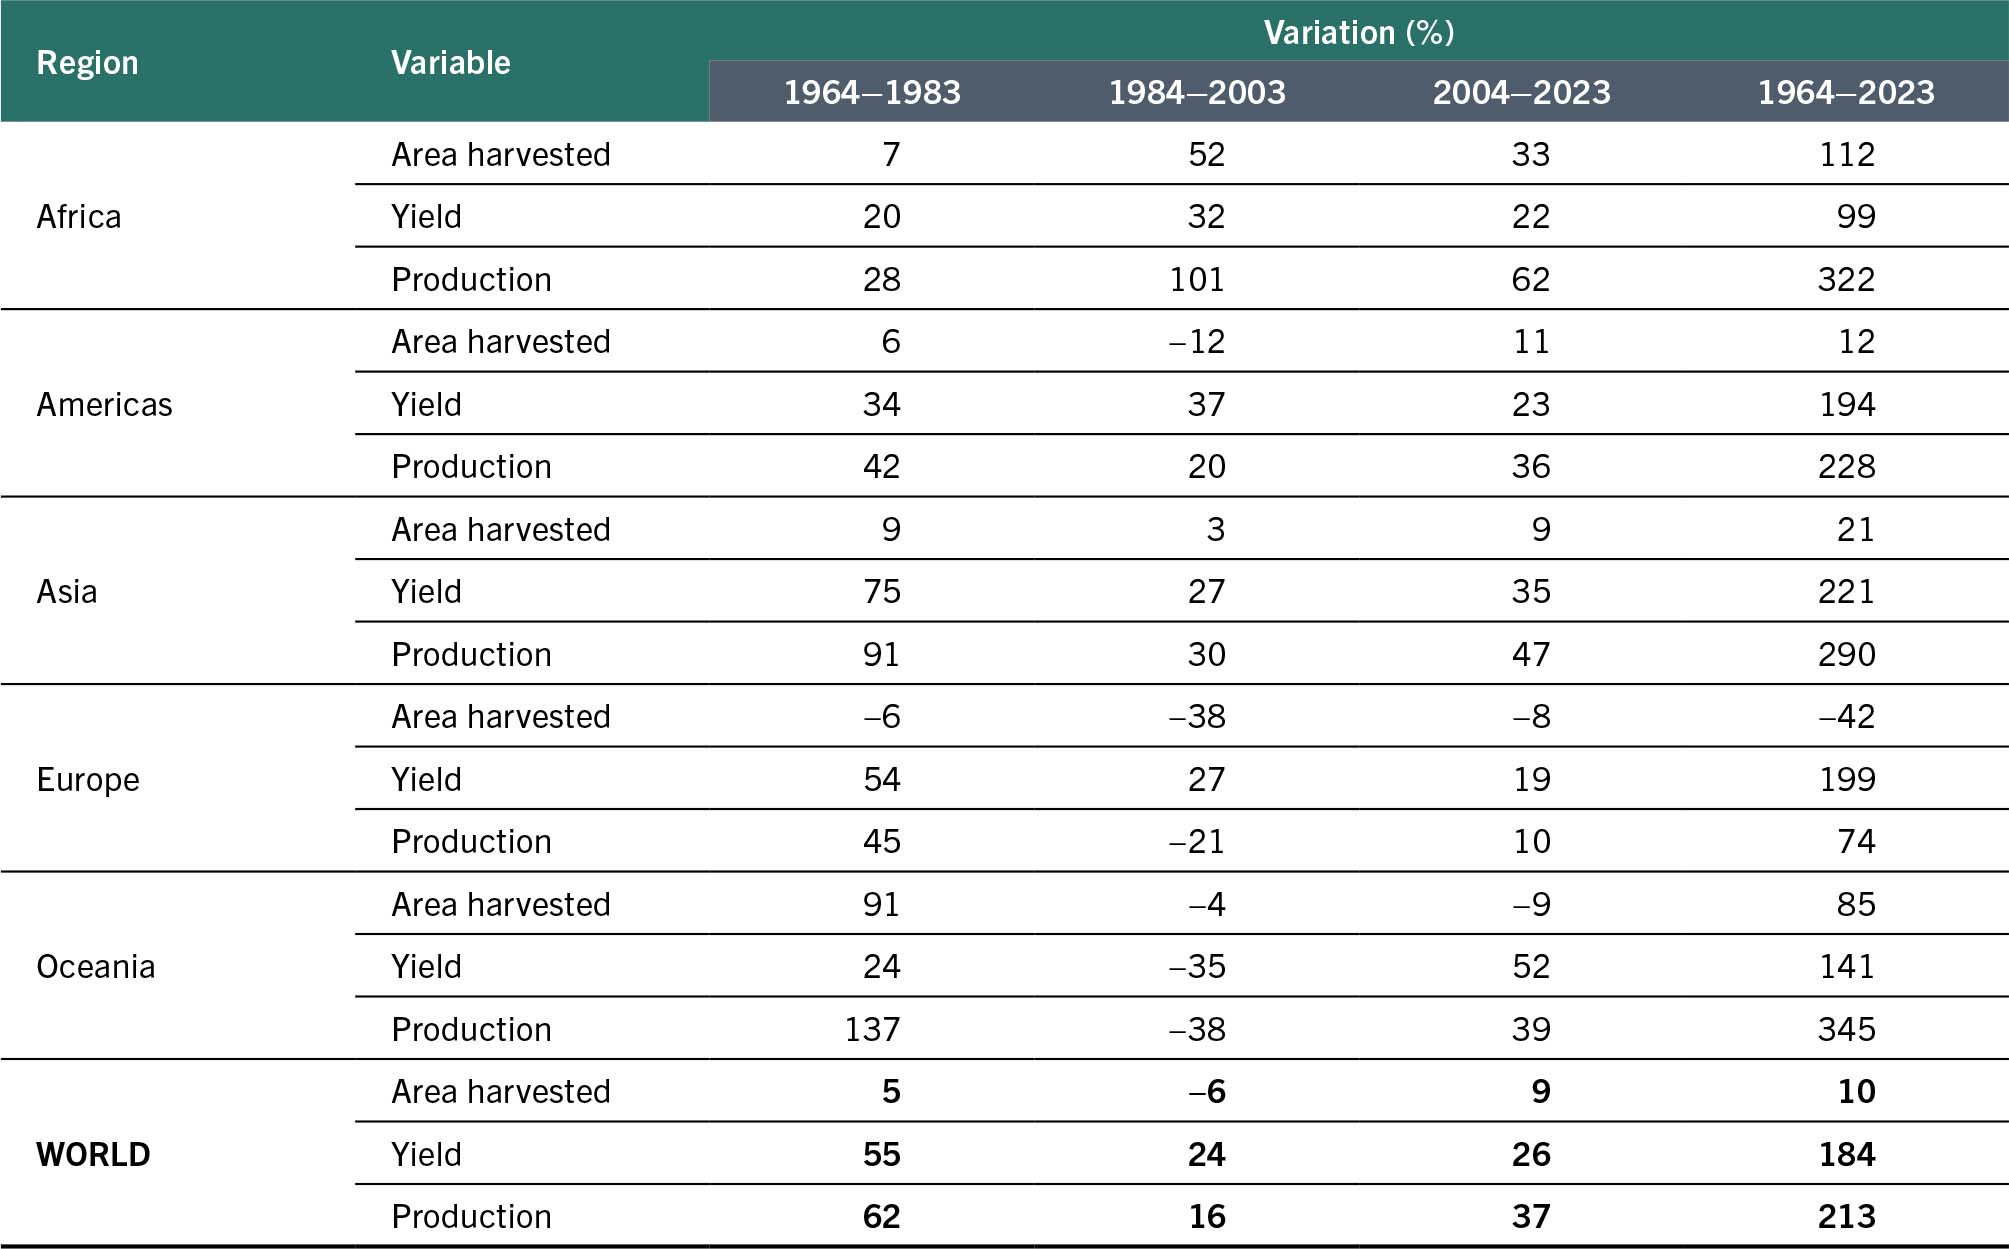
In the case of cereals – the prevailing staples – production over the past 60 years (1964–2023) increased by 213 percent globally (see Table 1). The harvested area increased over the same period by only 10 percent, while yields increased by 184 percent. This implies that yield increases accounted for 95 percent of the production increase, while area expansion accounted for just 5 percent. These percentage differ over space and time. In Europe, the production increase was entirely due to increases in yields, which more than tripled, while the harvested area was reduced by over 40 percent. In Africa, the production increase was due to a combination of yield increase (nearly 100 percent) and area expansion (112 percent), with harvested area more than doubling during this period.
TABLE 1 VARIATION IN AREA, YIELD AND PRODUCTION OF CEREALS BY REGION, 1964–2023
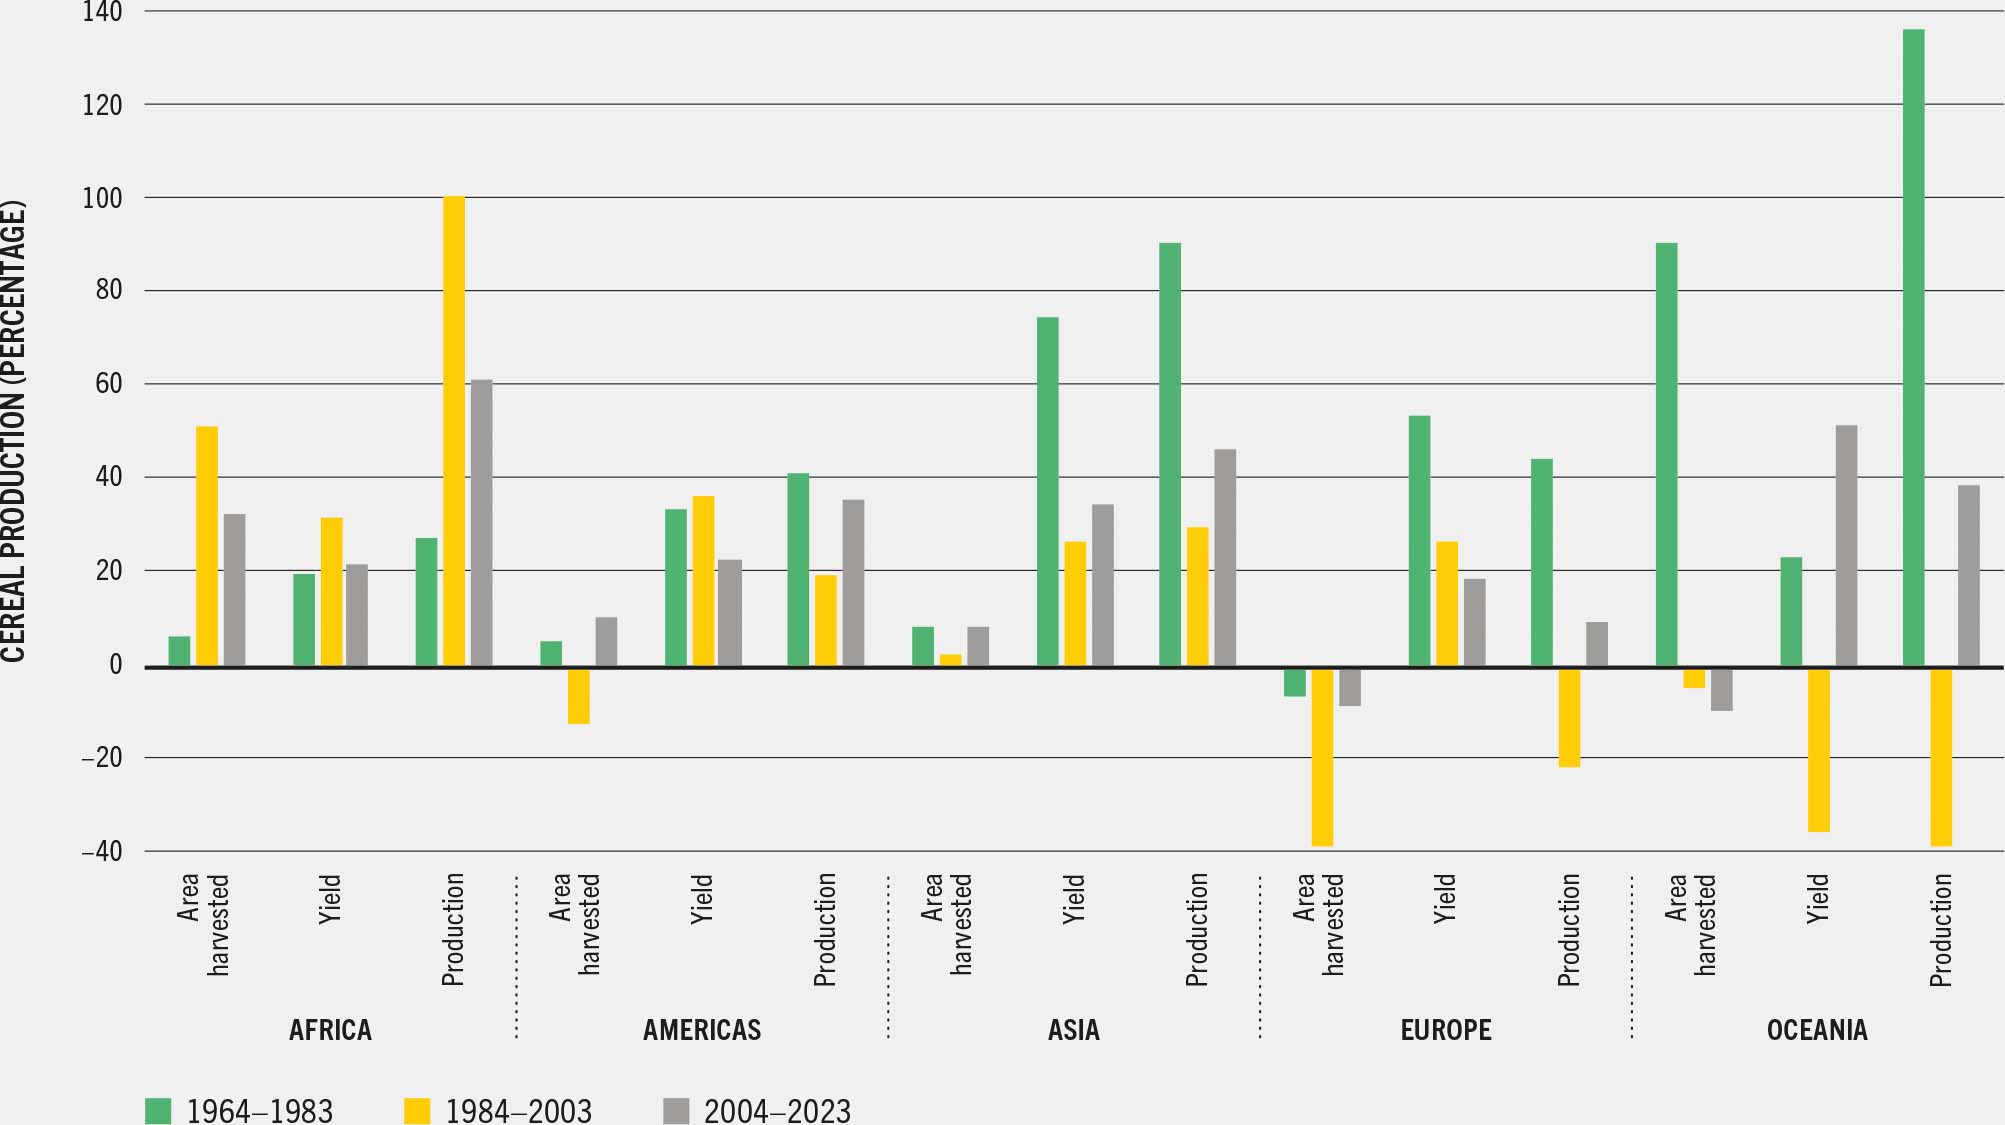
In terms of time, the largest relative yield increase occurred in the period 1964–1983, with an average global yield increase of 55 percent. In the periods 1984–2003 and 2004–2023, the relative yield increase over 20 years was around 25 percent in each case (see Figure 11).
Figure 11 Sources of variation in cereal production, 1964–2023
Cropping intensity is another source of production increase. The ratio of harvested area to arable land gives an indication of the cropping intensity for a given period. Table 2 shows that globally there was an increase of 26 percent in cropping intensity in the period 1964–2023. Increases in Africa and the Americas were the highest, while in Asia the increases were low, and negative in the case of Europe.
TABLE 2 VARIATION IN CROPPING INTENSITY (ALL CROPS), 1964–2023
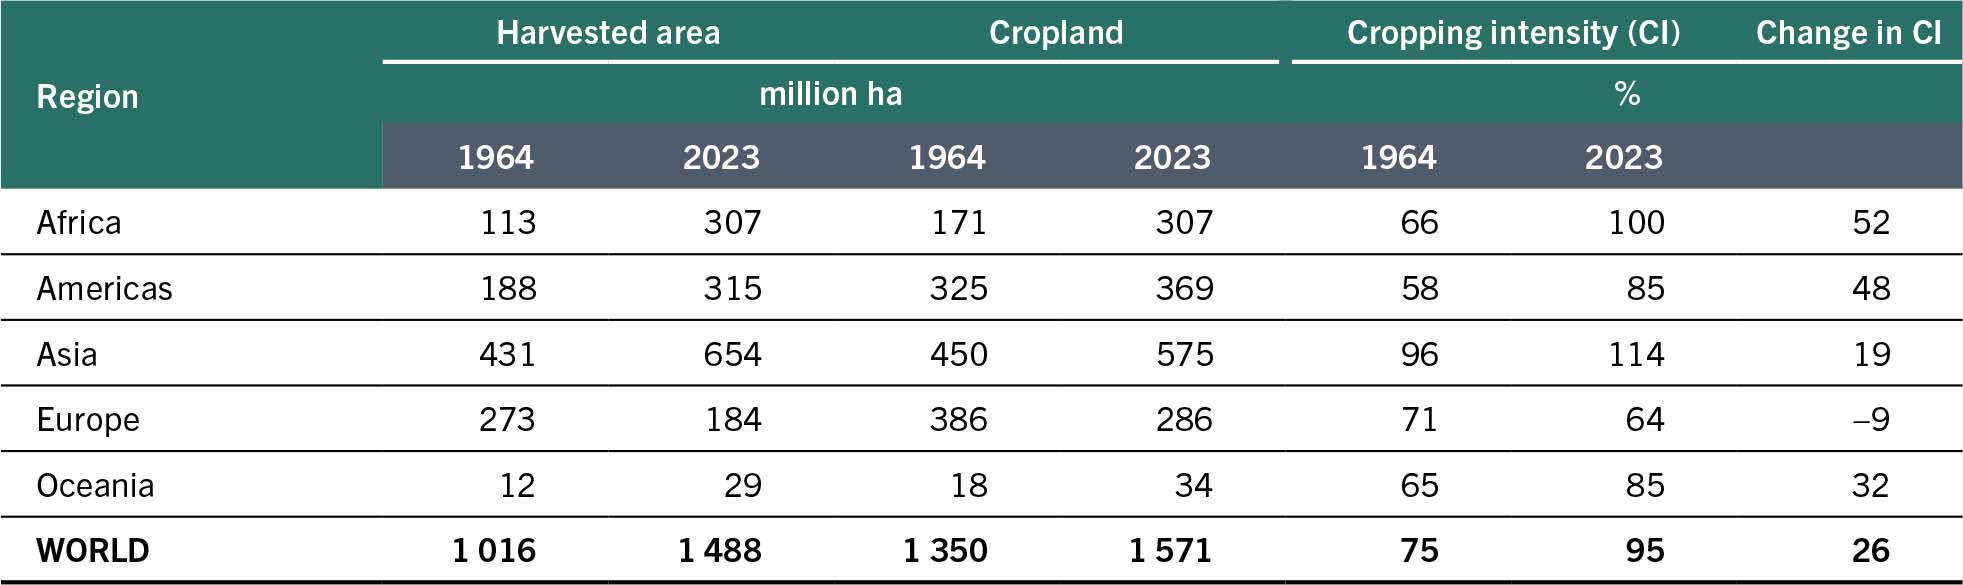
Data on cropping intensities per crop are not available at country level. Based on Table 2, and assuming the same cropping intensity for cereals, Table 3 provides an estimate of the change in extent of cereal cropland over the period 1964–2023.
TABLE 3 ESTIMATE OF LAND USED FOR CEREAL PRODUCTION, 1964–2023
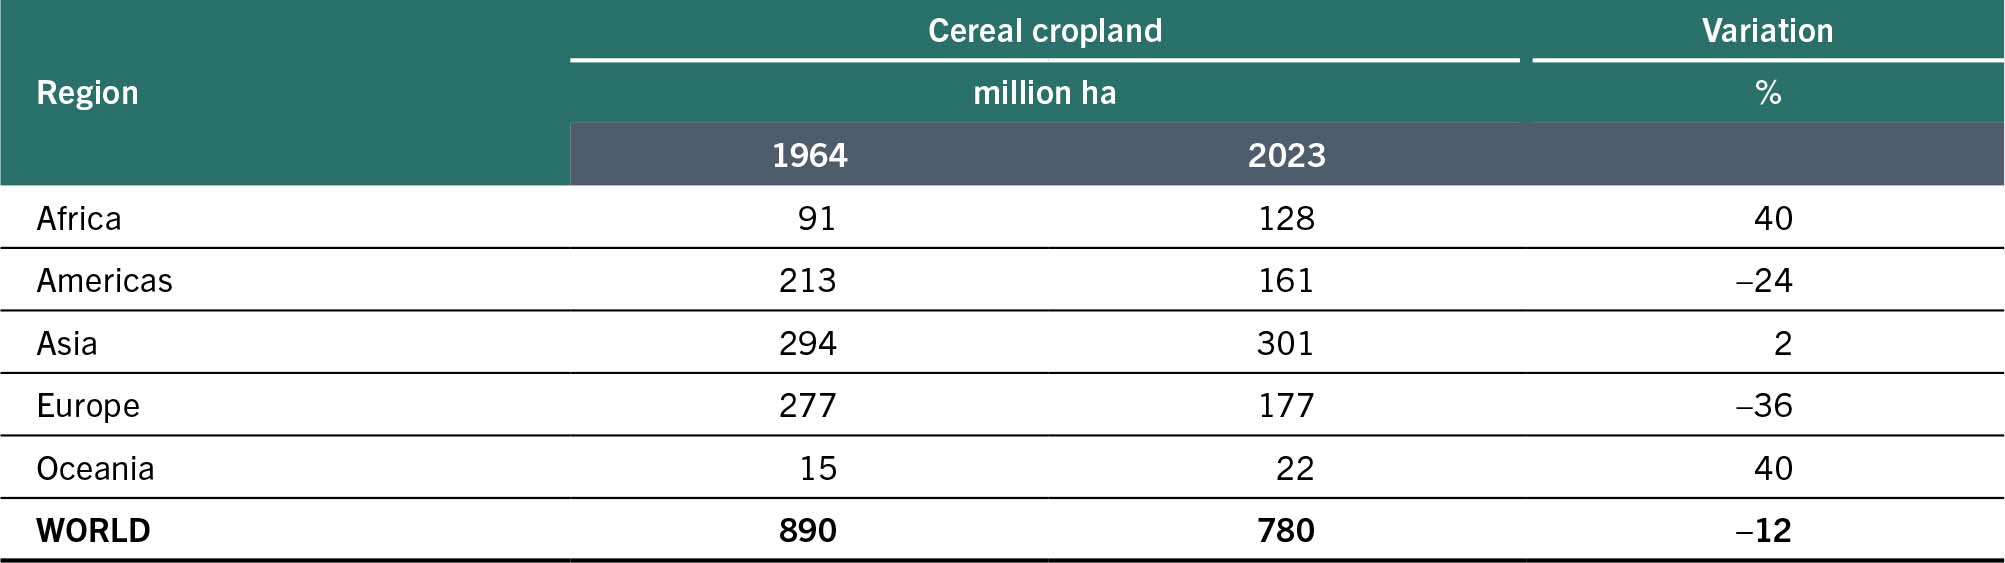
Globally, these figures would suggest that, with a cropping intensity of 75 percent in 1964, cropland under cereals would be 890 million ha, with a harvested area of over 667 Mha. In 2023, with a cropping intensity of 95 percent, cereal cropland would be 780 Mha and the area harvested 741 Mha. Therefore, while the production of cereals over the 60 years between 1964 and 2023 more than tripled, the area harvested increased by 11 percent and the cropland under cereals declined by 12 percent.
For most cereals, it is likely that the global production increase is due solely to agricultural intensification. This is unsurprising given that most agricultural research over the period 1964–2023 focused on staple crops in general, and cereals in particular.
Overall, agricultural land increased globally by a mere 8 percent between 1963 and 2023 (see Table 4). This increase should be mainly attributed to the 16 percent increase in cropland, compared with an increase in permanent meadows and pastures of just 4 percent (see Table 5). The increase in permanent crops (not shown in the table) was higher than the increase in annual crops.
TABLE 4 CHANGE IN EXTENT OF AGRICULTURAL LAND, 1964–2023
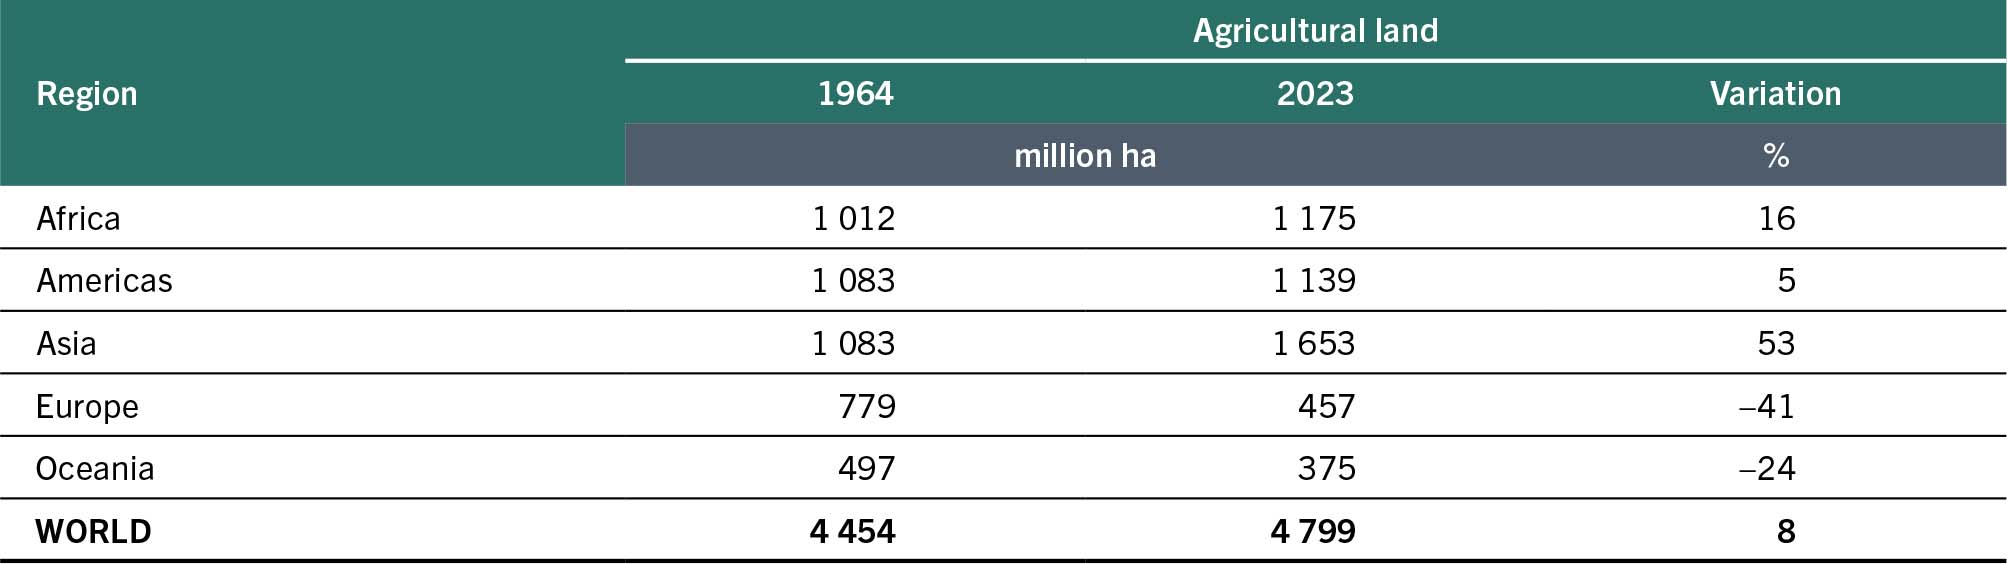
TABLE 5 CHANGE IN EXTENT OF AGRICULTURAL LAND BY LAND-USE CATEGORY, 1964–2023
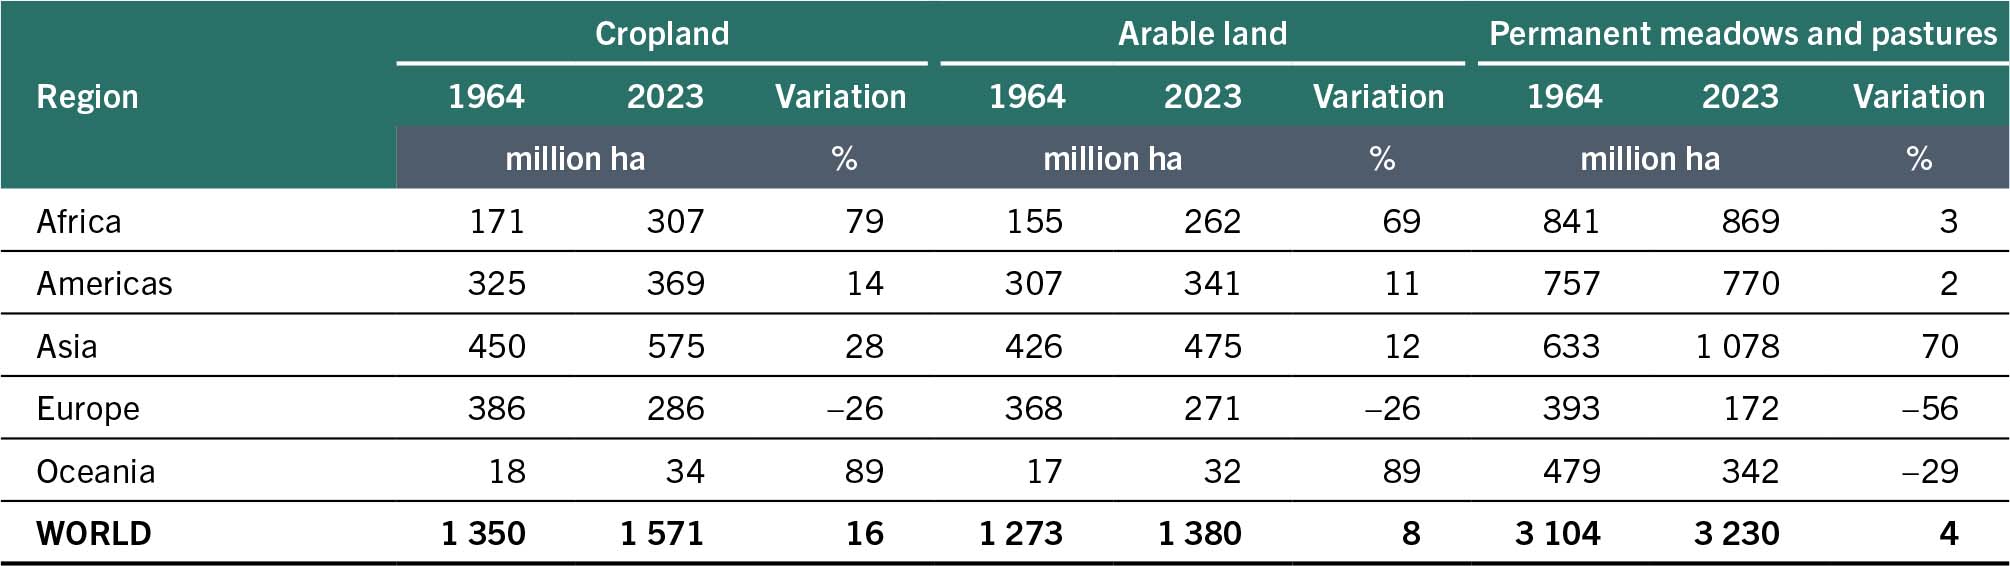
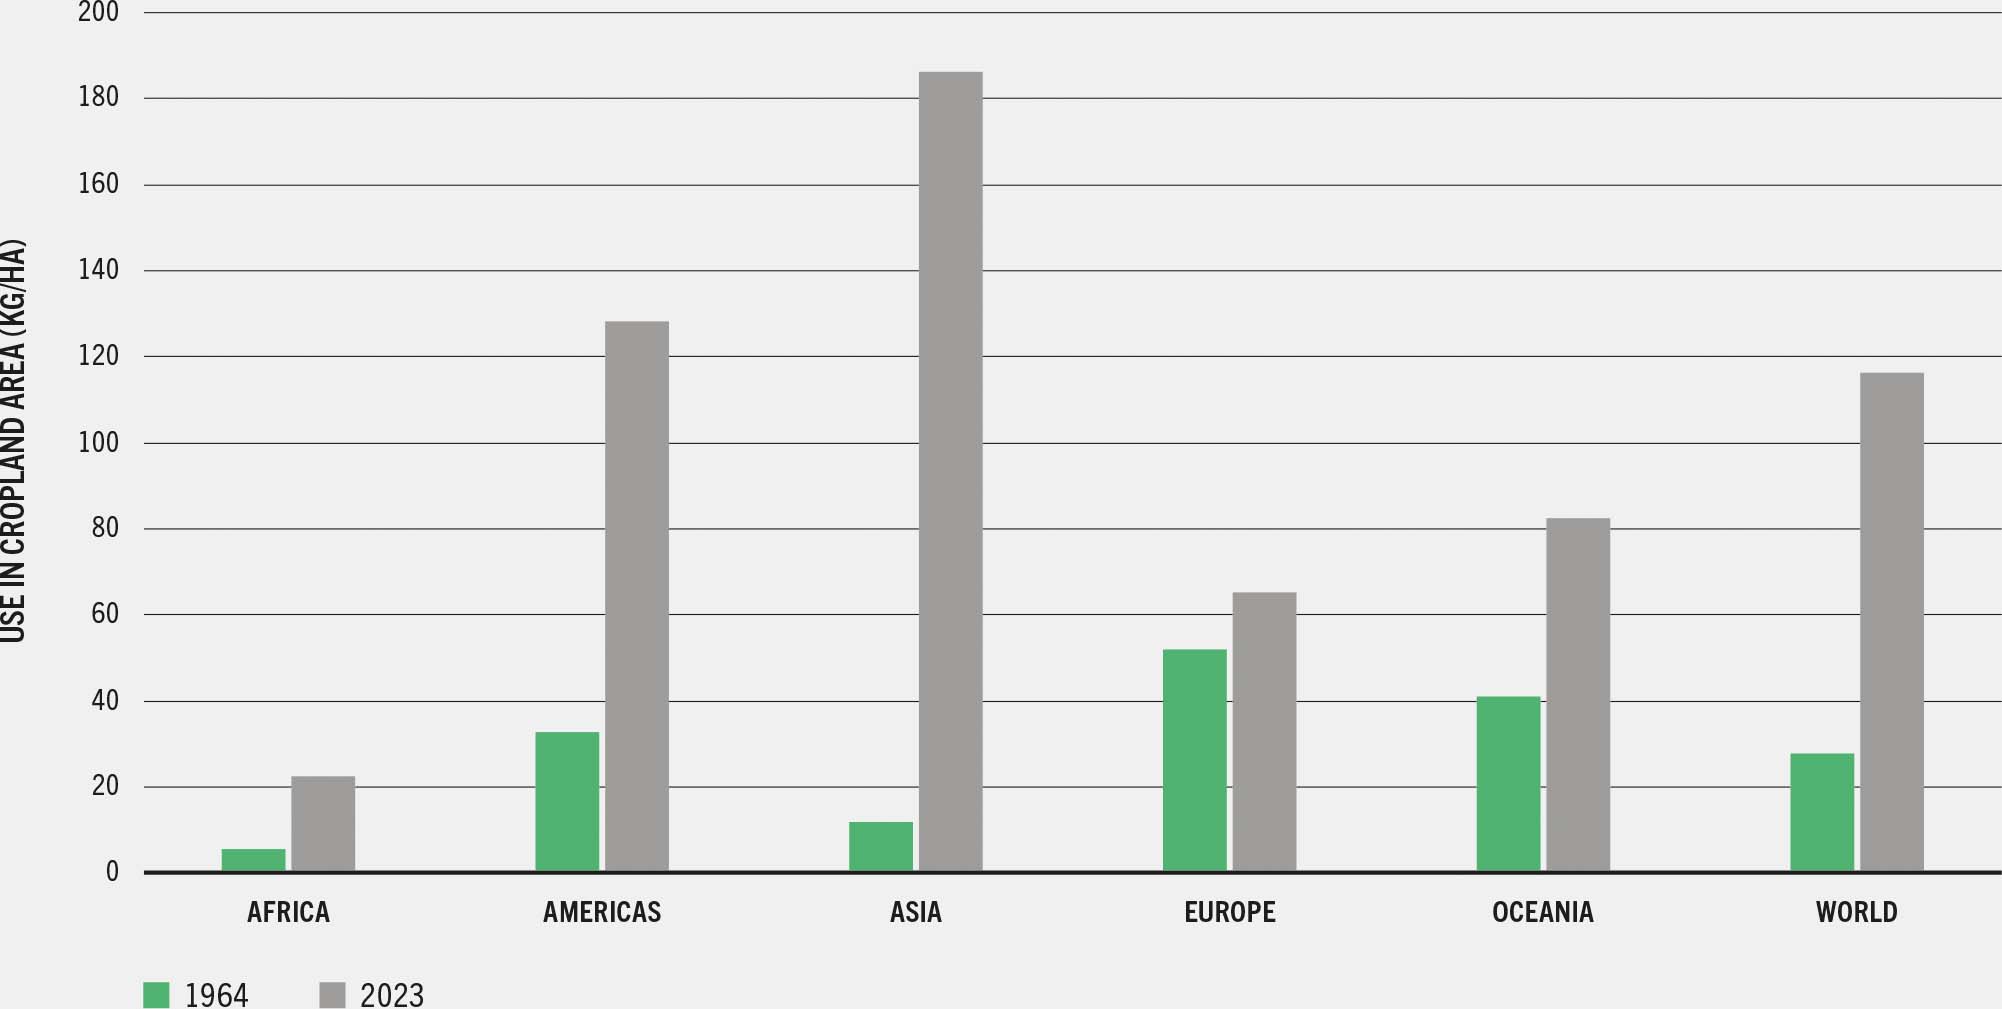
Table 6 and Figure 12 show the role of irrigation and fertilizer in agricultural intensification. The area under irrigation more than doubled between 1964 and 2023 and the use of fertilizers per hectare of cropland in 2023 was more than four times greater than in 1964.
TABLE 6 EVOLUTION OF LAND EQUIPPED FOR IRRIGATION, 1964–2023
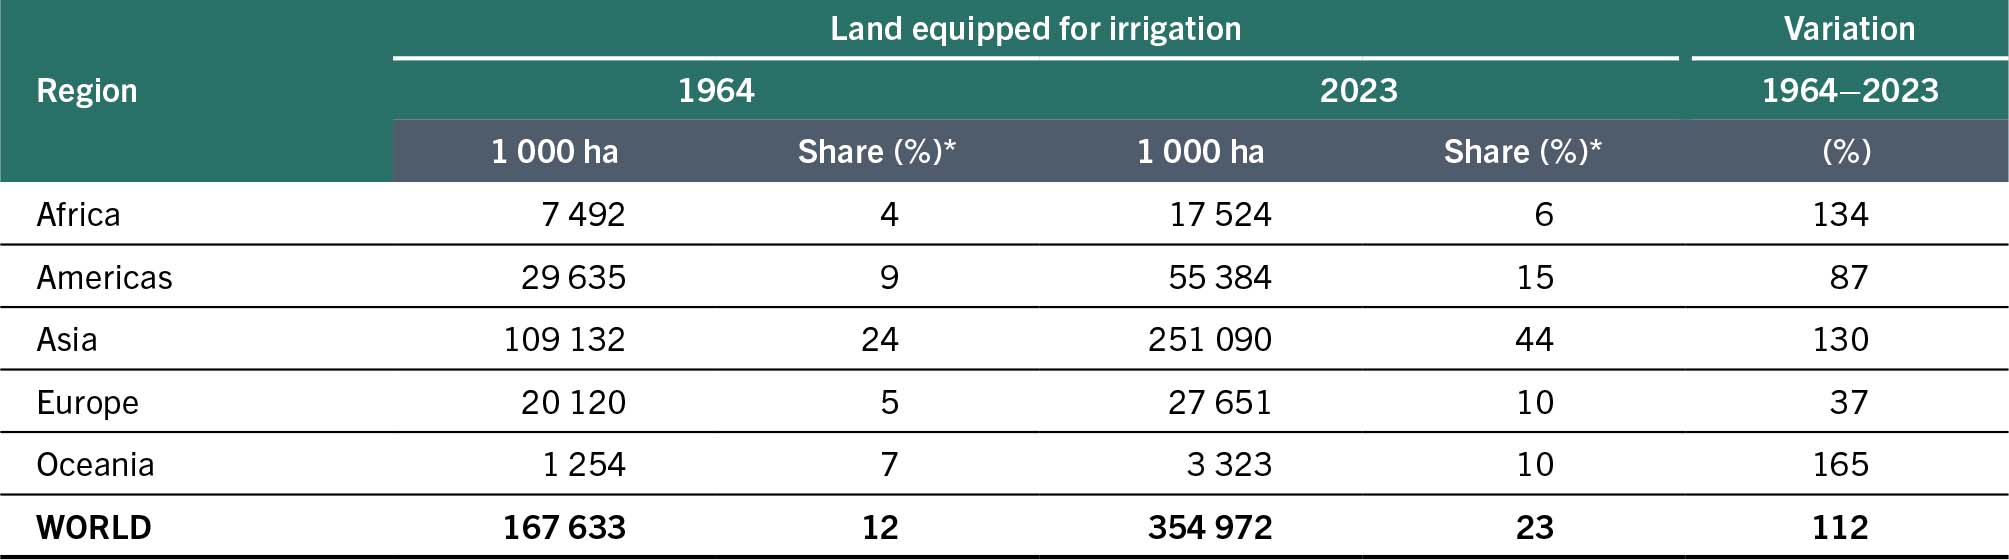
SOURCE: Authors’ own elaboration based on FAO. 2025. FAOSTAT: Land use. [Accessed on 1 July 2025]. https://www.fao.org/faostat/en/#data/RL. Licence: CC-BY-4.0.
Figure 12 Variation in the use of fertilizers in cropland, 1964–2023