Leveraging GAEZ v5 data (FAO and IIASA, 2025a), the suitability and spatial distribution of land for cultivation was evaluated. The analysis focused on rainfed potential, through the evaluation of agroclimatically suitable areas for the 52 crops. The methodology aggregated data across all crops to identify the maximum cultivable extent for each geographic unit, land cover/land use type and management intensity level – specifically low-input and high-input systems (see Box 3). The high-input system represents theoretical scenarios useful to explore and contrast outcomes under different management conditions. GAEZ v5 contains information for the historical scenario 2001–2020 as well as for future climatic scenarios as defined by the IPCC. The analysis further classifies GAEZ crop-specific categories of land suitability into prime land, good land, marginal land and unsuitable land (see Table 8). The land cover classification of GAEZ v5 (FAO and IIASA, 2025b) integrates a cropland agreement map obtained from multiple high-resolution products (Tubiello et al., 2023a) with FAOSTAT statistics. Finally, all the areas listed in the World Database on Protected Areas, totalling approximately 1.8 billion ha (UNEP-WCMC and IUCN, 2022), of which about half are protected forest, were excluded from the analysis.
Box 3Levels of input and management considered in Global Agro-Ecological Zoning
Low-level input/limited management. Under the limited management assumption, the farming system is largely subsistence-based and not necessarily market-oriented. Production is based mainly on the use of local cultivars and labour-intensive techniques. It entails no application of fertilizers, no use of chemicals for pest and disease control, and minimum conservation measures.
High-level input/advanced management. Under the advanced management assumption, the farming system is mainly market-oriented; producing for the market is a management objective. Production is based on improved varieties and mechanization with low labour intensity. It uses optimum applications of nutrients and applies chemical pest, disease and weed control.
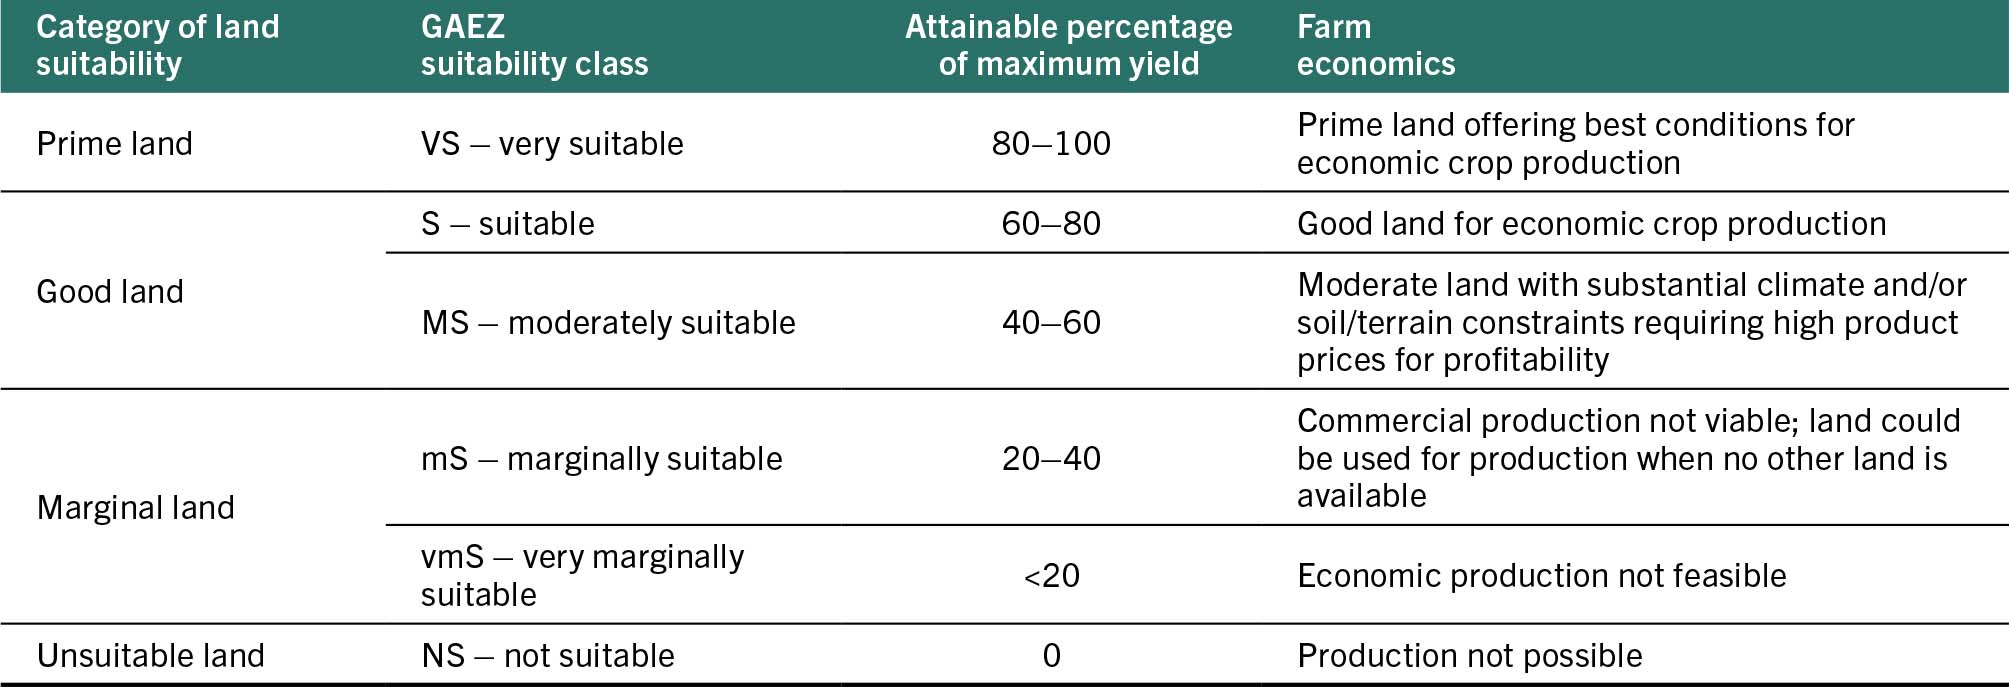
TABLE 8 SUITABILITY CLASSES CONSIDERED IN THE GLOBAL AGRO-ECOLOGICAL ZONING ANALYSIS
It should be emphasized that the assessment of land suitability for cultivation is based only on the characteristics of the land and does not consider existing land use and whether any conversion to cropland is acceptable. For instance, the expansion of agriculture into existing forests is in most cases not a strategic option.
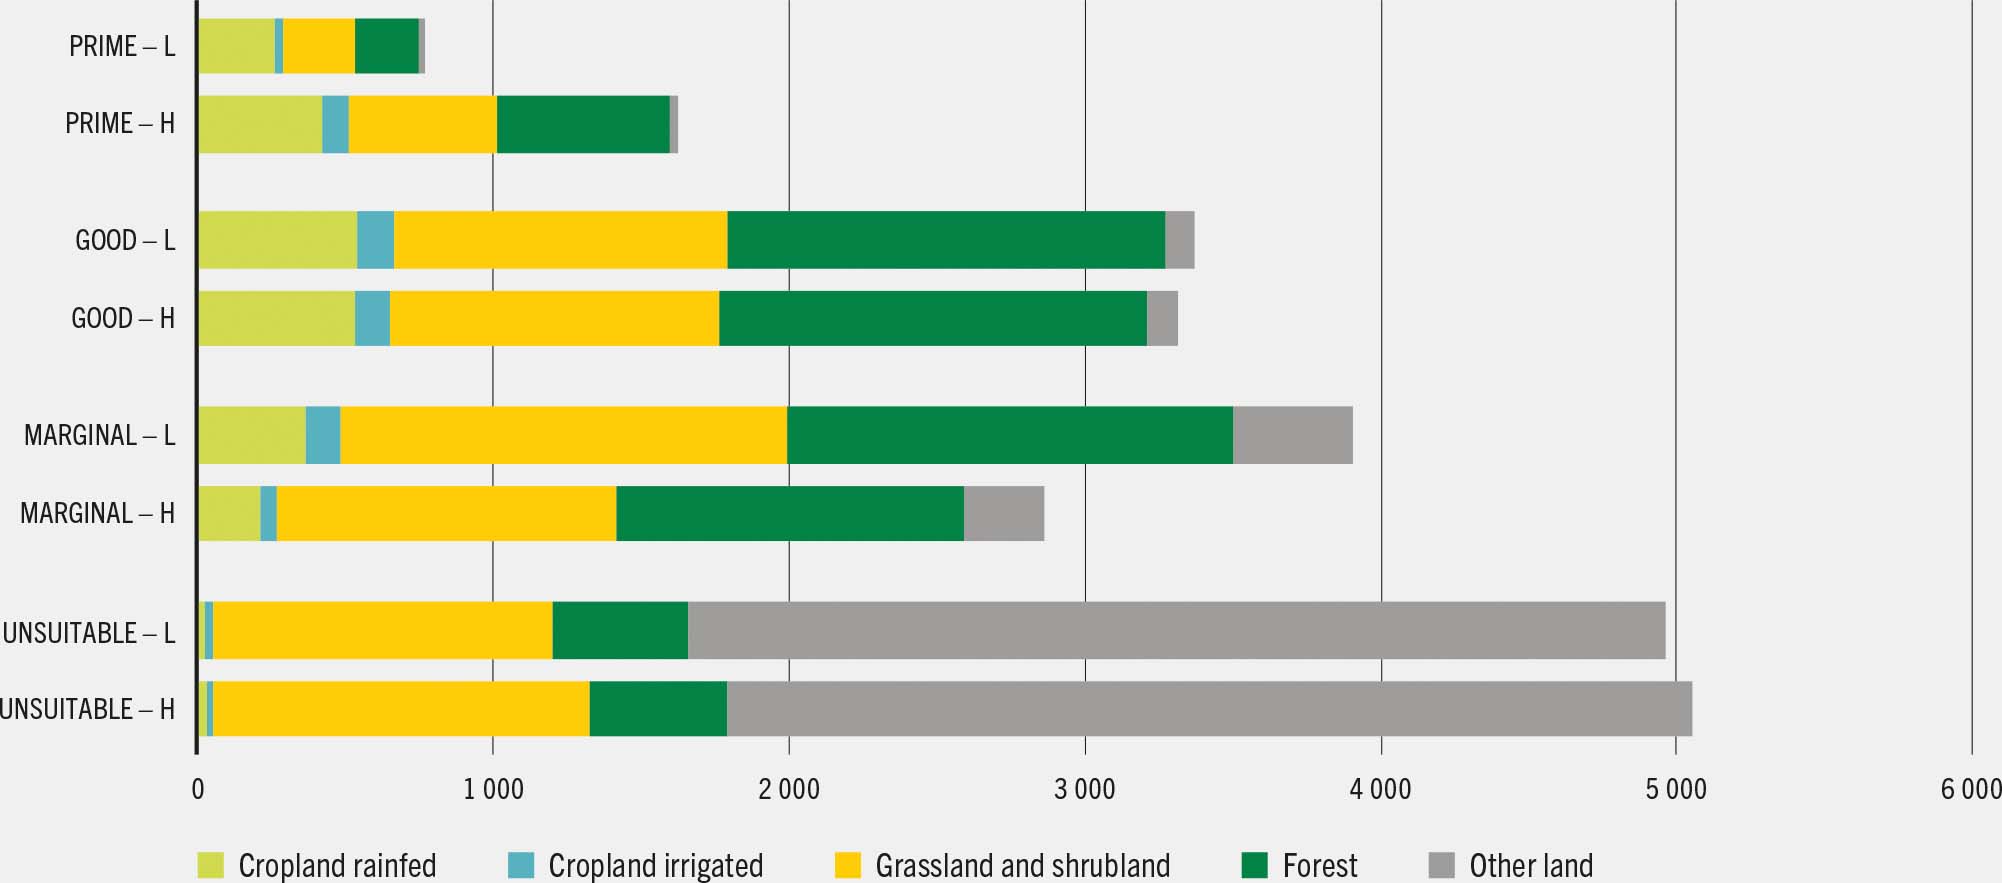
The extent of prime land – land with the highest suitability for cropping – varies significantly depending on the management level. Globally, GAEZ estimates that approximately 800 Mha of land can be considered prime land under a low-input scenario (see Figure 15). This area doubles to over 1 600 Mha under an advanced management scenario, an area larger than the current extent of cropland (FAO, 2025a). Approximately one-fifth of current cropland is classified as prime land under a low-input scenario, and one-third under a high-input scenario. In terms of land cover/land use, prime land is distributed roughly equally between croplands, grasslands and shrublands, and tree-covered areas.
Figure 15 Global distribution of land suitable for cultivation by land cover class, under low-input (L) and high-input (H) management scenarios, average 2001–2020
SOURCE: Authors’ own elaboration based on FAO & IIASA. 2025. Global Agro-ecological Zoning version 5 (GAEZ v5) Model Documentation. [Cited 13 February 2025]. https://www.fao.org/gaez/en
The spatial extent of good land remains stable at about 3 300 Mha across both input scenarios, suggesting lower sensitivity to management intensification. Good land comprises 45 percent of cropland, 40 percent of land used for forest, and nearly 30 percent of land under grassland and shrubland.
About one-third of cropland is classified as marginal under low-input conditions. Implementing advanced management practices would reduce this proportion by nearly half – an inverse trend compared with the trend observed for prime land.
Figure 15 also shows the share of cropland that is irrigated and its distribution across suitability classes. Irrigation removes one of the most important suitability constraints by ensuring adequate soil moisture, making it possible to compensate for erratic or insufficient precipitation and achieve higher production. Over half of the 300 Mha of irrigated cropland are found in prime and good land under the low-input scenario. This proportion rises to over 70 percent under advanced management.
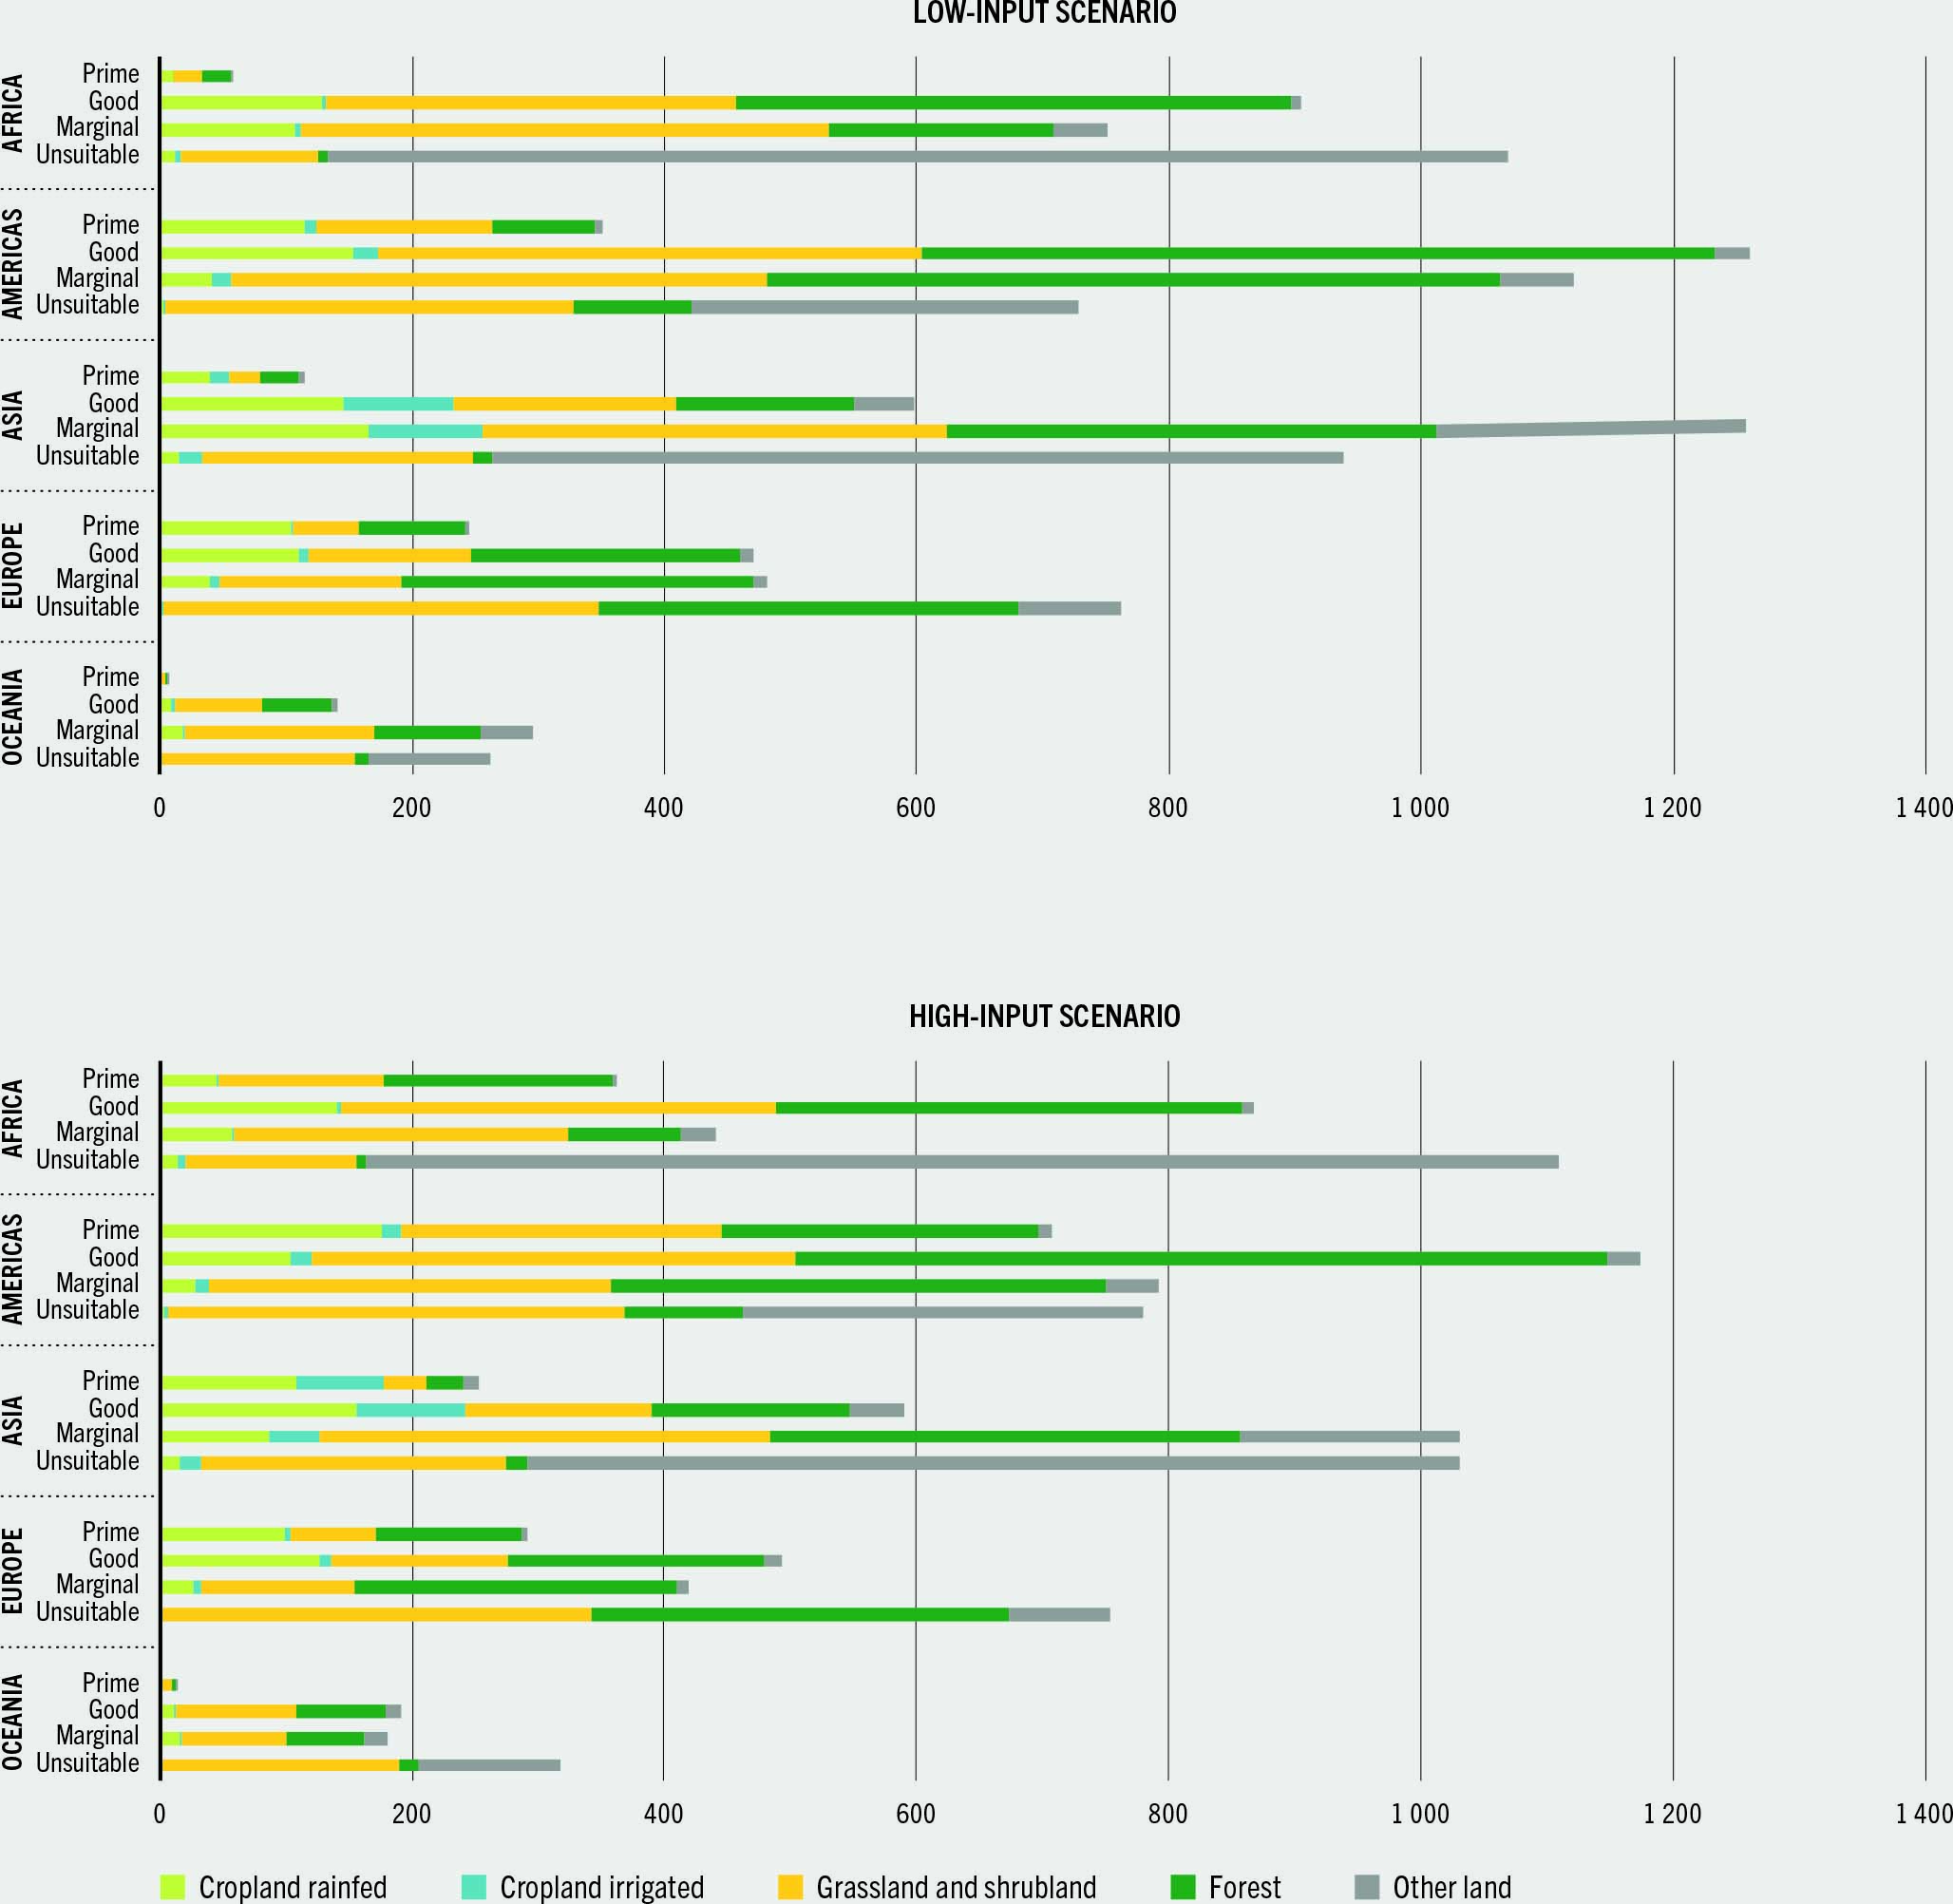
The analysis of the regional distribution of suitable land (see Figure 16) shows considerable differences between regions, including in terms of potential for low-input and high-input management scenarios. The Americas boast the largest area of prime land, spanning nearly 350 Mha in the low-input scenario and more than double that figure in the high-input management scenario. Europe follows with approximately 250 Mha or 32 percent of global prime land in the low-input scenario. In contrast with the Americas, this value grows only slightly under advanced management, indicating that suitable agroclimatic and agroedaphic conditions are prevalent in this region. Asia has approximately 120 Mha of prime land in the low-input scenario and more than double in the high-input scenario. The largest gain in prime land across the two scenarios is observed in Africa, where improved management would determine a sevenfold growth in the extent of prime land, increasing from 55 Mha (low-input) to 360 Mha (high-input). This is especially important given that less than 5 percent of the total land area in Africa has the most favourable conditions for cultivation. Oceania ranks last with only 6 Mha of prime land under low-input conditions, increasing to 14 Mha with advanced management practices.
Figure 16 Regional distribution of land by suitability for prevalent land cover/land use under low-input and high-input management scenarios, average 2001–2020
SOURCE: Authors’ own elaboration based on FAO & IIASA. 2025. Global Agro-ecological Zoning version 5 (GAEZ v5) Model Documentation. [Cited 13 February 2025]. https://www.fao.org/gaez/en
Prime land is used differently across the regions. Under limited management conditions, Africa has less than 20 percent of its prime land under cropland, corresponding to 10 Mha, while a comparable extent of prime land is found under tree-covered areas as well as grassland and shrubland (often coinciding with land used for pastures), amounting to 22 Mha. In Asia and Europe, prime land under cropland accounts for the largest shares of regional prime land (48 and 43 percent, respectively). Both the Americas and Oceania have the largest extents of prime land under grassland and shrubland, with shares of regional prime land of 40 and 60 percent, respectively.
When considering the geographical distribution of land with good suitability for cultivation, the Americas and Africa rank highest with 1 200 Mha and 900 Mha, respectively, under low-input management and comparable extents under advanced management conditions. With a lower extent (approximately 600 Mha of land with good suitability under both management levels), Asia has over 40 percent of its good land used for cropland, while Africa and the Americas both have only 14 percent. Both these latter regions have large shares of their good land under forest and under grassland and shrubland, which significantly restricts opportunities for expansion. The expansion of agriculture into forest is not an option. This report proposes alternative areas for expansion to enhance sustainable food production and, at the same time, safeguard forest and protected areas. Europe has approximately 500 Mha of good land, of which about one-quarter is used for cropland under the two management scenarios. Finally, Oceania has 140 Mha and 190 Mha of good land under low-input and high-input management levels, respectively. Less than 10 percent of this good land is cultivated, while half is under grassland and shrubland.
Asia and the Americas have the greatest extent of marginally suitable land, with 1 200 Mha and 1 100 Mha, respectively, under low-input management. These areas decrease by 16 percent in Asia and by 30 percent in the Americas under more advanced management practices. Africa follows with nearly 800 Mha of marginal land, which is reduced by 43 percent under high-input conditions. Europe has approximately 500 Mha of marginal land under low-input management, decreasing to 420 Mha with advanced practices. In Oceania, marginal lands amount to 300 Mha under low-input scenarios, declining by 40 percent under high-input management.
In theory, a very small share of marginally suitable land should be used for crops. However, under low-input conditions, both Africa and Asia have more than two-fifths of their current cropland on land with marginal suitability; this proportion surpasses 60 percent in Oceania. The Americas and Europe have smaller shares of cropland with marginal suitability – less than 20 percent in both cases. While cultivation is indeed the least frequent use of marginal land across all regions, the extent of cropland in marginal areas indicates a geographical imbalance between demand for and availability of land for cultivation, in particular in Africa and parts of Asia, forcing farmers to cultivate marginal lands. It is also worth noting that while the natural endowment appears to be a limiting factor to cultivation in these regions, data also suggest important opportunities for attaining higher productivity with improved land management. In Africa, significant differences are observed between the two levels of management, with marginal land under cropland decreasing from 120 Mha under low-input conditions to half of that figure under improved management practices. Box 4 discusses options for unlocking the potential of marginal lands.
Box 4Unlocking the potential of marginal lands
Since its initial conceptualization (Ricardo, 1817), the definition of marginal land has remained a subject of debate. Existing definitions vary significantly depending on application purposes and contextual frameworks. Against a backdrop of escalating global food demand driven by population growth and dietary transitions towards resource-intensive diets, the potential of marginal lands to enhance food security has garnered significant global attention.
A growing body of research has investigated marginality through agricultural or arable land-use perspectives. While marginality emerges from multifactorial interactions, studies consistently identify two interlinked underlying determinants: biophysical and socioeconomic factors (Csikós and Tóth, 2023). Marginal land therefore refers to land with low productivity due to biophysical conditions such as rugged terrain, poor soil quality and extreme weather conditions (including scattered and low precipitation), as well as to productive land constrained by socioeconomic factors such as human-induced land degradation, market price instability, land tenure conditions and limited access to markets and infrastructure, which render it incapable of cost-effective production under given conditions.
The literature offers a variety of figures on the extent and prevalence of marginal lands, as different studies employ different methods, assumptions and criteria to estimate the extent of global marginal lands. The Global Agro-Ecological Zoning (GAEZ) methodology used in this report combines climate characteristics and soil and terrain qualities with crop requirements, and estimates the suitability in terms of attainable yield given the different levels of technology and management. It therefore focuses more specifically on biophysical factors.
It is important to note that the boundary between marginal and productive land is not static. Inappropriate land-use activities and a changing climate may lead to the degradation of productive land into marginal land, while – with appropriate technology and land management practices – marginal land can be transformed into productive agricultural land (Csikós and Tóth, 2023).
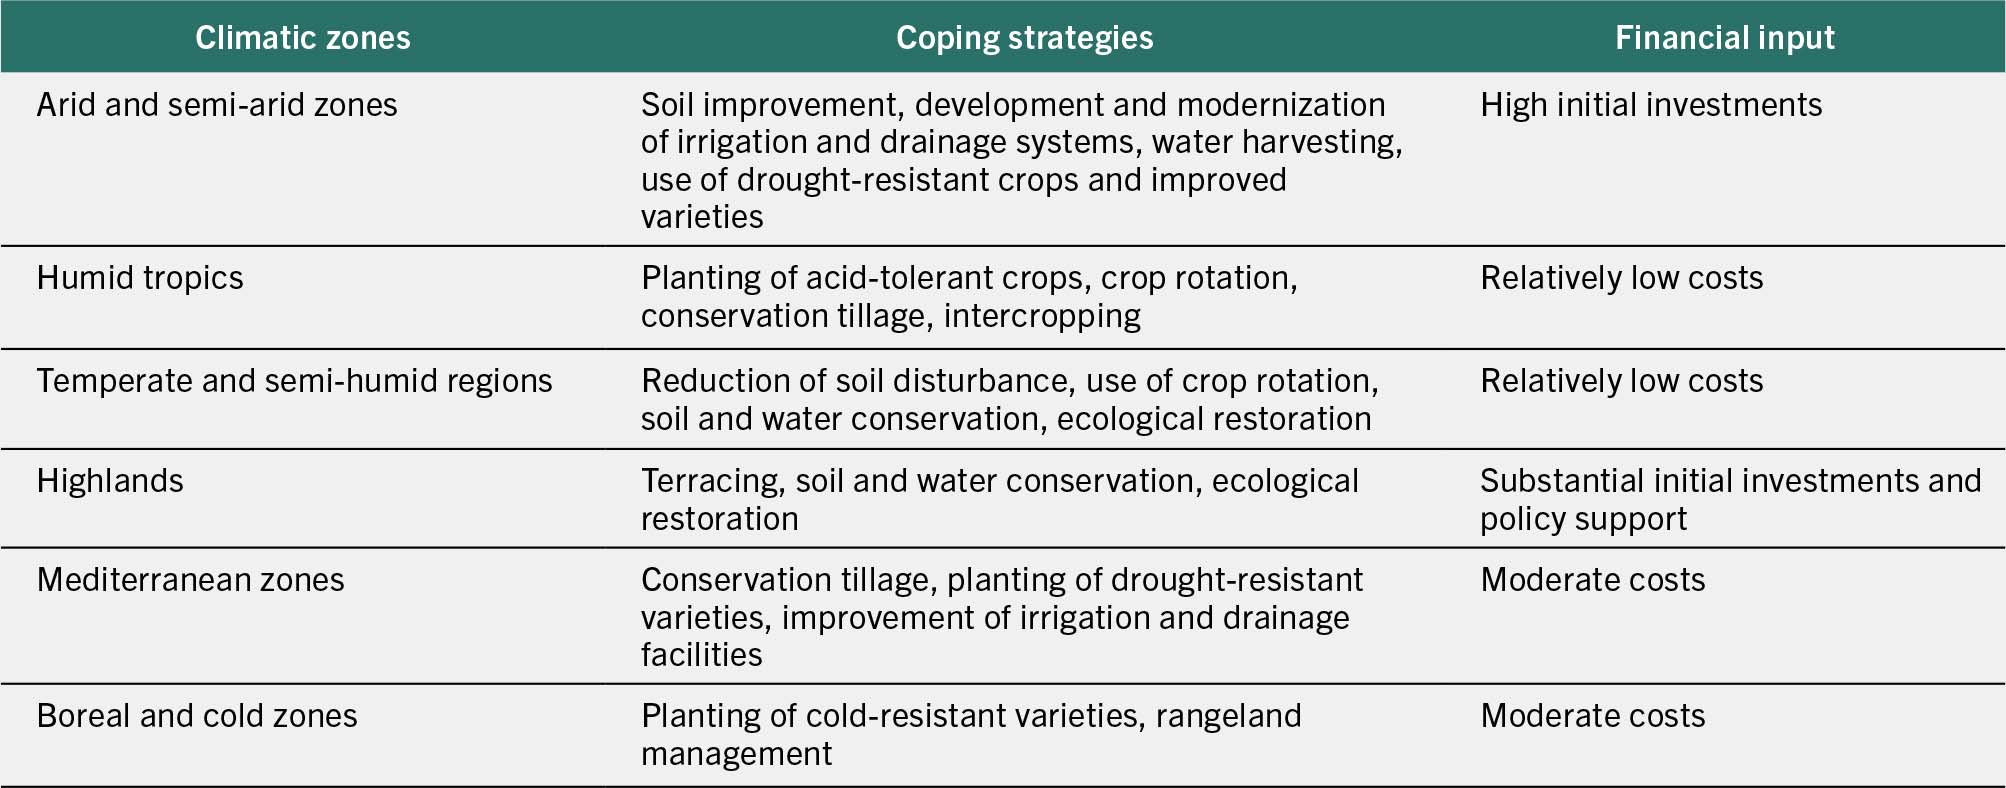
Given the varying characteristics of marginal lands in different regions and the diversity of factors affecting land marginality, the management of marginal lands should be adapted to local conditions. Financial and policy instruments, including flexible policies and practices, need to be developed to achieve the sustainable management of marginal lands. The land suitability and yield gap analyses presented in this report provide information about opportunities to enhance the productivity of marginal lands. Examples of coping strategies for marginal lands are presented in the table.
Looking strictly at land resources, and under the (unlikely) hypothesis that neither productivity levels nor per capita demand change, it would be possible to produce enough food for a projected global population of 9.7 billion in 2050, peaking at 10.3 billion in the mid-2080s. This would mean that cropland would need to increase from its current 1.6 billion ha to 1.9 billion ha in 2050 and 2.1 billion ha in the mid-2080s, which is substantially less than the 4 billion ha of prime and good land currently available. However, this global figure has limited meaning. It does not consider the large variations between regions and between countries; it takes into account neither competition with other uses (including urbanization), nor the degradation of currently used land. Furthermore, whatever increase in cropland occurs, it will be at the expense of other land uses and will further increase the already large environmental footprint of agriculture. Ignoring the competition with other environmental services and the need to address the trade-offs would result in further degradation of the resources, in particular biodiversity and the regulating functions of ecosystems (Fischer et al, 2011).
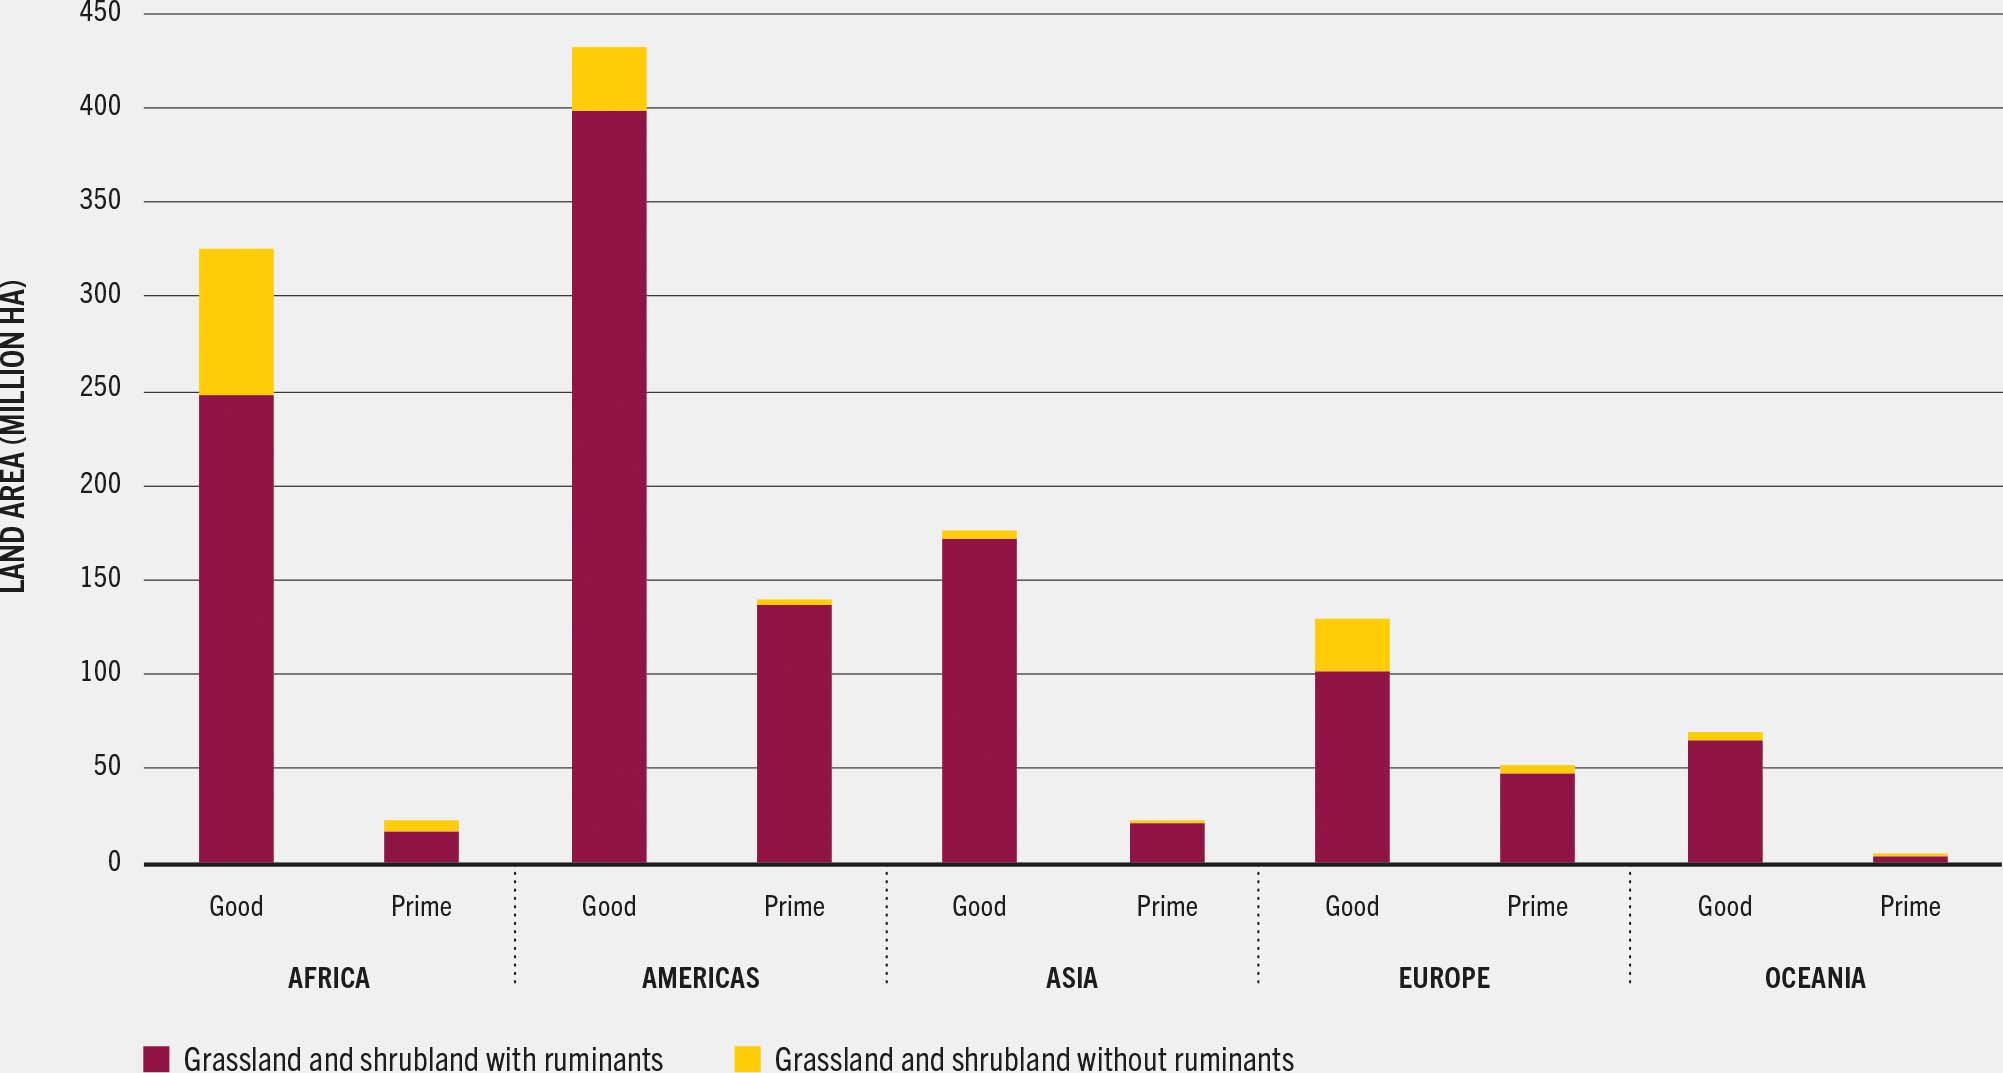
Preserving forest and grassland ecosystems is crucial to address the challenges of climate change and biological diversity. These ecosystems are essential to maintaining global carbon balance (IPCC, 2022) and providing critical products and services (e.g. non-timber forest products, biodiversity, pollination, water quality) that support adaptation and resilience (FAO, 2020). Although prime and good land amount globally to more than 4 billion ha, the opportunities for expansion are limited, as large shares of this land are used by forest or for pastures (see Figure 17). Globally, 160 Mha of primarily good land under grasslands are estimated to be potentially available for cultivation or for mixed livestock–cropping systems. About half of this land is in Africa, with 40 Mha in the Americas and 30 Mha in Europe. Grasslands and shrublands already sustain the livelihoods of millions of people who rely on these ecosystems for food, fuel and fibre, as well as cultural services (Bardgett et al., 2021). For instance, the Sahel Great Green Wall initiative aims to restore 100 Mha of degraded land under agrosilvopastoral systems by 2030. More than 50 Mha – or 10 percent of the total area of interest of this regional effort – are under grazed land (Sacande et al., 2022).
Figure 17 Regional distribution of prime and good land in grassland and shrubland under low-input management and rainfed conditions, with and without grazing animals, 2015